HAL Id: hal-01805264
https://hal.archives-ouvertes.fr/hal-01805264
Submitted on 28 Oct 2020
HAL is a multi-disciplinary open access
archive for the deposit and dissemination of
sci-entific research documents, whether they are
pub-lished or not. The documents may come from
teaching and research institutions in France or
abroad, or from public or private research centers.
L’archive ouverte pluridisciplinaire HAL, est
destinée au dépôt et à la diffusion de documents
scientifiques de niveau recherche, publiés ou non,
émanant des établissements d’enseignement et de
recherche français ou étrangers, des laboratoires
publics ou privés.
multi-model impact projections: land use decisions
under climate impacts uncertainties
K. Frieler, A. Levermann, J. Elliott, J. Heinke, A. Arneth, F. Bierkens, P.
Ciais, D. Clark, D. Deryng, P. Döll, et al.
To cite this version:
K. Frieler, A. Levermann, J. Elliott, J. Heinke, A. Arneth, et al.. A framework for the cross-sectoral
integration of multi-model impact projections: land use decisions under climate impacts uncertainties.
Earth System Dynamics, European Geosciences Union, 2015, 6 (2), pp.447 - 460.
�10.5194/esd-6-447-2015�. �hal-01805264�
www.earth-syst-dynam.net/6/447/2015/ doi:10.5194/esd-6-447-2015
© Author(s) 2015. CC Attribution 3.0 License.
A framework for the cross-sectoral integration of
multi-model impact projections: land use decisions
under climate impacts uncertainties
K. Frieler1, A. Levermann1,2, J. Elliott3,4, J. Heinke1, A. Arneth5, M. F. P. Bierkens6, P. Ciais7, D. B. Clark8, D. Deryng9, P. Döll10, P. Falloon11, B. Fekete12, C. Folberth13, A. D. Friend14, C. Gellhorn1,
S. N. Gosling15, I. Haddeland16, N. Khabarov17, M. Lomas18, Y. Masaki19, K. Nishina19, K. Neumann20,21, T. Oki22, R. Pavlick23, A. C. Ruane24, E. Schmid25, C. Schmitz1, T. Stacke26,
E. Stehfest21, Q. Tang27, D. Wisser28, V. Huber1, F. Piontek1, L. Warszawski1, J. Schewe1, H. Lotze-Campen29,1, and H. J. Schellnhuber1,30
1Potsdam Institute for Climate Impact Research, Potsdam, Germany
2Institute of Physics, Potsdam University, Potsdam, Germany
3University of Chicago Computation Institute, Chicago, Illinois, USA
4Columbia University Center for Climate Systems Research, New York, New York, USA
5Karlsruhe Institute of Technology, IMK-sIFU, Garmisch-Partenkirchen, Germany
6Utrecht University, Utrecht, the Netherlands
7IPSL – LSCE, CEA CNRS UVSQ, Centre d’Etudes Orme des Merisiers, Gif sur Yvette, France
8Centre for Ecology & Hydrology, Wallingford, UK
9Tyndall Centre, School of Environmental Sciences, University of East Anglia, Norwich, UK
10Institute of Physical Geography, J. W. Goethe University, Frankfurt, Germany
11Met Office Hadley Centre, Exeter, UK
12Civil Engineering Department, The City College of New York, New York, USA
13Swiss Federal Institute of Aquatic Science and Technology, Dübendorf, Switzerland
14Department of Geography, University of Cambridge, Cambridge, UK
15School of Geography, University of Nottingham, Nottingham, UK
16Norwegian Water Resources and Energy Directorate, Oslo, Norway
17International Institute for Applied System Analysis, Laxenburg, Austria
18Centre for Terrestrial Carbon Dynamics, University of Sheffield, Sheffield, UK
19Center for Global Environmental Research, National Institute for Environmental Studies, Tsukuba, Japan
20Wageningen University, Laboratory of Geo-information Science and Remote Sensing,
Wageningen, the Netherlands
21PBL Netherlands Environmental Assessment Agency, The Hague, the Netherlands
22The University of Tokyo, Tokyo, Japan
23Max Planck Institute for Biogeochemistry, Jena, Germany
24NASA GISS, New York, New York, USA
25University of Natural Resources and Life Sciences, Vienna, Austria
26Max Planck Institute for Meteorology, Hamburg, Germany
27Key Laboratory of Water Cycle and Related Land Surface Process, Institute of Geographic Sciences and
Natural Resources Research, Chinese Academy of Sciences, Beijing, China
28Center for Development Research, University of Bonn, Bonn, Germany
29Humboldt-Universität zu Berlin, Berlin, Germany
30Santa Fe Institute, Santa Fe, New Mexico, USA
Correspondence to: K. Frieler (katja.frieler@pik-potsdam.de)
Revised: 30 April 2015 – Accepted: 16 May 2015 – Published: 16 July 2015
Abstract. Climate change and its impacts already pose considerable challenges for societies that will further increase with global warming (IPCC, 2014a, b). Uncertainties of the climatic response to greenhouse gas emis-sions include the potential passing of large-scale tipping points (e.g. Lenton et al., 2008; Levermann et al., 2012; Schellnhuber, 2010) and changes in extreme meteorological events (Field et al., 2012) with complex impacts on societies (Hallegatte et al., 2013). Thus climate change mitigation is considered a necessary societal response for avoiding uncontrollable impacts (Conference of the Parties, 2010). On the other hand, large-scale climate change mitigation itself implies fundamental changes in, for example, the global energy system. The associated challenges come on top of others that derive from equally important ethical imperatives like the fulfilment of in-creasing food demand that may draw on the same resources. For example, ensuring food security for a growing population may require an expansion of cropland, thereby reducing natural carbon sinks or the area available for bio-energy production. So far, available studies addressing this problem have relied on individual impact mod-els, ignoring uncertainty in crop model and biome model projections. Here, we propose a probabilistic decision framework that allows for an evaluation of agricultural management and mitigation options in a multi-impact-model setting. Based on simulations generated within the Inter-Sectoral Impact Model Intercomparison Project (ISI-MIP), we outline how cross-sectorally consistent multi-model impact simulations could be used to generate the information required for robust decision making.
Using an illustrative future land use pattern, we discuss the trade-off between potential gains in crop production and associated losses in natural carbon sinks in the new multiple crop- and biome-model setting. In addition, crop and water model simulations are combined to explore irrigation increases as one possible measure of agricultural intensification that could limit the expansion of cropland required in response to climate change and growing food demand. This example shows that current impact model uncertainties pose an important challenge to long-term mitigation planning and must not be ignored in long-term strategic decision making.
1 Introduction
Climate change mitigation and rising food demand drive competing responses (Falloon and Betts, 2010; Warren, 2011), resulting in, for example, competition for land be-tween food and bio-energy production (Godfray et al., 2010a; Searchinger et al., 2008; Tilman et al., 2009). Given a certain
level of global warming and CO2concentration, the required
area of land of food production is determined by (1) food demand driven by population growth and economic develop-ment, (2) human management decisions influencing produc-tion per land area, and (3) biophysical constraints limiting crop growth and nutrients or water availability for irrigation under the management conditions considered. Similarly, the land area required to meet a certain climate mitigation target depends on (1) the amount of energy to be produced as bio-energy and the required amount of natural carbon sinks, (2) human decisions determining the intensity of bio-energy pro-duction per land area, and (3) bio-physical constraints regard-ing the production of bio-energy per land area and potential losses of natural carbon sinks under climate change. We con-sider climate protection by bio-energy production and carbon storage in natural vegetation as examples of additional con-straints on land use (LU) that are relatively straightforward to quantify. However, other ecosystem services could impose further constraints that could be integrated if it were possible to describe them in a quantitative manner based on available
model outputs or external sources. For example, Eitelberg et al. (2015) showed that different assumptions with regard to protection of natural areas can lead to a large variation of estimates of available cropland.
Assuming certain demands for food and energy (point 1), individual societal decisions (point 2) have to be evaluated and adjusted in the context of the competing interests. Here, we focus on the question of how the uncertainty in (bio-) physical responses to societal decisions (point 3) can be rep-resented in this evaluation. Based on an illustrative analy-sis of multi-model impact projections from different sectors, we show that the uncertainties associated with future crop yield projections, changes in irrigation water availability, and changes in natural carbon sinks are considerable and must not be ignored in decision making with regards to climate protection and food security. Due to the high inertia of energy markets and infrastructure mitigation decisions are long-term decisions that may not allow for ad hoc decisions in the light of realized climate change impacts (e.g. Unruh, 2000).
Models already exist that couple surface hydrology, ecosystem dynamics, crop production (Bondeau et al., 2007; Rost et al., 2008), and agro-economic choices (Havlik et al., 2011; Lotze-Campen et al., 2008; Stehfest et al., 2013), which allow issues such as carbon cycle implications of LU changes and irrigation constraints to be addressed. These models provide possible solutions for LU under competing interests. However, integrative analyses usually rely only on
individual impact models, without resolving the underlying uncertainties resulting from our limited knowledge of bio-physical responses.
There are also a number of detailed, sector-specific stud-ies covering a wide range of process representations and pa-rameter settings not represented by single, integrative stud-ies (Haddeland et al., 2011 (water); Rosenzweig et al., 2014 (crop yields); Sitch et al., 2008 (biomes)). A comprehensive integrative assessment, as requested by the Intergovernmen-tal Panel on Climate Change (IPCC), must cover the full uncertainty range spanned by these models. Such an assess-ment should not only quantify uncertainties associated with climate model projections, but also account for the spread across impact models. However, so far a full integration of these sector-specific multi-model simulations has been hin-dered by the lack of a consistent scenario design.
Owing to its cross-sectoral consistency (Warszawski et al., 2013a), the recently launched Inter-Sectoral Impact Model Intercomparison Project (ISI-MIP, www.isi-mip.org) pro-vides a first opportunity to bring the dimension of multiple impact models to the available integrative analyses of cli-mate change impacts and response options. Here we propose a probabilistic decision framework to explore individual so-cietal decisions regarding agricultural management and cli-mate change mitigation measures in the light of the remain-ing uncertainties in biophysical constraints. In this paper we will describe the additional steps required to provide a basis for robust decision making in the context of uncertainties in climate change impacts.
2 A probabilistic decision framework
Let us consider a certain greenhouse gas concentration sce-nario and its associated climate response described by a general circulation model (GCM); e.g. Representative Con-centration Pathway 2.6 (RCP) (van Vuuren et al., 2011) in HadGEM2-ES, or any other pathway or climate model. Then a framework already exists for combining this RCP with dif-ferent storylines of socioeconomic development (e.g. popula-tion growth, level of cooperapopula-tion, etc.), the Shared Socioeco-nomic Pathways (SSP, van Vuuren et al., 2013), which pro-poses different political measures, e.g. bringing high popu-lation growth in line with a low emission scenario. Within the decision framework, we assume that certain demands for food, bio-energy, and natural carbon sinks have been derived based on this process of merging an SSP with the considered RCP. Food demand could, for example, be derived from pop-ulation numbers and the level of economic development by extrapolation from empirical relationships (Bodirsky et al., 2015). Within this setting, we propose a probabilistic deci-sion framework that allows for an evaluation of agricultural management options determining food production (e.g. with regard to fertilizer input, irrigation fractions, or selections of crop varieties), in combination with decisions about the
Probability of Climate
Protection Failure c f
Exemplary Food Production Area F
Exemplary Area of Natural Carbon Sinks or Bioenergy Production N = Total Area - F
Probability Density
Probability Density
Required Food Production Area F
Required Area of Natural Carbon Sinks or Bioenergy Production N
Figure 1.Concept of a probabilistic decision framework allowing for an evaluation agricultural management decisions under uncer-tainty of biophysical responses. Red PDF: unceruncer-tainty associated with the area of cropland required to fulfil future food demand. Blue PDF: uncertainty associated with the (natural) carbon sinks and stocks required to ensure climate protection.
intensity of bio-energy production and protection of natural carbon sinks. The approach is designed to account for uncer-tainties in responses of crop yields and natural carbon sinks to management, climate change, and increasing atmospheric
CO2 concentrations as represented by the spread of
multi-model impact projections. Within this framework, long-term decisions could be based on the likelihood of fulfilling the demand for bio-energy production and natural carbon sinks while at the same time ensuring food security.
To describe the scheme, let us first consider a simplistic situation where the area required for food production and the area required for bio-energy production and natural carbon sinks are described in a one-dimensional way, i.e. by their extent and independent of spatial patterns. Then the deci-sion framework can be described by two probability density functions (PDFs, see Fig. 1): the red PDF (f) in the upper panel of Fig. 1 describes our knowledge of the required food-production area given the management option to be assessed under the considered RCP and climate model projection. The width of the distribution is fully determined by uncertain-ties in crop yield responses to the selected management and
changes in climate and CO2 concentrations. Intensification
of production, for example by increasing irrigation or fertil-izer use, shifts the PDF to the left, since less land would be required to meet demand.
The blue PDF (c) illustrates our knowledge of the required land area to be maintained as natural carbon sinks, or used for bio-energy production, in order to fulfil the prescribed demands. In this case, the width of the distribution depends on, for example, uncertainties regarding the capacity of
natu-ral carbon sinks, the yields of bio-energy crops under climate change, and the efficacy of the considered management deci-sions. Assuming higher efficiency in bio-energy production per land area shifts the distribution to the right.
Mitigation strategies must now consider the physical trade-off between cropland area (F ) and the area available for retention of natural carbon sinks and stocks or bio-energy production (N): N = T − F, where T = total available area. Assuming food demand will always be met, even at the ex-pense of climate protection, the probability of climate pro-tection failure (underproduction of bioenergy, or insufficient carbon uptake by natural vegetation) is given by
P =
∞∞
Z Z
0 T−F
c(N) dNf (F) dF.
Here, for any food production area F, the probability that more than the remaining area N = T − F is needed to ful-fil the demand for bioenergy and carbon sinks is described by the inner integral and the blue area in Fig. 1. The proba-bility of climate protection failure given that food demand will always be fulfilled is the average of these probabili-ties of climate protection failure weighted according to the PDF describing the required food production area. In the case that the probability is higher than acceptable, the agricultural management decisions and mitigation measures must be re-vised and re-evaluated.
Assuming that the uncertainties in projected crop yields, bio-energy production and carbon sinks can be captured by multi-impact model projections, the probability can be ap-proximated in the following two step approach.
Firstly, multiple crop model simulations (i) under the con-sidered management assumptions and climate projections are
translated into food production areas Fi, fulfilling the
con-sidered demand (see yellow bars in Fig. 2). The translation can be done by agro-economic LU models such as MAg-PIE (Model of Agricultural Production and its Impacts on the Environment) (Lotze-Campen et al., 2008) or GLOBIOM (Global Biosphere Management Model) (Havlik et al., 2011). The diversity of these models used to determine “optimal” LU patterns based on expected crop yields can be considered as an additional source of uncertainty in LU patterns. It can be implemented into the scheme by applying multiple eco-nomic models, i.e. increasing the sample of LU patterns to
n =number of crop models × number of economic models.
However, since the differences in LU patterns introduced by different economic models may be due to different “societal rules” for land expansion, this component may rather be con-sidered as belonging to the “socioeconomic decision” space. In this case they can be handled separately from the uncer-tainties introduced by our limited knowledge about biophys-ical responses as represented by the crop models. Most agro-economic models also account for feedbacks of LU changes or costs of intensification on prices, demand, and trade (Nel-son et al., 2013). Since in our decision framework demand
Food demand x x x x x x
Crop models (i) (x Water models (j)) Crop models x Biome models (k) Fij T - Fij = Nij Probability of climate protection failure
Demand for bio-energy and natural carbon sinks
…
Figure 2.Implementation of the probabilistic decision framework based on multi-model impact projections. Step 1: food demand is translated into required food production area (F) based on multi-crop model simulations (i) (potentially combined with multiple wa-ter model simulations (j ) to account for irrigation wawa-ter constraints) under a fixed management assumption (yellow bars). T = total land area available for food or bio-energy production and conservation for natural vegetation. N = land area left for bio-energy production or natural vegetation assuming future food demand will always be fulfilled (green bars). Step 2: each pattern Nij is evaluated if it
is sufficient to fulfil a pre-determined demand for natural carbon sinks and bioenergy production based on multiple crop model and biome model simulations (green tick marks show agreement and red crosses failure).
is considered to be externally prescribed, one could even in-troduce much more simplified, but highly transparent, allo-cation rules driven only by maximum yields, assumed costs of intensification or land expansion, and intended domestic production.
Then, each individual food production pattern leaves a
certain land area Ni for bio-energy production and
conser-vation of natural carbon sinks (Ni=T − Fi, green bars in
Fig. 2). Increased irrigation could reduce the required food production area, leaving more area for bio-energy produc-tion and conservaproduc-tion of natural carbon sinks, but potential irrigation is limited by available irrigation water. These con-straints can be integrated using consistent multi-water model simulations (j ) which provide estimates of available irriga-tion water. Combining these with the individual crop model simulations leads to an array of individual estimates of the
required land area Fij.
Secondly, each land area Nij=Tij −Fij has to be
evalu-ated by a set of crop model and biome model simulations to test if it allows for the required bio-energy production under the assumed management strategy and the required uptake of carbon. These individual evaluations (illustrated in Fig. 2 by green tick marks for success and red crosses for failure) allow for an estimation of the probability of climate protec-tion failure in terms of the number of failures per number of
impact model combinations. Again alternative decisions on bio-energy production could change the probabilities. Note that the intensity of bio-energy production will also be con-strained by the available irrigation water (van Vuuren et al., 2009). Thus, though not indicated in Fig. 2, the evaluation may also build on multi-water model simulations similarly to the projected food production area.
For this kind of evaluation, it is important for the required impact simulations to be forced by the same climate input data, as done in ISI-MIP. Otherwise the derived LU patterns would be inconsistent. Furthermore, the flexible design of the ISI-MIP simulations allows for an evaluation of differ-ent LU patterns using a number of existing crop model and biome model simulations, without running new simulations (see Sect. 3). To date, the available crop model and biome model simulations have not been translated into “required area for food production” or “required areas for bio-energy production and natural carbon sinks” except for a first at-tempt to quantify food production areas based on multiple crop and economic models (Nelson et al., 2013). However, in that study, the settings were limited to four out of seven
crop models and to a subset of simulations where CO2
con-centrations were held constant at present-day levels. Here we restrict our analysis to an illustration of the relevance of impact model uncertainties in the evaluation of different LU patterns and management assumptions and how this relates to crop/food production and natural carbon sinks/stocks. We use simulations from 7 global gridded crop models (GGCMs, Rosenzweig et al., 2014), 11 global hydro-logical models (Schewe et al., 2014), and 7 global terrestrial bio-geochemical models (Friend et al., 2014; Warszawski et al., 2013) generated within ISI-MIP to address the following questions:
1. How large is the inter-impact-model spread in pro-jected global crop production under different levels of global warming assuming present-day LU patterns and present-day management (see Table S1 in the Supple-ment)?
2. How can multi-water model projections be used to esti-mate the potential intensification of food production due to additional irrigation and how does the induced uncer-tainty in runoff projections compare to the unceruncer-tainty in crop yield projections?
3. How large is the spread in projected losses in natural carbon sinks and stocks of an illustrative future LU pat-tern that increases the probability of meeting future food demand?
3 Data and methods
3.1 Input data for impact model simulations
All impact projections used within this study are forced by the same climate input data (Warszawski et al., 2014). For
ISI-MIP, daily climate data from five general circulation models (GCMs) from the Coupled Model Intercomparison Project Phase 5 (CMIP5) archive (Taylor et al., 2012) were bias-corrected to match historical reference levels (Hempel et al., 2013). Here, we only use data from Hadley Global En-vironment Model 2 – Earth System (HadGEM2-ES), the In-stitut Pierre Simon Laplace model IPSL-CM5A-LR, and the Model for Interdisciplinary Research on Climate Earth Sys-tem Model (MIROC-ESM-CHEM) (see Table S6 in the Sup-plement) since these models reach a global mean warming of
at least 4◦C with regard to 1980–2010 levels under RCP8.5
– the highest of the four RCPs (Moss et al., 2010). All model
runs accounting for changes in CO2concentrations are based
on the relevant CO2concentration input for the given RCP.
3.2 LU patterns and food demand
As a present-day reference for agricultural LU patterns we apply the MIRCA2000 irrigated and rainfed crop areas (Port-mann et al., 2010). They describe harvested areas as a frac-tion of each grid cell. The patterns are considered to be rep-resentative for 1998–2002. Simulated rainfed and fully irri-gated productions within each grid cell were multiplied by the associated fractions of harvested areas and added up to calculate the simulated production per grid cell. Historical LU patterns are subject to large uncertainties (Verburg et al., 2011). Alternative maps are provided by, for example, Fritz et al. (2015). Here, we use the MIRCA2000 patterns as they make our estimated changes in production consistent to the spatial maps of relative yield changes provided by Rosen-zweig et al. (2014). In addition, the total agricultural area de-rived from MIRCA2000 is consistent with the area of natural vegetation as described by the MAgPIE model and used as a reference for the analysis of the biome model projections of changes in carbon fluxes and stocks (see last paragraph of this section).
As an illustrative future LU pattern, we use a projection of the agro-economic LU model MAgPIE (Lotze-Campen et al., 2008; Schmitz et al., 2012) generated within the ISI-MIP-AgMIP (Agricultural Model Intercomparison and Im-provement Project) collaboration and published in Nelson et al. (2014). The model computes LU patterns necessary to fulfil future food demand (Bodirsky et al., 2015). Here, food demand is calculated from future projections of pop-ulation and economic development (gross domestic prod-uct, GDP) under the “middle of the road” Shared Socioe-conomic Pathway (SSP2, https://secure.iiasa.ac.at/web-apps/ ene/SspDb) (Kriegler et al., 2010). The associated LU pro-jections are based on the historical and RCP8.5 simulations by HadGEM2-ES and associated yields generated by the LPJmL model (Lund-Potsdam-Jena managed Land, see Ta-ble S1 of the Supplement) (Nelson et al., 2013). The pattern
is based on fixed CO2-concentration (370 ppm) crop model
simulations. MAgPIE accounts for technological change leading to increasing crop yields (applied growth rates are
listed in Table S4 in the Supplement), while our analysis is based on crop model simulations accounting for increasing
levels of atmospheric CO2concentrations but no
technologi-cal change. In the context of our study, the pattern is consid-ered only a plausible example of a potential future evolution of land use. However, it does not assure consistency between food demand and production for different crop yield tions. To achieve consistency, individual crop model projec-tions would have to be translated into individual LU patterns as described in Sect. 2 and Fig. 2.
The present-day reference for the total area of natural veg-etation is taken from the 1995 MAgPIE pattern. The MAg-PIE model is calibrated with respect to the spatial pattern of total cropland to be in line with other data sources, like the MIRCA2000 data set (Schmitz et al., 2014). That means that the area of natural vegetation assumed here is not in conflict with the total area of harvested land described by MIRCA2000 and used here to calculate crop global produc-tion based on the crop model simulaproduc-tions. However, the pat-terns of individual crops may differ, due to the underlying land use optimization approach. Future projections of the to-tal area of natural vegetation are taken from the MAgPIE simulation described above.
3.3 Impact model simulations
3.3.1 Crop models
Our considered crop model ensemble (see Table 1) represents the majority of GGCMs currently available to the scientific community (run in partnership with the AgMIP; Rosenzweig et al., 2012). In their complementarity, the models represent a broad range of crop growth mechanisms and assumptions (see Table 1 and S1 in the Supplement for more details). While the site-based models were developed to simulate crop growth at the field scale, accounting for interactions among crop, soil, atmosphere, and management, the agro-ecosystem models are global vegetation models originally designed to simulate global carbon, nitrogen, water, and energy fluxes. The site-based models are often calibrated by agronomic field experiments, while the agro-ecosystem models are usu-ally not calibrated (LPJ-GUESS), or only on a much coarser scale such as national yields (LPJmL). The agro-ecological zone model (Integrated Model to Assess the Global Envi-ronment – IMAGE) was developed to assess agricultural re-sources and potential at regional and global scales.
The crop modelling teams provided “pure crop” runs, as-suming that the considered crop is grown everywhere, ir-respective of current LU patterns but only accounting for restriction due to soil characteristics. For each crop annual yield data are provided assuming rainfed conditions and full irrigation not accounting for potential restrictions in wa-ter availability. In addition modelling groups provided the amount of water necessary to reach full irrigation except for PEGASUS (Predicting Ecosystem Goods And Services
Us-Table 1.Short characterisation of the applied global gridded crop models. More details are provided in Table S1 in the Supplement.
Global gridded Model type Reference level crop model
EPIC site-based crop model potential yields GEPIC site-based crop model present-day yields IMAGE agro-ecological zone models present-day yields LPJ-GUESS agro-ecosystem model potential yields LPJmL agro-ecosystem model present-day yields pDSSAT site-based crop model present-day yields PEGASUS agro-ecosystem model present-day yields
Table 2.Short characterisation of the applied water models. More details are provided in Sect. 3.5 in the Supplement.
Global water Energy Dynamic model balance vegetation
changes
DBH Yes No
H08 Yes No
JULES Yes Yes LPJmL No Yes Mac-PDM.09 No No MATSIRO Yes No MPI-HM No No PCR-GLOBWB No No VIC Only for snow No WaterGAP No No
WBM No No
ing Scenarios) and IMAGE. This design of the simulations makes the projections highly flexible with regard to LU pat-terns that can be applied in post-processing as described in Sect. 3.2.
The quantity projected differs from model to model, rang-ing from yields constrained by current management deficien-cies to potential yields under effectively unconstrained nutri-ent supply (Table 1 and Table S1 in the Supplemnutri-ent). There-fore, we only compare relative changes in global production to relative changes in demand. Since simulated yield changes may strongly depend on, for example, the assumed level of fertilizer input in the reference period, we consider this as-pect as a critical restriction. In this way, the analysis pre-sented here is an illustration of how the proposed decision framework could be filled, rather than a quantitative assess-ment.
The default configuration of most models includes an ad-justment of the sowing dates in response to climate change, while total heat units to reach maturity are held constant, ex-cept for in PEGASUS and LPJ-GUESS. Three models in-clude an automatic adjustment of cultivars.
Table 3.Short characterisation of the applied biome models. More details are provided in Sect. 6 in the Supplement. Global vegetation model Represented cycles Dynamic vegetation changes LPJmL water and carbon yes
JULES carbon yes
JeDI water and carbon cycle yes SDGVM water and carbon, below ground nitrogen no VISIT water and carbon no Hybrid carbon and nitrogen yes
ORCHIDEE carbon not in the configuration used for ISI-MIP
0
50
100
Relati
ve Change in Global Production [%]
1 2 3 4
0
50
100
Level of Global Warming [°C]
1 2 3 4 Wheat Maize Rice Soy 2020 2050 2100 2020 2050 2100 2020 2050 2100 EPIC GEPIC IMAGE LPJ−GUESS LPJmL pDSSAT PEGASUS 0 50 100 150 2020 2050 2100
Figure 3.Adaptive pressure on global crop production and effects of irrigation and LU adaptation. Relative changes in crop global production (wheat, maize, rice, soy) at different levels of global warming with respect to the reference data (global production under unlimited irrigation on currently irrigated land, averaged over the 1980–2010 reference period). Horizontal red lines indicate the relative change in demand projections for the years 2020, 2050, and 2100 due to changes in population and GDP under SSP2. First column of each global mean warming block: change in global production under fixed current LU patterns assuming unlimited irrigation restricted to present-day irrigated land. Second block: relative change (with regard to reference data) in global production assuming potential expansion of irrigated land accounting for irrigation water constraints as projected by 11 water models (for details see the Supplement). Third column: based on the same water distribution scheme as column 2 but applied to the 2085 LU pattern provided by MAgPIE. EPIC is excluded from the LU experiment as simulations are restricted to present-day agricultural land. Colour coding indicates the GGCM. Horizontal bars represent results for individual climate models, RCPs, GGCMs, and hydrological models (for column 2 and 3). Coloured dots represent the GGCM-specific means over all GCMs and RCPs (and hydrological models). Black boxes mark the inner 90 % range of all individual model runs. The central black bar of each box represents the median over all individual results.
3.3.2 Water models
The considered water model ensemble comprises four land surface models accounting for water and energy balances, six global hydrological models only accounting for water balances and one model ensuring energy balance for snow generation (see Table 2 and Table S3 in the Supplement). Following the ISI-MIP protocol, all modelling teams were asked to generate naturalized simulations excluding human
influences. Here we aggregate the associated runoff pro-jections over 1 year and so-called food production units (FPU, Kummu et al., 2010) representing intersections be-tween larger river basins and countries (see Fig. S7 in the Supplement for the definition of the FPUs). In this way, we create an approximation of the water available for irrigation (see Sect. 3 in the Supplement for a detailed description of
the calculation of the available crop-specific irrigation wa-ter).
For illustrative purposes, we assume that irrigation water (plus a minor component of water for industrial and house-hold uses) is limited to 40 % (Gerten et al., 2011) of the an-nual runoff integrated over the area of one FPU. In addition, we assume a project efficiency of 60 %, where 60 % of the ir-rigation water is ultimately available for the plant. The avail-able water is distributed according to where it leads to the highest yield increases per applied amount of water, as cal-culated annually. The information is available at each grid cell from the “pure rainfed” and “full irrigation” simulations provided by the crop models and the information about the irrigation water applied to reach full irrigation. To generate probabilistic projection, each crop model projection is com-bined with each water model projection (see the Supplement for more details). Our approach only accounts for renewable surface and groundwater. Model simulations account for the
CO2fertilization effect on vegetation if this effect is
imple-mented in the models.
3.3.3 Biome models
Similar to the crop model, the biome modelers provided “pure natural vegetation” runs without accounting for cur-rent or future LU patterns but assuming that the complete land area is covered by natural vegetation wherever possi-ble given soil characteristics. In this way, potential LU pat-terns can be applied and tested in post-processing. The main characteristics of the considered models are listed in Table 3 (and Table S5 in the Supplement for some more detail). Here, we use the ecosystem–atmosphere carbon flux and vegetation carbon as two of the main output variables provided by the models. Both are aggregated over the area of natural vege-tation as described by the MAgPIE projection introduced in Sect. 3.2. To quantify the pure LU-induced changes the an-nual carbon stocks and fluxes under fixed 1995 LU are com-pared to the associated values assuming an expansion of agri-cultural land as described by MAgPIE.
Biophysical simulations are based on HadGEM2-ES and
RCP8.5. All simulations account for the CO2fertilization
ef-fect. Results for the simulations where CO2is held constant
at year 2000 levels are shown in the Supplement. Our ap-proach does not account for the carbon released from soil after LU changes (Smith, 2008). While agricultural land can be considered as carbon neutral to the first order (cultivated plants are harvested and consumed), the conversion process emits carbon to the atmosphere as soil carbon stocks typi-cally degrade after deforestation (Müller et al., 2007).
3.4 Partitioning of the uncertainty budget associated with crop production changes
To separate the climate-model-induced uncertainty from the impact model uncertainty, the GGCM-specific spread of
the relative crop production changes at different levels of global warming is estimated by the standard deviation of the GGCM-specific mean values. These are calculated over all climate-model-specific (and RCP-specific) individual values (e.g. coloured dots in Fig. 3), or all water-model-specific in-dividual values, in the case of the production under maxi-mum irrigation. The climate-model-induced or water-model-induced spread is estimated as the standard deviation over the individual deviation from these GGCM means.
4 Results and Discussion
4.1 Adaptive pressure on future food production
GGCMs project a wide range of relative changes in global wheat, maize, rice, and soy production at different levels of
global warming and associated CO2concentrations (first
col-umn of each global mean warming box in Fig. 3). At 4◦C,
the GGCM spread is more than a factor of 5 larger than the spread due to the different climate models (see Table 4, esti-mated as described in Sect. 3). This is partly due to the bias correction of the climate projections, which includes a cor-rection of the historical mean temperature to a common ob-servational data set (Hempel et al., 2013), and may depend on the selection of the three GCMs. However, the results suggest that the inter-crop-model spread will also be a major compo-nent of the uncertainty distribution associated with the area of cropland required to meet future food demand.
Despite considerable uncertainty, it is evident that even if global production increases arise from optimistic
assump-tions about CO2fertilization, this effect alone is unlikely to
balance demand increases driven by population growth and economic development (assuming that the observed relation-ship between per capita consumption patterns and incomes holds in the future and ignoring demand-side measures; Fo-ley et al., 2011; Parfitt et al., 2010). All GGCMs show a quasi-linear dependence on global mean temperature across the three different climate models, considered scenarios, and range of global mean temperature changes (Figs. S5–S6 in
the Supplement). Values range from −3 to +7 %◦C−1 for
wheat, −8 to +6 %◦C−1for maize, −4 to +19 %◦C−1for
rice, and −8 to +12 %◦C−1for soy (Table S2 in the
Supple-ment, see Rosenzweig et al., 2014, for an update of the IPCC-AR4 Table 5.2; Easterling and et al., 2007). It is not neces-sarily clear that crop-production changes can be expressed in a path-independent way as a function of global mean
tem-perature change. In particular, CO2 concentrations are
ex-pected to modify the relationship with global mean tempera-ture. However, for the seven GGCMs and the RCP scenarios considered here, the path dependence is weak (Figs. S1–S4 in the Supplement). This suggests that the red PDFs shown in Fig. 1, or the associated sample of LU patterns, could also
be determined for specific global warming (and CO2) levels,
Table 4.Comparison of the crop-model-induced spread in global crop production to the climate-model-induced spread at different levels of global warming in comparison to the 1980–2010 reference level. Global production is calculated based on present-day LU and irrigation patterns not accounting for constraints on water availability (MIRCA2000; Portmann et al., 2010).
1◦C 2◦C 3◦C 4◦C wheat
crop-model-induced spread of global production 3 % 6 % 10 % 13 % climate-model-induced spread of global production 2 % 2 % 2 % 2 %
maize
crop-model-induced spread of global production 4 % 9 % 14 % 18 % climate-model-induced spread of global production 2 % 2 % 2 % 2 %
rice
crop-model-induced spread of global production 7 % 16 % 26 % 33 % climate-model-induced spread of global production 2 % 1 % 2 % 2 %
soy
crop-model-induced spread of global production 8 % 14 % 22 % 28 % climate-model-induced spread of global production 4 % 4 % 3 % 4 %
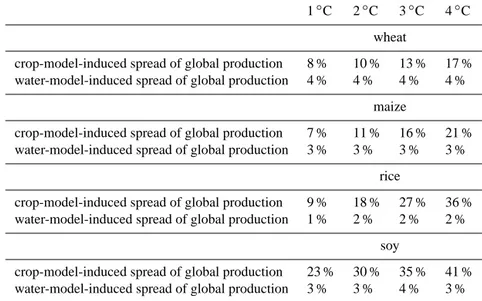
Table 5.Comparison of the crop-model-induced spread in global crop production to the water-model-induced spread at different levels of global warming in comparison to the 1980–2010 reference level. Global production is calculated based on present day LU (Portmann et al., 2010) and extended irrigation patterns according to water availability described by the water models (Sect. 3.3 and Sect. 3 in the Supplement).
1◦C 2◦C 3◦C 4◦C wheat
crop-model-induced spread of global production 8 % 10 % 13 % 17 % water-model-induced spread of global production 4 % 4 % 4 % 4 %
maize
crop-model-induced spread of global production 7 % 11 % 16 % 21 % water-model-induced spread of global production 3 % 3 % 3 % 3 %
rice
crop-model-induced spread of global production 9 % 18 % 27 % 36 % water-model-induced spread of global production 1 % 2 % 2 % 2 %
soy
crop-model-induced spread of global production 23 % 30 % 35 % 41 % water-model-induced spread of global production 3 % 3 % 4 % 3 %
The disagreement in the sign of the change in crop pro-duction in Fig. 3 arises predominantly from differences in
the strength of the CO2fertilization effect. Projections based
on fixed CO2levels show a smaller spread and a general
de-crease in global production with increasing global warming (Table S2 and Fig. S6 in the Supplement). Given the ongoing
debate about the efficiency of CO2fertilization, in particular
under field conditions (Leakey et al., 2009; Long et al., 2006; Tubiello et al., 2007), and the fact that most models do not account for nutrient constraints of this effect, projections are
likely to be optimistic about the growth-promoting effects of
increased atmospheric CO2concentrations.
4.2 Irrigation potential
Using different means of intensifying crop production on ex-isting cropland, the red uncertainty distributions in Fig. 1 can be shifted to the left. As an example, we show how multi-water-model simulations could be combined with crop model simulations forced by the same climate input to estimate the uncertainties in the potential production increase due to
ex-pansion of irrigated areas, using only present-day agricultural land. The effect is constrained by (1) biophysical limits of yield response to irrigation and (2) water availability.
While potential expansion of irrigation (or reduction, in the case of insufficient water availability for full irrigation of currently irrigated areas) could compensate for the climate-induced adaptive pressure projected by some GGCMs (sec-ond column of each global mean warming level in Fig. 3), the feasible increase in global production is insufficient to balance the relative increase in demand by the end of the century. In the case of rice, which is to a large extent already irrigated (Fig. S3 in the Supplement), the imposed water lim-itation reduces production in comparison to full irrigation on currently irrigated areas for some of the GGCMs (see Elliott et al. (2014) for a more detailed discussion of limits of irri-gation on currently irrigated land). In terms of Fig. 1, addi-tional irrigation shifts the red uncertainty distributions to the left. However, even with this shift, it remains unlikely that the currently cultivated land will be sufficient to fulfil future food demand.
The spread of projections of global crop production un-der additional irrigation is dominated by the differences be-tween GGCMs rather than the projections of available water (see Table 5) (the partitioning of uncertainty is described in Sect. 3.4). Based on the HadGEM2-ES and RCP8.5 climate projections, the GGCM-induced spread (five models provide
the necessary information) at 4◦C is at least a factor of 4
larger than the spread induced by the hydrological models (see Table 2).
The production levels shown in Fig. 3 do not reveal whether the increase is mainly biophysically limited by po-tential yields under full irrigation, or by water availability. Further analysis (see Supplement and Figs. S8 and S9) shows that production under the highly optimistic assumptions re-garding water distribution is relatively close to production under unlimited irrigation on present-day crop areas with the exception of wheat.
4.3 Effect of LU changes on global crop production
Intensification options are certainly not exhausted by addi-tional irrigation. For example, other possibilities include im-proved fertilizer application, switching to higher yielding va-rieties, or implementing systems of multiple cropping per year. Historically, most of the long-term increase in crop de-mand was met by a variety of intensification strategies (God-fray et al., 2010b; Tilman et al., 2011). However, the expan-sion of arable land may become more important in light of further increasing demand and possibly saturating increases in crop yields (Alston et al., 2009; Lin and Huybers, 2012). A recent study (Ray et al., 2013) suggests that observed in-creases in yields will not be sufficient to meet future demand. To illustrate the potential to increase yields via LU change, we apply a LU pattern generated by the agro-economic LU model MAgPIE for the year 2085 (see Sect. 3) in
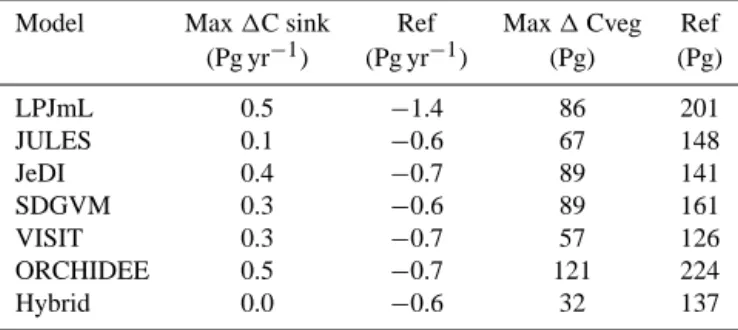
combi-Table 6.Maximal loss of carbon sinks and the vegetation carbon stock as estimated for the illustrative LU change scenario (based on coloured lines in panel (a) and (b) of Fig. 4). The maximum of the transient changes (column 2 and 4) is compared to mean values of the C fluxes and the C stock averaged over the reference period 1980–2010 (column 3 and 5).
Model Max 1C sink Ref Max 1 Cveg Ref
(Pg yr−1) (Pg yr−1) (Pg) (Pg) LPJmL 0.5 −1.4 86 201 JULES 0.1 −0.6 67 148 JeDI 0.4 −0.7 89 141 SDGVM 0.3 −0.6 89 161 VISIT 0.3 −0.7 57 126 ORCHIDEE 0.5 −0.7 121 224 Hybrid 0.0 −0.6 32 137
nation with the water distribution scheme discussed above (see third column of each global mean warming bin in Fig. 3). There is a very large spread in the relative changes in crop production with regard to 1980–2010 reference val-ues, reaching standard deviations of 31 % for wheat, 84 % for
maize, 80 % for rice, and 79 % for soy at 4◦C. In one case
there is even a reduction in production. This may be due to the fact that MAgPIE’s optimization scheme results in highly concentrated agricultural patterns by 2085, exaggerating re-gional features of the GGCM simulations (Figs. S10–S13 in the Supplement) and means at the same time that optimal LU pattern derived from individual crop models may strongly differ. In terms of Fig. 1, these results indicate a very wide uncertainty distribution associated with the area required for food production.
The relative increase in production by some crop models exceeds the projected demand increase. However, in spite of the strong expansion of cultivated land, with particularly high losses in the Amazon rainforest (see Fig. S15 in the Supple-ment), the lower ends of the samples still do not balance the projected demand increase in 2050 (except for wheat).
4.4 Effect of LU changes on natural carbon sinks and stocks
The increase in production by LU changes comes at the cost of natural vegetation. The considered illustrative reduction of the area of natural vegetation reaches 480 Mha in 2085 compared to 1995 levels. This corresponds roughly to the land area spared due to obtained yield increases in wheat and maize during the last 50 years (Huber et al., 2014). For all but one vegetation model (Hybrid) the reduction of the area of natural vegetation (Fig. S15 in the Supplement) means a loss of carbon sinks. There is a wide spread in losses, in some cases reaching 50 % compared to the reference period (see Table 6). For the Hybrid model, natural vegetation actu-ally turns into a carbon source (Friend et al., 2014) by mid-century (Fig. S16 in the Supplement), which means that a
2000 2020 2040 2060 2080 −1.0 −0.5 0.0 0.5 1.0 Time Dif
ference in Ecosystem Atmosphere
C Flu xes [Pg/yr] 2000 2020 2040 2060 2080 2100 −120 −100 −80 −60 −40 −20 0 Time Dif ference in Vegetation C Stock [Pg] 1°C 2°C 3°C 4°C 1°C 2°C 3°C 4°C a b
Figure 4. (a) Loss of carbon sinks (ecosystem–atmosphere C
flux) due to reduction of natural vegetation and (b) associated changes in the vegetation C stock (Cveg). Coloured lines repre-sent 20-year running means of the differences of these variables between the LU change scenario and the reference scenario (fixed 1995 area of natural vegetation). Positive values indicate higher ecosystem–atmosphere C fluxes and a reduction in Cveg under LU change. Colour coding indicates the different bio-geochemical models. Solid (dashed) lines represent simulations based on dy-namic (static) vegetation patterns. Results are based on the historical and RCP8.5 simulations by HadGEM2-ES. Dashed vertical lines: years where the global mean temperature change with respect to 1980–2010 reaches 1, 2, 3, and 4◦C.
reduction in natural vegetation leads to an increase in the global carbon sink. Overall the models show a spread in the
reduction in carbon sinks from 0 to 0.5 Pg yr−1(see Table 6
and Fig. 4a). The direct reduction of the vegetation carbon stock reaches a multi-model median of about 85 Pg (about
8.5 years of current CO2emissions) by the end of the
cen-tury compared to a simulated increase in vegetation carbon of about 100 to 400 Pg in pure natural vegetation runs under the same climate change scenario (Friend et al., 2013). The multi-model spread of maximum LU-change-induced reduc-tions reaches 32 to 121 Pg (see Table 6 and Fig. 4b).
5 Conclusions
The competition between food security for a growing popu-lation and the protection of ecosystems and climate poses a dilemma. This dilemma is fundamentally cross-sectoral, and its analysis requires an unprecedented cross-sectoral, multi-impact model analysis of the adaptive pressures on global food production and possible response strategies. So far, un-certainties in biophysical impact projections have not been included in integrative studies addressing the above dilemma because of a lack of cross-sectorally consistent multi-impact model projections. Here we propose a decision framework that allows for the addition of the multi-impact-model di-mension to the available analyses of climate change impacts and response options. The concept allows for an evaluation of different (agricultural) management decisions in terms of the probability of meeting a pre-determined amount of car-bon stored in natural vegetation and bio-energy production under the constraint of a pre-determined food demand that
have to be fulfilled. The probability is determined by the un-certainty of the biophysical responses to the considered man-agement decision, climate change, and increasing levels of
atmospheric CO2 concentrations. The proposed framework
allows for an evaluation of selected management option but does not include an optimization to find a best solution in view of conflicting interests as provided by usual integrated assessment studies. In this regard it is similar to the integrated framework to assess climate, LU, energy, and water strategies (CLEWS) (Howells et al., 2013), while the approach consid-ered here does not include an economic assessment.
To date, a quantification of this probability has been inhib-ited by the lack of cross-sectorally consistent multi-impact-model projections. Here, simulations generated within ISI-MIP were used to illustrate the first steps in addressing the gap. The spread across different impact models is shown to be a major component of the uncertainty of climate impact projections. In the case of multiple interests and conflict-ing response measures, this uncertainty represents a dilemma since ensuring one target with high certainty means putting another one at particularly high risk.
For a full quantification of the probability distributions il-lustrated in Fig. 1, multiple crop model simulations have to be translated into a PDF of the “required food production area” given certain demands accounting for changing trade patterns, for example (Nelson et al., 2014). This translation has already started within the ISI-MIP-AgMIP collaboration and will enable the generation of a probability distribution of the required food production area. However, current es-timates (Nelson et al., 2014) are based on crop model runs
that do not account for the CO2-fertilization effect and only
a limited number of models provide explicit LU patterns in addition to the aggregated area. In addition, not all models are adjusted to reproduce present-day observed yields, ren-dering the analysis presented here illustrative rather than a robust quantitative assessment.
To estimate the associated probability of climate protec-tion failure, carbon emissions due to the loss of natural carbon sinks and stocks, particularly including effects of soil degradation, must be quantified. Therefore, the set of demand-fulfilling LU patterns has to be provided as input for multi-model biome simulations. ISI-MIP is designed to facil-itate this kind of cross-sectoral integration, which can then be employed to fulfil the urgent demand for a comprehensive as-sessment of the impacts of climate change, and our options to respond to these impacts and socioeconomic developments, along with the corresponding trade-offs.
Our illustration of the uncertainty dilemma is by no means complete. In addition to the irrigation scheme considered here, a more comprehensive consideration of management options for increasing crop yields on a given land area is re-quired. To this end, the representation of management within the crop model simulations needs to be harmonized to quan-tify the effect of different management assumptions on crop model projections. For example, similar to the rainfed vs.
full irrigation scenarios, low fertilizer vs. high fertilizer in-put scenarios could be considered allowing for a scaling of the yields according to the assumed fertilizer input. However, not all crop models explicitly account for fertilizer input.
In the longer term, initiatives such as ISI-MIP will con-tribute to filling the remaining gaps and finally allow for a probabilistic assessment of cross-sectoral interactions be-tween climate change impacts. For example, the current sec-ond round of ISI-MIP will include biome and water model simulations accounting for LU changes generated based on different crop model projections (see ISI-MIP2 protocol, www.isi-mip.org).
The Supplement related to this article is available online at doi:10.5194/esd-6-447-2015-supplement.
Acknowledgements. We acknowledge the World Climate Re-search Programme’s Working Group on Coupled Modelling, which is responsible for CMIP, and thank the climate modelling groups (listed in Table S6 in the Supplement) for producing and making available their model output. For CMIP, the U.S. Department of Energy’s Program for Climate Model Diagnosis and Intercom-parison provides coordinating support and led development of software infrastructure in partnership with the Global Organization for Earth System Science Portals. This work has been conducted under the framework of ISI-MIP and in cooperation with AgMIP. The ISI-MIP Fast Track project was funded by the German Federal Ministry of Education and Research (BMBF) with project funding reference no. 01LS1201A. Responsibility for the content of this publication lies with the author. The research leading to these results has received funding from the European Commission’s Seventh Framework Programme (FP7 2007–2013) under grant agreement nos. 238366 and 603864-2 (HELIX) and was supported by the Federal Ministry for the Environment, Nature Conservation and Nuclear Safety (11 II 093 Global A SIDS and LDCs). Pete Falloon was supported by the Joint DECC/Defra Met Office Hadley Centre Climate Programme (GA01101). The research leading to these results has received funding from the European Commission’s Seventh Framework Programme (FP7 2007–2013) under grant agreement no. 266992. Y. Masaki and K. Nishina were supported by the Environment Research and Technology Development Fund (S-10) of the Ministry of the Environment, Japan.
Edited by: M. Floerke
References
Alston, J. M., Beddow, J. M., and Pardey, P. G.: Agricultural re-search, productivity, and food prices in the long run, Science, 325, 1209–1210, 2009.
Bodirsky, B. L., Rolinski, S., Biewald, A., Weindl, I., Popp, A., and Lotze-Campen, H.: Global food demand projections/scenarios for the 21st century, in review, 2015.
Bondeau, A., Smith, P. C., Zaehle, S., Schaphoff, S., Lucht, W., Cramer, W., Gerten, D., Lotze-Campen, H., Müller, C., Reichstein, M., and Smith, B.: Modelling the role of agri-culture for the 20th century global terrestrial carbon bal-ance, Global Chang. Biol., 13, 679–706, doi:10.1111/j.1365-2486.2006.01305.x, 2007.
Conference of the Parties: Cancun agreement, available at: http: //unfccc.int/resource/docs/2010/cop16/eng/07a01.pdf#page=2 (access date: 17 June 2015), 2010.
Easterling, W. E., Aggarwal, P. K., Batima, P., Brander, K. M., Erda, L., Howden, S. M., Kirilenko, A., Morton, J., Soussana, J.-F., Schmidhuber ,J., and Tubiello, F. N.: Climate change 2007: Im-pacts, Adaptation and Vulnerability, Chaper 5: Food, Fibre and Forest Products, Contribution of Working Group II to the Fourth Assessment Report of the Intergovernmental Panel on Climate Change, Cambridge, UK, 2007.
Eitelberg, D. A., van Vliet, J., and Verburg, P. H.: A review of global potentially available cropland estimates and their consequences for model-based assessments, Global Chang. Biol., 21, 1236– 1248, doi:10.1111/gcb.12733, 2015.
Elliott, J., Deryng, D., Müller, C., Frieler, K., Konzmann, M., Gerten, D., Glotter, M., Flörke, M., Wada, Y., Eisner, S., Fol-berth, C., Foster, I., Gosling, S. N., Haddeland, I., Khabarov, N., Ludwig, F., Masaki, Y., Olin, S., Rosenzweig, C., Ruane, A., Satoh, Y., Schmid, E., Stacke, T., Tang, Q., and Wisser, D.: Con-straints and potentials of future irrigation water availability on agricultural production under climate change, PNAS, 11, 3239– 3244, doi:10.1073/pnas.1222474110, 2014.
Falloon, P. D. and Betts, R. A.: Climate impacts on European agri-culture and water management in the context of adaptation and mitigation – the importance of an integrated approach, Sci. Total Environ., 408, 5667–5687, 2010.
Field, C. B., Barros, V., Stocker, T. F., Qin, D., Dokken, D. J., Ebi, K. L., Mastrandrea, M. D., Mach, K. J., Plattner, G.-K., Allen, S. K., Tignor, M., and Midgley, P. M. (Eds.): IPCC 2012: Manag-ing the risks of extreme events and disasters to advance climate change adaptation. A Special Report of Working Groups I and II of the Intergovernment Panel on Climate Change, Cambridge, UK, New York, NY, USA, 2012.
Foley, J. a, Ramankutty, N., Brauman, K. a, Cassidy, E. S., Gerber, J. S., Johnston, M., Mueller, N. D., O’Connell, C., Ray, D. K., West, P. C., Balzer, C., Bennett, E. M., Carpenter, S. R., Hill, J., Monfreda, C., Polasky, S., Rockström, J., Sheehan, J., Siebert, S., Tilman, D., and Zaks, D. P. M.: Solutions for a cultivated planet, Nature, 478, 337–342, doi:10.1038/nature10452, 2011. Friend, A. D., Richard, B., Patricia, C., Philippe, C., Douglas B.,
C., Rutger, D., Pete, F., Akihiko, I., Ron, K., Rozenn M., K., Axel, K., Mark R., L., Wolfgang, L., Nishina, K., Sebastian, O., Ryan, P., Peylin, P., Tim T., R., Sibyll, S., Vuichard, N., Lila, W., Wiltshire, A., and F. Ian, W.: Carbon residence time dominates uncertainty in terrestrial vegetation responses to fu-ture climate and atmospheric CO2, PNAS, 111, 3280–3285,
doi:10.1073/pnas.1222477110, 2014.
Fritz, S., See, L., McCallum, I., You, L., Bun, A., Moltchanova, E., Duerauer, M., Albrecht, F., Schill, C., Perger, C., Havlik, P., Mosnier, A., Thornton, P., Wood-Sichra, U., Herrero, M., Becker-Reshef, I., Justice, C., Hansen, M., Gong, P., Abdel Aziz, S., Cipriani, A., Cumani, R., Cecchi, G., Conchedda, G., Fer-reira, S., Gomez, A., Haffani, M., Kayitakire, F., Malanding, J.,
Mueller, R., Newby, T., Nonguierma, A., Olusegun, A., Ortner, S., Rajak, D. R., Rocha, J., Schepaschenko, D., Schepaschenko, M., Terekhov, A., Tiangwa, A., Vancutsem, C., Vintrou, E., Wen-bin, W., van der Velde, M., Dunwoody, A., Kraxner, F. and Obersteiner, M.: Mapping global cropland and field size, Global Change Biol., 21, 1980–1992, doi:10.1111/gcb.12838, 2015. Gerten, D., Heinke, J., Hoff, H., Biemans, H., Fader, M., and Waha,
K.: Global Water Availability and Requirements for Future Food Production, J. Hydrometeorol., 12, 885–899, 2011.
Godfray, H. C. J., Beddington, J. R., Crute, I. R., Haddad, L., Lawrence, D., Muir, J. F., Pretty, J., Robinson, S., Thomas, S. M., and Toulmin, C.: Food security: the challenge of feeding 9 billion people, Science, 327, 812–818, doi:10.1126/science.1185383, 2010a.
Godfray, H. C. J., Crute, I. R., Haddad, L., Lawrence, D., Muir, J. F., Nisbett, N., Pretty, J., Robinson, S., Toulmin, C., and Whiteley, R.: The future of the global food system, Philos. Trans. R. Soc. Lond. B. Biol. Sci., 365, 2769–2777, doi:10.1098/rstb.2010.0180, 2010b.
Haddeland, I., Clark, D. B., Franssen, W., Ludwig, F., Voß, F., Arnell, N. W., Bertrand, N., Best, M., Folwell, S., Gerten, D., Gomes, S., Gosling, S. N., Hagemann, S., Hanasaki, N., Harding, R., Heinke, J., Kabat, P., Koirala, S., Oki, T., Polcher, J., Stacke, T., Viterbo, P., Weedon, G. P., and Yeh, P.: Multimodel Estimate of the Global Terrestrial Water Balance: Setup and First Results, J. Hydrometeorol., 12, 869–884, doi:10.1175/2011JHM1324.1, 2011.
Hallegatte, S., Green, C., Nicholls, R. J., and Corfee-Morlot, J.: Fu-ture flood losses in major coastal cities, Nat. Clim. Chang., 3, 802–806, doi:10.1038/nclimate1979, 2013.
Havlik, P., Schneider, U. A., Schmid, E., Böttcher, H., Fritz, S., Skalsk\‘y, R., Aoki, K., Cara, S. De, Kindermann, G., Kraxner, F. and others: Global land-use implications of first and second generation biofuel targets, Energ. Policy, 39, 5690–5702, 2011. Hempel, S., Frieler, K., Warszawski, L., Schewe, J., and Piontek, F.:
A trend-preserving bias correction – the ISI-MIP approach, Earth Syst. Dynam., 4, 219–236, doi:10.5194/esd-4-219-2013, 2013. Howells, M., Hermann, S., Welsch, M., Bazilian, M., Segerström,
R., Alfstad, T., Gielen, D., Rogner, H., Fischer, G., van Velthuizen, H., Wiberg, D., Young, C., Roehrl, R. A., Mueller, A., Steduto, P., and Ramma, I.: Integrated analysis of climate change, land-use, energy and water strategies, Nat. Clim. Chang., 3, 621–626, doi:10.1038/nclimate1789, 2013.
Huber, V., Neher, I., Bodirsky, B. L., Höfner, K., and Schellnhuber, H. J.: Will the world run out of land? A Kaya-type decomposition to study past trends of cropland expansion, Environ. Res. Lett., 9, 024011, doi:10.1088/1748-9326/9/2/024011, 2014.
IPCC: Climate Change 2014: Impacts, Adaptation, and Vulnerabil-ity. Part B: Regional Aspects. Contribution of Working Group II to the Fifth Assessment Report of the Intergovernmental Panel on Climate Change, edited by: Barros, V. R., Field, C. B., Dokken, D. J., Mastrandrea, M. D., Mach, K. J., Bilir, T. E., Chatter-jee, M., Ebi, K. L., Estrada, Y. O., Genova, R. C., Girma, B., Kissel, E. S., Levy, A. N., MacCracken, S., Mastrandrea, P. R., and White, L. L., Cambridge University Press, Cambridge, UK and New York, NY, USA, 2014a.
IPCC: Climate Change 2104: Impacts, Adaptation and Vulnerabil-ity. Part A: Global and Sectoral Aspects. Contribution of Work-ing Group II to the Fifth Assessment Report of the
Intergovern-mental Panel on Climate Change, edited by: Field, C. B., Barros, V. R., Dokken, D. J., Mach, K. J., Mastrandrea, M. D., Bilir, T. E., Chatterjee, M., Ebi, K. L., Estrada, Y. O., Genova, R. C., Girma, B., Kissel, E. S.,x Levy, E. S., MacCracken, S., Mastrandrea, P. R., and White, L. L., Cambridge University Press, Cambridge, UK and New York, NY, USA, 2014b.
Kriegler, E., O’Neill, B. C., Hallegatte, S., Kram, T., Lempert, R., Moss, R. H., and Wilbanks, T. J.: Socio-economic Scenario De-velopment for Climate Change Analysis, CIRED Work. Pap., DT/WP No 2, 2010.
Kummu, M., Ward, P., de Moel, H., and Varis, O.: Is physical water scarcity a new phenomenon? global assessment of water shortage over the last two millennia, Environ. Res. Lett., 5, 2010. Leakey, A. D. B., Ainsworth, E. A., Bernacchi, C. J., Rogers, A.,
Long, S. P., and Ort, D. R.: Elevated CO2effects on plant carbon,
nitrogen, and water relations: six important lessons from FACE, J. Exp. Bot., 60, 2859–2876, 2009.
Lenton, T. M., Held, H., Kriegler, E., Hall, J. W., Lucht, W., Rahm-storf, S., and Schellnhuber, H. J.: Tipping elements in the Earth’s climate system, P. Natl. Acad. Sci., 105, 1786–1793, 2008. Levermann, A., Bamber, J., Drijfhout, S., Ganopolski, A., Haeberli,
W., Harris, N. R. P., Huss, M., Krüger, K., Lenton, T., Lindsay, R. W., Notz, D., Wadhams, P. and Weber, S.: Potential climatic transitions with profound impact on Europe – Review of the cur-rent state of six “tipping elements of the climate system,” Clim. Change, 110, 845–878, doi:10.1007/s10584-011-0126-5., 2012. Lin, M. and Huybers, P.: Reckoning wheat yield trends, Environ.
Res. Lett., 7, 024016, 2012.
Long, S. P., Ainsworth, E. A., Leakey, A. D. B., Nösberger, J. and Ort, D. R.: Food for thought: lower-than-expected crop yield stimulation with rising CO2concentrations., Science, 312, 1918–
1921, doi:10.1126/science.1114722, 2006.
Lotze-Campen, H., Müller, C., Bondeau, A., Rost, S., Popp, A., and Lucht, W.: Global food demand, productivity growth, and the scarcity of land and water resources: a spatially explicit math-ematical programming approach, Agric. Econ., 39, 325–338, 2008.
Moss, R. H., Edmonds, J. A., Hibbard, K. A., Manning, M. R., Rose, S. K., van Vuuren, D. P., Carter, T. R., Emori, S., Kainuma, M., Kram, T., Meehl, G. A., Mitchell, J. F. B., Nakicenovic, N., Riahi, K., Smith, S. J., Stouffer, R. J., Thomson, A. M., Weyant, J. P., and Wilbanks, T. J.: The next generation of scenarios for climate change research and assessment, Nature, 463, 747–756, 2010. Müller, C., Eickhout, B., Zaehle, S., Bondeau, A., Cramer, W., and
Lucht, W.: Effects of changes in CO2, climate, and land use on
the carbon balance of the land biosphere during the 21st century, J. Geophys. Res., 112, G02032, doi:10.1029/2006JG000388, 2007.
Nelson, G. C., Ahammad, H., Deryng, D., Elliott, J., Fujimori, S., Havlik, P., Heyhoe, E., Page, K., von Lampe, M., Lotze-Campen, H., Daniel Mason, D., van Meijl, H., van der Mensbrugghe, D., Müller, C., Robertson, R., Sands, R. D., Schmid, E., Schmitz, C., Tabeau, A., Valin, H., Willenbockel, D., Rosenzweig, C., Ru-ane, A. C., Arneth, A., Boote, K. J., Folberth, C., Glotter, M., Khabarov, N., Neumann, K., Piontek, F., Pugh, T. A. M., Ste-hfest, E., Yang, H., and Jones, J. W.: Climate change effects on agriculture: Economic responses to biophysical shocks, PNAS, 111, 3268–3273, doi:10.1073/ pnas.1222463110, 2013.