HAL Id: halshs-01379284
https://halshs.archives-ouvertes.fr/halshs-01379284
Submitted on 11 Oct 2016
HAL is a multi-disciplinary open access
archive for the deposit and dissemination of sci-entific research documents, whether they are pub-lished or not. The documents may come from teaching and research institutions in France or abroad, or from public or private research centers.
L’archive ouverte pluridisciplinaire HAL, est destinée au dépôt et à la diffusion de documents scientifiques de niveau recherche, publiés ou non, émanant des établissements d’enseignement et de recherche français ou étrangers, des laboratoires publics ou privés.
The Eurozone deposit rates’ puzzle: choosing the right
benchmark
Julien Pinter, Charles Boissel
To cite this version:
Julien Pinter, Charles Boissel. The Eurozone deposit rates’ puzzle: choosing the right benchmark. 2016. �halshs-01379284�
Documents de Travail du
Centre d’Economie de la Sorbonne
The Eurozone deposit rates’ puzzle: choosing the right benchmark
Julien PINTER, Charles BOISSEL
The Eurozone deposit rates’ puzzle: choosing the right benchmark
1Julien PINTER (Université Paris 1, Amsterdam University, University of Saints Louis2) Charles BOISSEL (Paris HEC3)
August, 2016
Abstract:
The paper proposes an alternative benchmark to the EURIBOR to analyze the post-‐crisis puzzling behavior of deposit rates in the Eurozone. Using bank-‐level CDS data for 6 major euro-‐countries, we build a simple country-‐level index for banks’ cost of unsecured funding. The use of this index instead of the traditionally used EURIBOR restores the cointegration relationship between deposit rates and their reckoned opportunity cost. It also suggests that deposits have actually not been significantly over-‐remunerated in most euro area countries since the financial crisis, in contrast with what is often argued. Our index appears as a good alternative to the EURIBOR, which we show has become irrelevant for many countries.
Key words: deposit rates, euribor, cointegration, panel estimates, banks JEL classification: E43; E50; G10; G21
This work was achieved through the Laboratory of Excellence on Financial Regulation (Labex ReFi) supported by PRES heSam under the reference ANR-‐10-‐LABX-‐0095. It benefitted from a French government support managed by the National Research Agency (ANR) within the project Investissements d'Avenir Paris Nouveaux Mondes (invesments for the future Paris-‐ New Worlds) under the reference ANR-‐11-‐IDEX-‐0006-‐02.
1 The authors thank Christian Bordes, Massimo Giuliodori, Gunther Capelle-‐Blancard, Rodolphe Dos Santos Ferreira, Michael McMahon, Evren Örs, Jézabel Couppey-‐Soubeyran, Lucas Rossini, Yannick Lucotte, Marc Pourroy, Aurélien Leroy, Amine Tazi and Kenneth De Beckker for their helpul remarks. We also thank the participants of the University of Poitiers CRIEF seminar, the Autumn Doctoral Saint-‐Louis workshop, the Paris 1 Doctorissimes seminar, the GDRE 2016 conference and the MFS Society conference in Stockholm for their helpful remarks which contributed to improve this paper.
2 Mail: julien.pinter@gmail.com
1. Introduction
In this study, we focus on the main instrument of bank funding in the Eurozone, namely deposits from non-‐banks (European Central Bank4, 2012a)5. A puzzling feature about banks
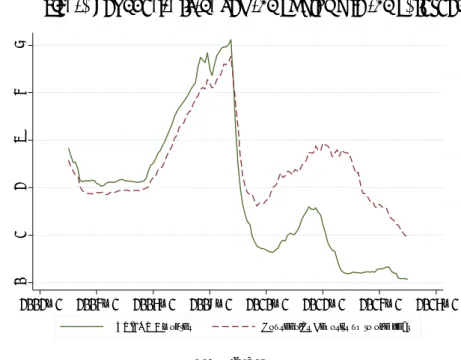
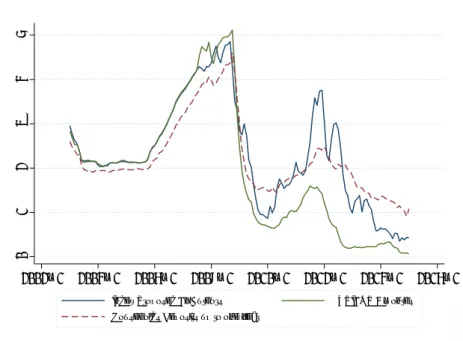
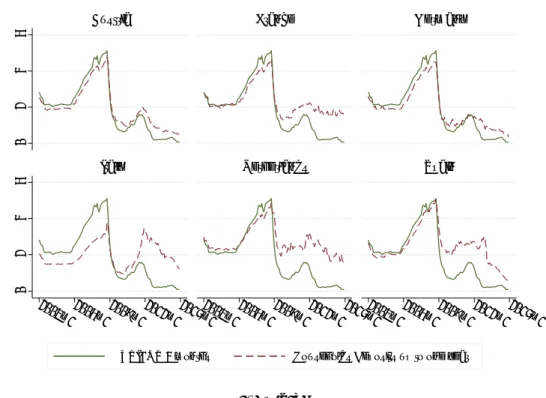
deposits is that they seem to have been remunerated at relatively high rates compared to bank’s wholesale funding costs since the 2008 financial crisis. Deposit rates, which were closely following the Euro Interbank Offered Rate (EURIBOR henceforth) before the crisis, have diverged substantially from it since then (Figure 1). Banks thus seem to have been willing or constrained to pay more for deposits than what they pay for funding on the wholesale market. This is particularly true for periphery countries (Figure 7 and 8, Appendix 1). In an economy such as the Eurozone where banks are the main vector of monetary policy transmission and where high bank funding costs have been a key factor preventing lending rates from adjusting downwards (Illes et al., 2015), the issue appears of prime importance.
Figure 1: Deposits rates and the EURIBOR in the Eurozone
Source: ECB
Few papers mention explanations for this post-‐crisis phenomenon. ECB (2012a) and ECB (2009) mention the persistent risks on unsecured funding, pushing banks to attract deposits at higher prices. ECB (2012a) also insists on the regulation incentives to increase stable source of funding. Daracq Paries et al. (2014) mention banks’ reluctance to pass low rates on their depositors.
This paper takes another approach and argues that this “puzzle” is mainly due to the fact that the EURIBOR has become an inappropriate proxy for banks wholesale funding costs, and thus has become irrelevant as a benchmark. The reason for the use of EURIBOR as a benchmark is that banks traditionally price deposits relative to the cost of unsecured funding
4 ECB henceforth.
5 At the end of 2011, non-‐bank deposits were on average about 35% of banks liabilities, with a median value reaching
43.5% (ECB, 2012a). Hence, deposits weigh heavily on bank funding costs in the Eurozone.
0 1 2 3 4 5 2002m1 2004m1 2006m1 2008m1 2010m1 2012m1 2014m1 2016m1
(Cadamagnani et al., 2015; Sander and Kleimeier, 2004). This cost of unsecured funding was tightly linked to EURIBOR for the majority of banks before the crisis, but it then substantially diverged from it as bank funding conditions became severely heterogeneous (ECB, 2012b). In effect, this means that the cost of unsecured funding for Spanish banks for instance have substantially diverged from the cost of unsecured funding for German banks after the crisis. Using the EURIBOR for these two countries will lead one to misleadingly assume similar or connected costs of funds, thereby leading to distorted conclusions.
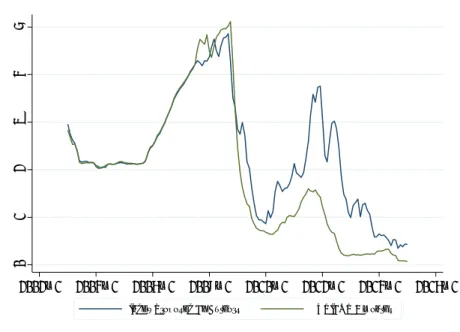
Using the standard theory on the structure of interest rates, we build an index for banks’ cost of unsecured funding at the country-‐level, using a risk-‐free rate and a weighted average of banks’ risks premium (as measured by their CDS). This index is very close to the EURIBOR before the 2008 financial crisis in each country we analyze (Figure 2), but then substantially diverges from it in most countries, especially for periphery-‐countries.
Figure 2: Authors’ index for the cost of unsecured funding versus EURIBOR
Source: Authors’ sample, ECB
We obtain two results from the use of our index. First, the use of our index restores the cointegration relationship between deposit rates and the cost of unsecured funding. Panel cointegration tests indeed fail in the post crisis period with the EURIBOR, but lead the expected result with our index. Running similar tests at the country-‐level shows that the relationship with the EURIBOR has become especially irrelevant for periphery countries, unlike the relationship with our index. Our index thus appears as a more relevant benchmark than the EURIBOR to understand deposit pricing in the Eurozone. Second, the use of our index shows that deposits have not been significantly over-‐remunerated since the 2008 financial crisis, unlike what is commonly argued. Building counterfactuals rates from standard panel models, we show that 72% of the seemingly “over-‐remuneration” of deposits is simply due to the use of the EURIBOR as a benchmark.
0 1 2 3 4 5 2002m1 2004m1 2006m1 2008m1 2010m1 2012m1 2014m1 2016m1
The rest of the paper is organized as follows: section 2 presents the conventional theoretical framework for deposit pricing, reviews the shortcomings of the EURIBOR and explains how we build our index. Section 3 presents the data and the empirical method. Section 4 presents the empirical results, and section 5 the graphical analysis. Section 6 concludes. 2. Theoretical considerations
2.1 The conventional framework for deposit pricing
It is common in academic studies since the work of Cottarelli and Kourelis (1994) at least to link deposit or lending rates to money market rates, the later being considered as a good proxy for the marginal cost of funding. In the conventionally used model, the bank interest rate (BR) is set by banks depending on a marginal cost price (MC):
BR = θ0 + θMC
The coefficient θ0 is a markup over the banks’ marginal costs due to transaction costs, while
the size of the parameter θ depends on the demand elasticity for the banking product6. In the case of deposits, MC can be seen as the opportunity cost (Sander et al., 2004). If banks were operating effectively in a perfectly competitive world, moves in MC would be entirely reflected in BR: the coefficient θ would be equal to one. Such an approach is widely used in the literature, for example in De Bond (2002), Sander et al. (2004), De Graeve et al. (2007), ECB (2009), Rocha (2012), Van Leuvensteijn et al. (2013), Daracq Paries et al. (2014), Leroy and Lucotte (2015) among others. We do not call into question this approach, but the way it is empirically implemented.
For deposit rates, the marginal cost price considered usually corresponds to the price of unsecured funding. This approach is justified by the fact that banks traditionally price their retail products in relation to the marginal cost of unsecured funding (Cadamagnani et al., 2015). This cost is usually approximated by a market interest rate for unsecured funding, the EURIBOR in the case of the Eurozone. As it appears in De Bond (2002) e.g., the underlying idea behind this widely spread custom is that market interest rates are seen as the most appropriate marginal cost prices due to their “accurate reflection of the marginal costs faced
by banks”. Consistently, the vast majority of empirical studies analyzing the pricing of banks’
retail products in the Eurozone use EURIBOR rates as benchmarks7. We are arguing that this
custom is not appropriate anymore.
6 In the case of deposits, switching costs, information asymmetries and market power will for example generally imply θ<1. Hutcheson (1995) provides solid theoretical foundations on this point.
7 See for example Sander et al. (2004), De Graeve et al. (2007), ECB (2009), ECB (2012a), Rocha (2012), Banerjee et al. (2013), Van Leuvensteijn et al. (2013), Daracq Paries et al. (2014), Leroy and Lucotte (2015) among others.
2.2 The irrelevance of the EURIBOR in the post-‐crisis world
The EURIBOR is computed based on a survey in which some representative banks (by their activity on the euro money market) say how much they would charge a prime bank for an unsecured loan on the money market (Taboga, 2014). Prime banks are supposed to be the less fragile banks, what makes the EURIBOR sometimes called the “best rate for the best
banks”8. To the extent that loans with no guarantee are considered, the EURIBOR is widely
used as a proxy for the cost of unsecured funding in economic studies9.
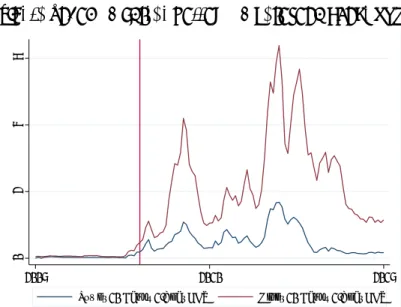
The problems of using the EURIBOR as a benchmark for the cost of unsecured funding have been revealed by the 2008 financial crisis. A dramatic change that occurred is that funding conditions have become extremely heterogeneous (ECB, 2012b). As a consequence, the EURIBOR has become by essence non-‐representative of the funding conditions for the majority of the banks, especially for the banks located in the periphery of the Eurozone, which have been perceived as much more risky. Figure 3 illustrates this fact by showing the average CDS of the 10 banks with respectively the lowest and highest CDS in our sample.
Figure 3: Top 10 versus Bottom 10 Eurozone banks CDS
Source: Markit, authors’ sample. CDS are in percentage points.
As funding conditions became extremely heterogeneous the rate at which non-‐prime banks could borrow became heterogeneously disconnected from the rates at which prime banks can borrow. Under these conditions, econometric or graphical analysis using the EURIBOR will automatically fail to capture any meaningful long-‐term relationship with deposit rates for non-‐prime banks10.
8 See Taboga (2014) for a discussion on the EURIBOR.
9 It is worth mentioning that the EURIBOR can be an appropriate benchmark for banks others than “prime banks” also when the risk premium the later would pay when borrowing unsecured (compared with prime banks) is negligible or roughly constant over time. This can explain why the use of the EURIBOR as a proxy for the cost of unsecured funding in pre-‐crisis economic studies used to be not problematic.
10 In addition to the heterogeneity in funding conditions, two other observations may contribute to make the EURIBOR less
relevant: the number of “prime banks” has severely declined (Taboga, 2014) and the liquidity on the unsecured interbank market has severely decreased since the financial crisis (Babihuga and Spaltro, 2014; Financial Times, 2010). The former argument implies that the EURIBOR has become of direct relevance for only few banks in the post-‐crisis world. The later implies that the EURIBOR may have become an irrelevant proxy even for prime banks’ cost of unsecured funding. Since the
0
2
4
6
2005 2010 2015
2.3 A new proxy for banks’ unsecured funding costs
We build a new index for banks’ cost of unsecured funding at the country-‐level11. Similar to
Illes et al. (2015), we use the standard structure of interest rates to proxy the interest rate on unsecured debt for bank n at time t:
Interest rate n,t = risk-‐free rate n,t + risk premium n,t + liquidity premium n,t
The risk-‐free rate is proxied by the Overnight Index Swap rate (OIS rate henceforth) for a given maturity, which is supposed to reflect only the policy interest rate expectations12. The
risk premium is proxied by the Credit Default Swap (CDS henceforth) of the bank n in percentage points for comparable maturities13. Thus our index for the real cost of unsecured
funding for bank n at time t is simply:
𝐶𝑜𝑠𝑡 𝑜𝑓 𝑢𝑛𝑠𝑒𝑐𝑢𝑟𝑒𝑑 𝑓𝑢𝑛𝑑𝑖𝑛𝑔 !,! = 𝑂𝐼𝑆!+ 𝐶𝐷𝑆!,!
With 𝑂𝐼𝑆! the OIS rate at time t for the maturity considered and 𝐶𝐷𝑆!,! the CDS of the bank for comparable maturities in percentage points. Using a weighted average of this indicator for all the banks in the country i we obtain an index at the country level for the cost of unsecured funding: 𝐼𝑛𝑑𝑒𝑥 !,! = 𝐷𝑒𝑝𝑜𝑠𝑖𝑡 𝑠ℎ𝑎𝑟𝑒!,!∗ 𝐶𝑜𝑠𝑡 𝑜𝑓 𝑢𝑛𝑠𝑒𝑐𝑢𝑟𝑒𝑑 𝑓𝑢𝑛𝑑𝑖𝑛𝑔 !,! ! !!!
Where 𝐷𝑒𝑝𝑜𝑠𝑖𝑡 𝑠ℎ𝑎𝑟𝑒!,! is the customer deposits of the bank n in proportion of the total deposits of the banks in country i (weighting criteria)14.
In contrast with the EURIBOR, our index thus takes into account the heterogeneity in funding conditions between prime and non-‐prime banks. A simple way to see this is that we will now have two different costs of funds for German and Spanish banks (Figure 9, Appendix 1).
EURIBOR is based on declarations rather than on actual rates, it may indeed have become disconnected from the rates at which banks can effectively borrow on the unsecured market, for example by issuing debt.
11 Building a proxy is necessary insofar as there are no monthly data available for bank-‐specific unsecured debt with a given maturity.
12 See Taboga (2014) for a discussion.
13 We do not explicitly take into account liquidity premia for two reasons: first there is a lack of appropriate data, second CDS already contain a liquidity premium that might thus make up for this omission.
14 We also considered weighting CDS by banks’ total assets: the indicator obtained by doing so was very similar, so that the results presented here were roughly unchanged.
3. Empirical approach
3.1 Methodology
We consider the standard framework in which deposit rates are linked to the cost of unsecured funding, discussed in subsection 2.115. We consider the usual specification with
EURIBOR (1) and the specification with our index (2).
𝐷𝑒𝑝𝑜𝑠𝑖𝑡 𝑟𝑎𝑡𝑒!,! = 𝑐𝑜𝑛𝑠𝑡𝑎𝑛𝑡! + 𝛽 𝐸𝑈𝑅𝐼𝐵𝑂𝑅!,!+ 𝜀!,! (1)
𝐷𝑒𝑝𝑜𝑠𝑖𝑡 𝑟𝑎𝑡𝑒!,! = 𝑐𝑜𝑛𝑠𝑡𝑎𝑛𝑡! + 𝛽 𝐼𝑛𝑑𝑒𝑥 !,!+ 𝜀!,! (2)
The deposit pricing behavior of banks should imply a linear relationship between deposit rates and the cost of unsecured funding in the long run. No other variable is needed if this long-‐term relationship holds in theory16. In econometrics terms, considering the variables as
integrated of order 1, this means that the two variables should be cointegrated. In what follows we perform cointegration tests with, in turn, EURIBOR and our index used as a proxy, in a panel set-‐up at first and then for each country of our sample.
3.2 Data
Our dataset consists of monthly data from 2003:1 to 2015:1.
We use country-‐level deposit rates from ECB. In order to precisely capture the pricing behavior of banks, we use deposit rates with an agreed maturity a) with a maturity lower than 1 year b) with a maturity between 1 and 2 years and c) with a maturity over 2 years. Deposits from households and non-‐profit institutions are considered in that they represent the most important share of deposits and the one appearing as highly remunerated (Figure 1).
We obtain banks’ CDS from Markit and restrict our sample to retail banks. We select the countries based on data availability for bank CDS17: Austria, Germany, France, Italy, Spain, Netherlands. One-‐year CDS contracts on senior unsecured debt are considered in order to closely match deposits’ maturity. Banks’ total customer deposits data used for weighting are from Bankscope and linearly interpolated. OIS rates for a maturity of 3 months and 1 year are considered.
Standard panel unit-‐root tests confirm that all our data are integrated of order 1 (Appendix 3), thus making a cointegration analysis appropriate.
15 Note that we do not question this aspect of the literature in this paper. The pricing of deposits using the cost of unsecured funding as a benchmark is often presented as a traditional feature of banks’ pricing behavior (see Cadamagnani
et al. 2015 eg) and widely spread in the empirical literature. We focus on improving this strand of the literature.
16 Competition in the banking sector is neglected as we have a short period (7 years, see subsection 3.2) in which this factor is likely not to play a significant role and is possibly taken into account through the constant term.
4. Cointegration tests: EURIBOR versus our index
4.1 Panel analysis
We first make cointegration tests in a panel framework, where we naturally expect more power from the tests given the potential correlation of shocks hitting eurozone economies. Following the connected literature (Rocha, 2012; Bernhofer and Van Treeck, 2013; Leroy and Lucotte, 2014 ; Illes et al., 2015) and given our small N dimension, we primarily use the Westerlund tests (Westerlund, 2007) for cointegration (see Appendix 3). We focus on the post crisis period, where the puzzle appears (results for the pre-‐crisis period are given in Appendix 4 and indicate cointegration with both the EURIBOR and our index). In order not to take into account the huge volatility following Lehman brother’s bankruptcy at the end of 2008, we start our analysis in 2009:1. Table 1 reports the results, where in the first column we stick to the basic approach of Westerlund (2007) and in the second column we account for cross-‐sectionnal dependence using the bootstrap approach of Westerlund (2007) with 800 replications (maximum allowed in our software).
Table 1: Westerlunds tests for cointegration (2009:1 – 2015:1)
Westerlunds tests of cointegration
Basic Robust to cross-‐sectional
dependence
Variables Ga
statistic Gt statistic Pa statistic Pt statistic Ga statistic Gt statistic Pa statistic Pt statistic With
EURIBOR Deposit < 1 year 0.729 0.248 0.675 0.420 0.641 0.309 0.721 0.542 Deposit between 1 and 2 years 0.076 0.001 0.441 0.125 0.135 0.048 0.596 0.416 Deposit > 2 years 0.267 0.153 0.214 0.046 0.315 0.478 0.451 0.461 With our
Index Deposit < 1 year 0.000 0.000 0.000 0.000 0.000 0.000 0.000 0.000 Deposit between 1 and 2 years 0.000 0.000 0.000 0.000 0.001 0.006 0.003 0.003 Deposit > 2 years 0.002 0.011 0.000 0.000 0.034 0.037 0.054 0.031
Note: The Ga and Gt test statistics test H0: ai = 0 for all i versus H1: ai < 0 for at least one i, where ai is the error correction coefficient (see Westerlund (2007) and Appendix 3). These statistics start from a weighted average of the individually estimated ai's and their t-‐ratio's respectively. Rejection of H0 should be taken as evidence of cointegration of at least one of the cross-‐sectional units. The Pa and Pt test statistics pool information over all the cross-‐sectional units to test H0: ai = 0 for all i vs H1: ai < 0 for all i. We use an automatic selection of lags from the AIC criteria. We impose a constant in the cointegration relationship as suggested by the theory. Following the literature, EURIBOR 3months is used for the cointegration relationship with deposits with a maturity lower 1 year (Deposit rates < 1 year), EURIBOR 1 year otherwise. Similarly, OIS 3 months is used in our index for deposits with a maturity lower than 1 year, OIS 1 year otherwise.
All in all, the results indicate that there is no cointegration relationship between deposit rates and the EURIBOR in the post-‐crisis world, unlike what could be found in the pre-‐crisis period (see Appendix 4).
Only for deposits with a maturity from 1 to 2 years the Gt statistic suggests the presence of cointegration for at least one panel, but the result barely holds when we consider the robust version of the Westerlund test. In contrast, the cointegration relationship can be inferred with our index, and this for all the deposit maturities considered here.
In Appendix 4, we show that the conclusions are roughly similar when we consider an alternative (residual-‐based) cointegration test, namely the Pedroni test, although the test is less adapted to our small N case.
4.2 Country-‐level analysis
To better understand what drives these findings, we run cointegration tests at the country-‐ level. We apply the Engle and Granger method. That is we estimate equations (1) and (2) directly and test for stationarity of the estimated residuals by estimating the following model in each country:
∆𝜀!= α𝜀!!!+ 𝑢! (3)
And testing for H0: α = 0 (unit root) vs H1: α ≠ 0 (no unit root) using the interpolated Dickey-‐Fuller critical values as a reference18. Note that we include lags of the independent variable, with a selection based on the AIC criteria19. Results are given for the 5% threshold, we indicate in Table 3 directly whether H0 is rejected or not since the software we use (STATA) doesn’t report the p-‐values.
18 We didn’t include any constant or trend in (3) thus we don’t need to use the McKinnon critical values.
19 With a maximum of 4 lags and a minimum of 2 lags in order to avoid any biais affecting the test (setting a minimum doesn’t impact our results).
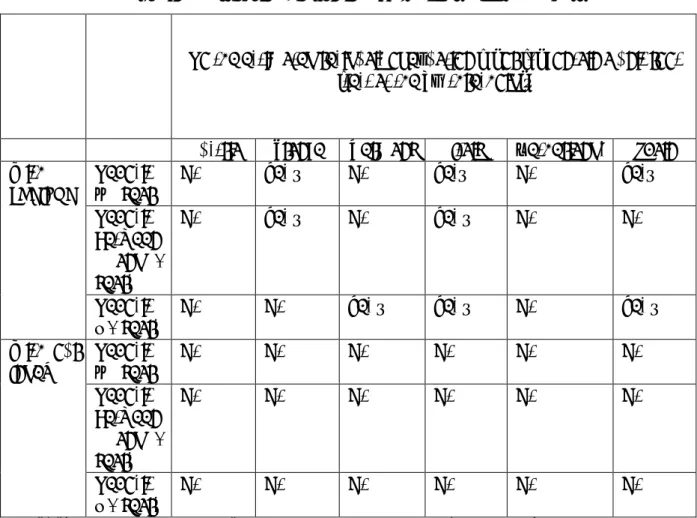
Table 2: Test for cointegration in subsamples (2009:1 – 2015:1)
Do the estimated residuals of equation (1) or (2) contain a unit root (test at the 5% threshold)?
Austria France Germany Italy Netherlands Spain
With
EURIBOR Deposit < 1 year No Yes * No Yes* No Yes*
Deposit between 1 and 2 years
No Yes * No Yes * No No
Deposit
> 2 years No No Yes * Yes * No Yes *
With our
Index Deposit < 1 year No No No No No No
Deposit between 1 and 2 years
No No No No No No
Deposit
> 2 years No No No No No No
Note: (*) when the Dickey-‐fuller test rejects the presence of a unit root at the 5% threshold, we consider that there is no unit root “no”. Otherwise we note “yes”, which has to be understood as “we have no proof that there is no unit root”. We interpret “rejecting unit root” as evidence of cointegration. We use an automatic selection of lags from the AIC criteria. Following the literature, EURIBOR 3 months is used for the cointegration relationship with deposits with a maturity lower than 1 year, EURIBOR 1 year otherwise. Similarly, OIS 3 months is used in our index for deposits with a maturity lower than 1 year, OIS 1 year otherwise.
As we can see on Table 2, the data do not give support to any cointegration relationship between EURIBOR and the deposit rates for France, Italy and Spain. In contrast, the cointegration relationship is always captured by our index. Interestingly, the relationship fails with the EURIBOR in countries in which banks have become perceived as riskier.
5. Graphical analysis: EURIBOR versus our Index
5.1 Basic observation
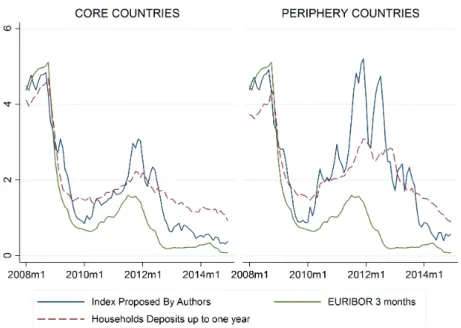
When using our index the picture regarding deposit remuneration changes dramatically, especially for periphery-‐countries (Figure 5).
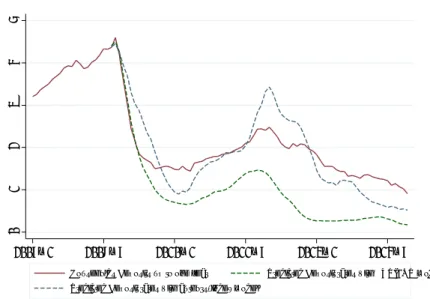
Deposits do not appear anymore as significantly over-‐remunerated since the beginning of the financial crisis20 (Figure 4 and 5). Only after 2013 some persistent “over-‐remuneration” appears, although often limited. This trend is present in all the six countries we analyzed (Figure 9, Appendix 1) with the exception of the Netherlands. This indicates that other factors that were not present before 2013 are at work since then.
Figure 4: EURIBOR, Authors’ index and Deposit rates in the Eurozone
Source: Authors’ sample, ECB
20 It could be argued that the fact we used 1 year CDS premia rather than the ones of a shorter maturity could partly explain the lower gap with our proxy. We take this into account hereafter by basing our comparisons on predicted rates from two different models: the results clearly indicate that this choice doesn’t have any key impact on our conclusions. Note also that the picture is barely different when we use CDS 6 months (available for fewer data) instead of 1 year, with sometimes a proxy showing even higher rates than when we use CDS 1 year (what could be explained by the fact the short term risk is sometimes perceived as higher than the long term one). In our sample the difference between the index we could build with data for CDS 6 months and the one we use here is only 0.096 basis points on average, thus really minor.
0 1 2 3 4 5 2002m1 2004m1 2006m1 2008m1 2010m1 2012m1 2014m1 2016m1
Index Proposed By Authors EURIBOR 3 months Households Deposits up to one year
Figure 5: EURIBOR, Authors’ index and Deposit rates in the Eurozone:
Core versus Periphery countries
Source: Authors’ sample, ECB
5.2 Observation based on predicted rates
In order to quantify to which extent the misuse of the EURIBOR contributes to make deposit rates appear over-‐remunerated, we look at the level of deposit rates which is predicted by a simple model using the EURIBOR as a key variable, and then compare this prediction with the one from a similar model using our index as a key variable. The model used is the standard Panel Mean-‐Group model (Pesaran and Smith, 1995). We estimate the parameters of the models for the pre-‐crisis period, and then use them to predict deposit rates (details of the estimates are given in Appendix 5).
As we can see on Figure 6, using the EURIBOR leads us to predict significantly lower deposit rates than when we use our index (Figure 10 and 11 in Appendix 1 shows the picture for each country). A simple computation shows that 72% of the seemingly over-‐remuneration of deposits is actually due to the use of the EURIBOR as a benchmark.
Figure 6: Predicted deposit rates with the EURIBOR and with authors’ index
versus actual deposit rates in the Eurozone:
Source: Authors’ estimates, ECB
6. Conclusion
This study shows that the EURIBOR has become an inappropriate benchmark to analyze the pricing of deposit rates in the post-‐crisis period in the Eurozone. We argued that the reason for this is that the EURIBOR doesn’t faithfully reflect the cost of unsecured funding for Eurozone banks anymore, given the substantial heterogeneity in bank funding conditions. In contrast, the index we have built appears more relevant. It captures the post-‐crisis heterogeneity in funding conditions and restores the cointegration relationship between deposit rates and the cost of unsecured funding.
Our index shows that banks’ deposits have actually not been significantly “over-‐ remunerated” since the 2008 financial crisis. We find that 72% of the seemingly over-‐ remuneration of deposits is actually explained by the use of the wrong benchmark, namely the EURIBOR. This observation both attenuates the veracity of the statements made in previous works (ECB, 2009; ECB, 2012a; Daracq Paries et al., 2014) and lays the foundations for future research: the behavior of deposit rates can’t be analyzed with the EURIBOR anymore.
Further research remains necessary to understand which new factors have been driving deposit rates in the recent years. Our analysis indeed reveals that new factors have been influencing the pricing of deposit rates in Eurozone countries since 2013. For such subsequent research our paper shows the necessity of using alternative proxies to the EURIBOR. We provide a simple and coherent one.
0 1 2 3 4 5 2007m1 2008m7 2010m1 2011m7 2013m1 2014m7
Households Deposits up to one year Predicted Deposit rates with EURIBOR model
References:
Babihuga, R. -‐ Spaltro, M. (2014): Bank Funding Costs for International Banks. IMF Working Papers no. 14/71, International Monetary Fund, Washington, DC.
Banerjee, A. – Bystrov, V. -‐ Mizen, P. (2013): How Do Anticipated Changes to Short-‐Term
Market Rates Influence Banks' Retail Interest Rates? Evidence from the Four Major Euro Area Economies. Journal of Money, Credit and Banking, 2013, vol 45, pp 1375–1414.
Bernhofer, D. -‐ Van Treeck, T. (2013): New evidence of heterogeneous bank interest rate
pass-‐through in the euro area. Economic Modelling, 2013, vol. 35, pp 418-‐429.
Cadamagnani, F. -‐ Harimohan, R. -‐ Tangri, K. (2015): A Bank within a Bank: How a
Commercial Bank's Treasury Function Affects the Interest Rates Set for Loans and Deposits.
In: Bank of England Quarterly Bulletin 2015 Q2
Cottarelli, C. -‐ A. Kourelis (1994): Financial structure, bank lending rates, and the
transmission mechanism of monetary policy. IMF Staff Papers, vol. 41. International
Monetary Fund, Washington, DC., no.4.
Daracq Paries, M. -‐ Moccero, D. -‐ Krylova, E. – Marchini, C. (2014): The Retail Bank Interest
Rate Pass-‐Through: The Case of the Euro Area During the Financial and Sovereign Debt Crisis.
ECB Occasional Paper no. 155. European Central Bank, Frankfurt.
De Bondt, G. (2002): Retail bank interest pass-‐through: New evidence at the euro area level. ECB Working Paper, no. 0136. European Central Bank, Frankurt.
De Graeve, F. -‐ De Jonghe, O. -‐ Vander Vennet, R. (2007), Competition, transmission and
bank pricing policies: Evidence from Belgian loan and deposit markets, Journal of Banking &
Finance, 2007, vol. 31, pp. 259-‐278.
ECB (2009): Recent developments in the retail bank interest rate pass-‐through in the Euro
area. In: ECB Monthly Bulletin, August 2009. European Central Bank, Frankfurt.
ECB (2012a): Changes in Bank financing patterns. In: ECB Publications on Financial Stability, April 2012. European Central Bank, Frankfurt.
ECB (2012b): Heterogeneity in Euro Area financial conditions and policy implications. In: ECB Monthly Bulletin, August 2012. European Central Bank, Frankfurt.
Financial Times (2010). Euribor has been vaporized. Izabella Kaminska, August 16, 2010 FT Alphaville.
Hutchison, D. (1995). Retail Bank Deposit Pricing: An Intertemporal Asset Pricing Approach. Journal of Money, Credit and Banking, 1995, vol. 27, pp. 217-‐231.
Illes, A. – Lombardi, M. – Mizen, P. (2015): Why did bank lending rates diverge from policy
rates after the financial crisis? In: BIS Working Papers. Bank for International Settlements,
no. 486.
Leroy, A. – Lucotte, Y. (2015): Heterogeneous Monetary Transmission Process in the
Eurozone: Does Banking Competition Matter? International Economics, 2015, vol. 141, pp
115-‐134.
Pedroni, P. (1999): Critical values for cointegration tests in heterogeneous panels with
multiple regressors. Oxford Bulletin of Economics and Statistics, 1999, vol. 61, pp. 653-‐670.
Pedroni, P. (2004): Panel cointegration: Assymptotic and finite full sample properties of
pooled time series tests with an application to the PPP hypothesis. Econometric Theory,
2004, vol. 20, pp. 597-‐625.
Pesaran, M. -‐ Smith, R. (1995): Estimating long-‐run relationships from dynamic
heterogeneous panels. Journal of Econometrics, 1995, vol. 68 (1), pp. 79-‐113.
Rocha, M.D. (2012): Interest rate pass-‐through in Portugal Interactions, asymmetries and
heterogeneities. Journal of Policy Modeling, 2012, vol.34, pp. 64-‐80.
Sander, H. – Kleimeier, S. (2004): Convergence in euro-‐zone retail banking? What interest
rate pass-‐through tells us about monetary policy transmission, competition and integration.
Journal of International Money and Finance, 2004, vol. 23, pp. 461-‐492.
Taboga, M. (2014): What is a prime bank? A Euribor-‐OIS spread perspective. International Finance, 2014, vol. 17, pp. 51-‐75.
Van Leuvensteijn, M. -‐ Kok Sorensen, C. -‐ Bikker, J.A. – Van Rixtel A.R.J.M. (2008): Impact of
bank competition on the interest rate pass-‐through in the euro area. Applied Economics,
2008, vol. 45, pp. 1359-‐1380.
Westerlund, J. (2007) Testing for error correction in panel data. Oxford Bulletin of Economics and Statistics, 2007, vol. 69, pp. 709–748.
Appendix
Appendix 1: Graph
Figure 7: Deposit rates (agreed maturity lower than 1 year) and the EURIBOR in the
Eurozone, by countries
Source: ECB
Figure 8: Deposit rates (agreed maturity between 1 and 2 years and over 2 years) and
the EURIBOR in the Eurozone, by countries
Source: ECB 0 2 4 6 0 2 4 6 20 03m 1 20 06m 1 20 09m 1 20 12m 1 20 15m 1 20 03m 1 20 06m 1 20 09m 1 20 12m 1 20 15m 1 20 03m 1 20 06m 1 20 09m 1 20 12m 1 20 15m 1
Austria France Germany
Italy Netherlands Spain
EURIBOR 3 months Households Deposits up to one year
0 2 4 6 0 2 4 6 2003m 1 2006m 1 2009m 1 2012m 1 2015m 1 2003m 1 2006m 1 2009m 1 2012m 1 2015m 1 2003m 1 2006m 1 2009m 1 2012m 1 2015m 1
Austria France Germany
Italy Netherlands Spain
EURIBOR 1 Year Households Deposits betw one and two years Households Deposits over two years
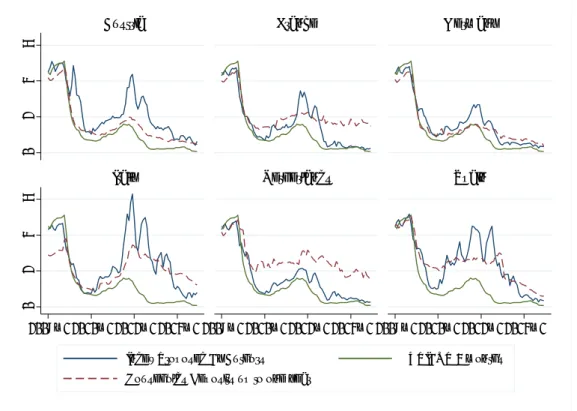
Figure 9: EURIBOR, Authors’ index and Deposit rates in the Eurozone, by countries
Source: Authors’ sample, ECB
Figure 10: Predicted deposit rates with the EURIBOR and with authors’ index
versus actual deposit rates in the Eurozone, by countries:
Source: Authors’ estimates, ECB
0 2 4 6 0 2 4 6 2008m1 2010m1 2012m1 2014m1 2008m1 2010m1 2012m1 2014m1 2008m1 2010m1 2012m1 2014m1
Austria France Germany
Italy Netherlands Spain
Index Proposed By Authors EURIBOR 3 months
Households Deposits up to one year
0 2 4 6 0 2 4 6 2007m1 2009m7 2012m1 2014m72007m1 2009m7 2012m1 2014m72007m1 2009m7 2012m1 2014m7
Austria France Germany
Italy Netherlands Spain
Households Deposits up to one year Predicted Deposit rates with EURIBOR model
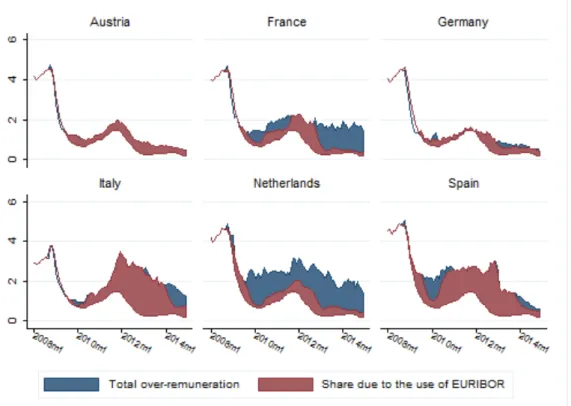
Figure 11: Share of deposits over-‐remuneration due to the use of the wrong proxy (deposits
with an agreed maturity lower that one year)
Source: Authors’ estimates, ECB
Appendix 2 : Variables
Sample of banks: Country Banks
Austria BAWAG P.S.K. AG *
ERSTE GROUP BANK *
Raiffeisen Zentralbank Österreich AG *
UNICREDIT Bank of Austria AG *
France BNP PARIBAS *
Banque Fédérative du Crédit Mutuel *
Crédit Industriel et Commercial SA – CIC
Crédit Agricole SA *
Crédit Lyonnais
Société Générale *
Germany Bayerischen Hypo-‐ und Vereinsbank AG
Bayerische Landesbank Giroz
Commerzbank AG *
Deutsche Bank AG *
DZ Bank AG *
HSH Nordbank AG
Landesbank BADENWUERTTEMBERG
Landesbank Berlin AG
Landesbank Hessen Giro
Norddeutsche Landesbank-‐Girozentrale
UNICREDIT Bank AG *
Italy BANCA Monte dei Paschi di Siena S.P.A. *
Banca Naz del Lavoro
Banca Popolare di Milano *
Banco Popolare -‐ Società Cooperativa-‐Banco Popolare
INTESA Sanpaolo S.P.A. *
Mediobanca S.P.A.
UNICREDITO Italiano S.P.A. *
Unione di Banche Italiane Società
Netherlands Cooperatieve Centrale Raiffeisen-‐B.A. -‐ Rabobank Nederland *
ING Bank N.V. *
SNS Bank N.V. *
THE RBS N.V. *
Spain Bankinter *
Banco Bilbao Vizcaya Argentaria BBVA *
Banco de Sabadell S.A.
Banco Popular Espanol S.A. *
Banco Santander S.A. *
Caixa d'Estalvis i Pensions de Barcelona
* means that the bank is among the top 5 commercial banks (by assets) found in Bankscope in 2014
Sources:
Variable
Label Source
Bank CDS CDS 1 year on Senior Debt
Mid rate
Markit
Bank total assets -‐ Bankscope.
Monthly values linearly interpolated before 2014. After 2014, value of December 2014 (since no data)
Bank total customers deposits -‐ Bankscope.
Monthly values linearly interpolated before 2014. After 2014, value of December 2014 (since no data)
Deposit rates Deposit with agreed
maturity. Respectively up to one year, between 1 and 2 years, over 2 years.
ECB
Appendix 3: Details on the empirical approach
Results of the unit root tests
To study the order of integration of our variables, we use the standard panel unit-‐root tests used in the literature we are in line with (Rocha, 2012; Van Leuvensteijn et al., 2013; Leroy and Lucotte, 2014), namely the Im-‐Pesaran-‐Shin test and the Hadri test. These tests are suitable for our small N dimension and accounts for potential heterogeneity, while allowing us to take advantage of our panel dimension. We use the whole sample period when possible (2003:1 – 2015:1). We do not include a time trend in the tests since it is clear there is no such trend in the data, and select the number of lags with the AIC criteria (with a maximum of 5). The Im-‐Pesaran-‐Shin test has as a nul hypothesis (H0) that all the series have a unit root (versus H1: at least one serie has a unit root). Table A1 shows that for all the series we deal with, H0 cannot be rejected at the conventional thresholds level of 5%. The Hadri test has as a nul hypothesis that all the series are stationary (versus H1: at least one serie has a unit root). As we can see on Table A1, H0 is clearly rejected for all the series we deal with. Doing the tests for the first difference leads us to reject the unit root hypothesis (or for the Hadri test not to reject the stationarity hypothesis) so that we infer the variables are I (1). For the EURIBOR, the standard Augmented Dickey-‐Fuller test is used, and also shows the series are I(1).
Table A1: Stationarity tests
lm-‐Pesaran and Shin
test: p-‐value Hadri test: p-‐value Augmented Dickey-‐Fuller test, HO rejected at 5% threshold?
Level First
Difference Level First Difference Level First Difference Deposits up to one
year 0.29 0.00 0.00 0.06 -‐ -‐
Deposits between 1
and 2 years 0.35 0.00 0.00 0.29 -‐ -‐
Deposits over 2 years 0.43 0.00 0.00 0.95 -‐ -‐
EURIBOR 3 months -‐ -‐ -‐ -‐ No Yes
EURIBOR 1 year -‐ -‐ -‐ -‐ No Yes
Authors’ Index built
with OIS 3 months 0.56 0.00 0.00 0.13 -‐ -‐
Authors’ Index built
with OIS 1 year 0.79 0.00 0.00 0.22 -‐ -‐
Notes: Im-‐Pesaran-‐Shin test has as a null hypothesis “all the series have a unit root” versus H1 “at least one serie has no unit root”. Not rejecting is interpreted as no prove of stationarity. The Hadri test has as a null hypothesis that “all the series are stationary” versus H1 “at least one serie has a unit root”. All tests are performed without any trend included. The augmented ADF test has as a null hypothesis “the serie has a unit root”, not rejecting leads us to infer non-‐stationarity. It is performed for EURIBOR in so far as this serie is the same for each country.