HAL Id: tel-01733118
https://tel.archives-ouvertes.fr/tel-01733118
Submitted on 14 Mar 2018HAL is a multi-disciplinary open access archive for the deposit and dissemination of sci-entific research documents, whether they are pub-lished or not. The documents may come from teaching and research institutions in France or
L’archive ouverte pluridisciplinaire HAL, est destinée au dépôt et à la diffusion de documents scientifiques de niveau recherche, publiés ou non, émanant des établissements d’enseignement et de recherche français ou étrangers, des laboratoires
Biosensor activatable in both fluorescence and 129Xe
NMR for detection of recombinant proteins
Emilie Mari
To cite this version:
Emilie Mari. Biosensor activatable in both fluorescence and 129Xe NMR for detection of recom-binant proteins. Analytical chemistry. Université Paris Saclay (COmUE), 2017. English. �NNT : 2017SACLV067�. �tel-01733118�
T H È S E D E D O C T O R AT D E L’ U N I V E R S I T É PA R I S
S A C L AY P R É PA R É E À L’ U N I V E R S I T É
V E R S A I L L E S - S A I N T - Q U E N T I N
e c o l e d o c t o r a l e 5 7 3i n t e r f a c e s : approches interdisciplinaires: fondements, a p p l i c at i o n s e t i n n ovat i o n s
s p é c i a l i t é : les sciences du vivant
Par Emilie Mari
Biosensor activatable in both fluorescence and
129Xe NMR for
detection of recombinant proteins
P U B L I C AT I O N S
Scientific papers
1. 129Xe NMR-based sensors: biological applications and recent methods
E. Mari and P. Berthault
Analyst, 142, 3298 - 3308 (2017) DOI: 10.1039/C7AN01088E 2. Note: Spin-Exchange Optical Pumping in a Van
C. Chauvin, L. Liagre, C. Boutin, E. Mari, E. Léonce, G. Carret, B. Coltrinari, and P. Berthault
Rev. Sci. Instrum. 87, 1, 016105 (2016) DOI: 10.1063/1.4940928 3. A doubly-responsive probe for the detection of Cys4-tagged
proteins
N. Kotera, E. Dubost, G. Milanole, E. Doris, E. Gravel, N. Arhel, T. Brotin, J.-P. Dutasta, J. Cochrane, E. Mari, C. Boutin, E. Léonce, P. Berthault and B. Rousseau
Chem. Commun. 51, 11482-11484 (2015) DOI: 10.1039/C5CC04721H 4. Synthesis of Cryptophanes with Two Different Reaction Sites
L-L. Chapellet, J. Cochrane, E. Mari, C. Boutin, P. Berthault, and Thierry Brotin
J. Org. Chem. 80, 12, 6143–6151(2015) DOI: 10.1021/acs.joc.5b00653
Submitted papers
1. A Fluorescence-129Xe NMR Probe Enabling Detection and Bi-ological Inhibition of EGFR in Non-Small Cell Lung Cancer G. Milanole, B. Gao, A. Paoletti, G. Pieters , C. Dugave, E. Deutsch, S. Rivera, F. Law, J-L. Perfettini, E. Mari, E. Léonce, C. Boutin, P. Berthault, H. Volland, F. Fenaille, T. Brotin and B. Rousseau Bioorg. Med. Chem. (2017)
2. A Straightforward Access to Cyclotriveratrylene Analogues with C1-Symmetry: Toward the Synthesis of Water-Soluble Monofunctionalizable Cryptophanes
G. Milanole, B. Gao, E. Mari, P. Berthault, G. Pieters, B. Rousseau J. Org. Chem. (2017)
Oral communications
1. 129Xe sensing tagged proteinsEuropean Molecular Imaging Meeting, Utrecht, Holland (March 2016)
3. 129Xe biosensors and biological applications CEA, France (December 2015)
4. A smart probe for intracellular detection Grand Bassin Parisien, France (May 2015)
Poster communications
1. Bimodal 129Xe NMR and fluorescence biosensor for tagged proteins
Ecole Paris Saclay, France (April 2016)
2. Detection of tagged peptides by a doubly smart sensor Interfaces, Ecole Polytechnique, France (November 2015) 3. Design and synthesis of a doubly responsive biosensor
A C K N O W L E D G E M E N T S
D’abord un grand merci à Céline Landon et Guy Lippens d’avoir ac-cepté d’étudier et de juger ce travail. Plus que 238 pages, courage ! Merci à Bruno Kieffer d’avoir accepté de faire partie de mon jury de thèse et Ewen Lescop de m’avoir si gentiment conseillée et encour-agée à mi-parcours.
Je remercie tout particulièrement mes trois directeurs de thèse qui ont chacun su se rendre indispensable et présent pendant ces trois années. Merci Bernard d’avoir cru en mes capacités de synthèse or-ganique alors que c’était loin d’être gagné, merci pour tes blagues et tes pertes de mémoire intempestives - loin de moi l’idée d’attaquer les personnes âgées. Merci Marie d’avoir su gérer mes allées et venues à l’improviste, d’avoir pris le relais quand il a fallu, d’avoir été là en journée en soirée et même le week-end. J’avais peut être un bureau, un ordinateur et une chaise mobiles et pas toujours disponibles, mais toi en revanche tu as toujours été un point fixe pour moi. Enfin, merci Patrick de m’avoir accueillie en stage de fin d’études, de m’avoir donné le goût de la recherche, de m’avoir donné l’opportunité de faire une thèse, de m’avoir formée et permis de participer à tant de projets variés et plus passionnants les uns que les autres. Merci de m’avoir laissé tant d’autonomie et d’avoir placé les filets au cas où. Sincèrement, merci à vous trois.
Mes chers collègues de synthèse ! Je ne vous citerai pas vous êtes bien trop nombreux à avoir rythmé le SCBM, à m’avoir appris tous les rudiments et avoir répondu à mes innombrables questions. Men-tion spéciale à la CryptoTeam: Gaëlle merci d’avoir pris sous ton aile la néophyte que j’étais, Bo merci d’avoir été mon second mentor. A celui qui a partagé ma paillasse, Alaric, merci pour tes invasions bar-bares. Céline, merci pour les purifs à gogo et tes petits passe-droits.
Mes chers collègues du LCP ! Merci Yasmina de ton aide, de ta présence et de ton sourire, utiles à de maintes reprises pendant ces manips difficiles ! Cornélia merci pour ta bienveillance, tes cellules en extra et tes conseils. Je te souhaite bonne chance pour la suite ! Aïcha, Xavier et Yasmine, merci d’avoir embelli mes allées et venues. A Jérémy, merci d’être une épaule attentive et toujours présente. Dis-cuter de la morale, de la vie et des rapports humains tout en pré-parant des expériences cellulaires très délicates, ce n’est pas donné à tout le monde. Enfin merci à Fabienne Merola et Philippe Maitre
Mes très chers collègues du LSDRM ! Céline, tant de partage dans ce bureau. Merci pour tout. Estelle, toujours présente que ce soit pour le boulot ou les bobos de la vie, je regretterai nos discussions ! Gas-pard, merci pour ta bienveillance à mon égard et ton optimisme de tous les jours ! Mélanie, rayon de soleil du labo, continue d’égayer ceux qui t’entourent ! A Jean-Pierre, Rodolphe, Alan, Thibault, Er-wann, Thierry et Rodolphe, nos pauses déjeuner, café me manqueront. A Guillaume, merci pour tes bons "camarade de pause", tes bières, ta bonne bouffe et tes soirées jeux. Merci d’avoir été un soutien et un ami pendant 4 ans.
Aux collaborateurs qui m’ont permis de découvrir d’autres hori-zons ! Sandra, William et Fred merci pour votre accueil, votre con-fiance et vos explications pour ces denses sessions in vivo. Thierry, merci pour ta disponibilité, tes idées permanentes et d’avoir permis la synthèse de la biosonde grâce à tes cryptophanes. Merci d’avoir été un parrain de thèse, toujours concerné.
A une rencontre professionnelle mais surtout amicale, Samy. Ta vi-sion sur la recherche, le monde dans son ensemble, ta culture et ta gentillesse font de toi un chercheur hors pair et une superbe rencon-tre.
Un grand merci à Lilou pour ses parenthèses parisiennes, et à Caro et Thibault pour leurs parenthèses à 4 lettres en verlan. Caro, Pierrick et Louise, merci pour vos soirées crêpes et de mettre mon verre tou-jours trop près de la crêpière. Merci pour ce texte de Saint-Exupéry qui résonne depuis chaque jour.
A la Kip’4, merci pour votre bonne humeur et votre soutien. Ces pauses sportives étaient du pur régal: " Force et honneur !".
Aux Nadine, merci. Que ce soit pour leurs compétences informa-tiques, leur soutien, leur chats fluorescents imaginaires, leurs capac-ités de plomberie, de démolisseur ou pour leur amitié. Merci d’être là.
A ma famille et belle-famille bien aimées, merci d’avoir été d’un soutien sans faille et d’avoir si bien prétendu comprendre ce que je faisais dans la vie. Un soutien aveugle, la plus belle preuve d’amour ! Au zoo ! Nala, Wasabi, Sushi et Maki, merci d’avoir envahi mon bureau pendant mes longues heures de rédaction. Miette, merci pour la couverture chauffante, un délice ! Alpha, doggo des enfers, merci de t’être occupé de ma santé en débranchant mon ordinateur. Deux
fois.
Aux conditions extérieures d’être intervenues dans le dernier mois de rédaction ! Merci la foudre d’avoir brulé notre box et de m’avoir privée d’internet. Merci à nos eaux usées d’avoir insisté pour rencon-trer notre sous-sol. Puis notre jardin.
C O N T E N T S
I c o n c e p t s, state of the art and related work 1
1 a n i n t e r d i s c i p l i na r y p r o j e c t 3
2 s tat e o f t h e a r t 7
2.1 Molecular Imaging 7
2.2 MRI probes 9
2.2.1 Relaxation contrast agents 10
2.2.1.1 Transverse relaxation time agents 10
2.2.1.2 Longitudinal relaxation time agents 11
2.2.2 Chemical Exchange Saturation Transfer agents 12
2.2.3 Heteronuclear tracers 14
2.2.3.1 19F agents 14
2.2.3.2 Hyperpolarized probes 15
2.3 Optical probes 17
2.3.1 Endogenous contrast of tissues 17
2.3.2 Fluorochromes 18
2.3.3 Fluorescent proteins 18
2.3.4 Fluorescent quantum dots 20
2.3.5 Bioluminescence 20
2.4 Toward multimodal molecular imaging 21
3 s p i n-hyperpolarization 29
3.1 NMR Sensitivity 29
3.2 Main xenon hyperpolarization methods 31
3.2.1 Dissolution Dynamic Nuclear Polarization 31
3.2.2 Spin-Exchange Optical Pumping 33
3.2.3 Our recent contribution: optical pumping in a
van 37
3.3 Details of the xenon SEOP experiment 40
4 x e n o n b i o s e n s o r s 47
4.1 Xenon : a spy with multiple facets 47
4.2 Xenon carriers 50
4.2.1 Vectorized biosensors 52
4.2.2 Smart sensors 56
4.2.3 Strategies for water-soluble xenon carriers 59
4.3 A Fluorescence-129Xe NMR probe for biological inhi-bition of EGFR in Non-Small Cell Lung Cancer 61
4.3.1 Structure of the biosensor 61
4.3.2 129Xe NMR characterization 62
4.3.3 Biological activity asssays 64
4.3.4 129Xe NMR-based detection of the biosensor in cell samples 64
5 n m r s e q u e n c e s o p t i m i z e d f o r129x e n m r-based sen-s o r sen-s 75
5.1 Direct detection methods 75
5.1.1 1D Frequency-Selective excitation sequence 75
5.1.2 2D Frequency-selective excitation sequence 79
5.2 Indirect detection methods 80
5.2.1 Depolarization sequence 80
5.2.2 Ultrafast Z spectroscopy 83
5.3 Conclusions about direct and indirect - UFZ and depo-larization - methods 86
5.3.1 Discussion of the methods 86
5.3.2 Chemical Shift Imaging 89
II d e t e c t i o n o f r e c o m b i na n t p r o t e i n s 93
6 b i m o d a l s e n s o r 95
6.1 Objectives 96
6.2 NMR detection part 96
6.3 Fluorescence detection part 96
6.3.1 Small ligand : biarsenical dye 98
6.3.1.1 Bis-arsenical ligand variant 100
6.3.1.2 Carboxy-FlAsH : CrAsH 102
6.3.2 Peptidic target: tetracysteine tag sequences 104
6.3.2.1 Binding process 104
6.3.2.2 Optimized tetracysteine peptides 106
6.3.2.2.1 WEAAAREACCRECCARA . 106
6.3.2.2.2 FLNCCPGCCMEP . . . . 107
6.3.2.2.3 AREACCPGCCK . . . . 107
6.3.2.2.4 GCCGGSGNDAGGCCGG . . 107
6.4 Biosensor synthesis 108
7 in vitro dual detection of tetracysteine peptides 117
7.1 Experimental conditions 117
7.2 Study of various detection partners 118
7.2.1 Influence of the environment on the NMR re-sponse 118
7.2.2 "RE" tetracysteine-tag 121
7.2.2.1 Fluorescence experiments 121
7.2.2.2 Hyperpolarized129Xe NMR experiments 122
7.3 FLN-PG- and SlyD- tetracysteine tags 127
7.3.1 "PG" tetracysteine-tag 128
7.3.1.1 Hyperpolarized129Xe NMR experiments 128
7.3.1.2 Fluorescence experiments 130
7.4 Conclusion 131
8 in vitro dual detection of tetracysteine-tagged p r o t e i n s 135
8.1 Conception of a tagged-protein 135
c o n t e n t s xiii
8.1.2 Two strategies for the tagged-protein construc-tion 137
8.1.2.1 Fluorescent protein (D) - Biosensor (A) 138
8.1.2.2 Biosensor (D) - Fluorescent protein (A) 139
8.1.3 Direct consequences on the129Xe NMR and flu-orescence signals 140
8.2 Plasmid construction and purification 143
8.3 Proof of concept of the detection of recombinant pro-teins 146
8.3.1 Construction I 146
8.3.1.1 Fluorescence signal 146
8.3.1.2 129Xe NMR signal 150
8.3.2 Constructions II and III 150
8.3.2.1 Fluorescence signal 150 8.3.2.2 Hyperpolarized129Xe NMR signal 150 8.3.3 Constructions IV and V 151 8.3.3.1 Fluorescence signal 151 8.3.4 Hyperpolarized129Xe NMR experiments 154 8.4 Conclusion 155
9 i n-cell detection of tetracystein-tagged proteins 159
9.1 Internalization in bacteria 159
9.2 Protocol for eukaryotic cell uptake 161
9.2.1 Surface coating method 161
9.2.2 Optimization of conditions for cell uptake 163
9.2.3 Proof of cell uptake and quantification 165
9.3 129Xe NMR detection of the sensor inside the cells 170
9.4 Detection of the sensor inside cells expressing tetracys-teine tagged proteins 171
9.5 Conclusion 173
10 o u t l o o k a n d c o n c l u s i o n 177
III a p p e n d i x 185
a a p p e n d i x 187
a.1 Materials and Methods 187
a.1.1 Solvents and reagents 187
a.1.2 Organic synthesis 187 a.1.2.1 Compounds 11 and 12 187 a.1.2.2 Compounds 13 and 14 188 a.1.2.3 Compounds 15 and 16 188 a.1.2.4 Compounds 17 and 18 189 a.1.2.5 Compounds MM-1 and MM-2 190 a.1.2.6 Compound PP-1 192 a.1.3 DNA Sequencing 193 a.1.4 Buffers 195 a.1.5 Methods 196
a.1.5.2 Plasmid preparation 196
A.1.5.2.1 Standard protocol (mini-preparation)196
A.1.5.2.2 Endotoxin-free protocol (maxi-preparation) . . . 196
a.1.5.3 Plasmid cloning 197
a.1.5.4 Protein production and purification 198
a.1.5.5 Eukaryotic cell culture 199
a.1.5.6 Transient transfection of COS cells 199
a.1.5.7 Electrophoresis 200
a.1.5.8 Flow cytometry 200
a.1.5.9 Fluorescence microscopy 201
a.1.5.10 Fluorescence lifetime imaging 201
a.1.5.11 Evaluation of the biosensor quantity in-ternalized in the cells 202
L I S T O F F I G U R E S
Figure 1 Most popular medical imaging modalities and their main applications. 8
Figure 2 In vivo systemic persistent luminescent imag-ing of a mouse before (Bkg) and after intra-venous injection of nanoparticles which had been excited prior to injection and imaged at 2, 12, 20 and 60 minutes to excitation light. 8
Figure 3 Main classes of MRI constrast agents (in pur-ple and dark blue) and MRI tracers (in light blue). 10
Figure 4 Magnetic Resonance images of a rat head 6 days following transplantation of magnetically labeled rat fetal striatal tissue (one of the nu-clei in the subcortical basal ganglia of the fore-brain). The transplanted tissue was prior in-cubated with super-paramagnetic ferrite par-ticles coupled to wheat germ agglutinin. La-beled tissue was injected unilaterally into the striatum. The images represent adjacent coro-nal 2.5 mm thick sections through a rat head (from A to D). The brain appears as an area of relative high signal intensity in the dorsome-dial aspect of the images indicated by the open arrows in panels A and B. The transplanted tis-sue appears as an area of very low signal inten-sity indicated by an arrow in panel C. Adapted from [17]. 11
Figure 5 Illustration of the CEST mechanism showing the Boltzmann distribution of proton spins and the simulated NMR spectra for two chemically distinct pools of protons. Application of a fre-quency selective RF pulse causes saturation of the NMR signal, which is then transferred to the bulk water proton pool by chemical ex-change. 13
Figure 6 Temperature maps of a phantom containing a solution of paraCEST agent Eu(L)−. Tair on
images indicates the temperatures of the air flowing over the sample, while those reported by imaging are shown by the color bar in units of◦C. Adapted from [27]. 14
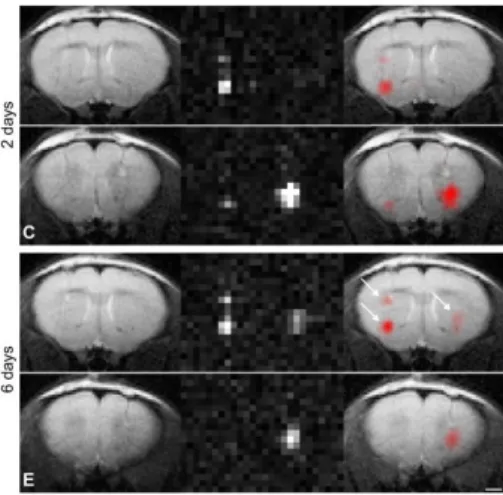
Figure 7 1H, 19F merged MR images of human neural
stem cells labeled with 19F (C) 2 days and (E) 6 days after implantation in the mouse stria-tum. The animal received two deposits of19
F-labeled cells in the left striatum and one de-posit in the right striatum. Reproduced from [30]. 15
Figure 9 Two hyperpolarized3He MR images of a healthy volunteer during inhalation (left) and breath hold (right). Adapted from [35]. 16
Figure 10 Main classes of optical imaging agents. 17
Figure 11 Fluorescence microscopy images of cells incu-bated with the macromolecular structure bear-ing multiple cyanine dyes. A A phase contract image. B immediately after injection of the ac-tivatable fluorochrome, no fluorescence signal is observed. C After 15 min of incubation, the probe is internalized and degraded resulting in a fluorescent signal. D Light (left) and near infrared range fluorescence (right) images these same tumor cells implanted into mammary fat pad of a mouse. Adapted from [39]. 19
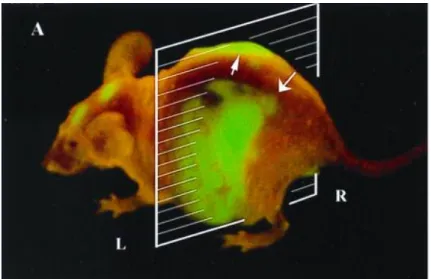
Figure 12 Lateral whole-body image of metastatic liver lesions of a GFP-expressing human colon can-cer in the left (thick arrow) and right lobes (fine arrow) of a live nude mouse at day 21 after sur-gical orthotopic transplantation. Adapted from [41]. 20
Figure 13 . Dependence on magnetic field strength B0 of
the separation of nuclear energy levels (∆ E) for spin I= 1/2 and the relative populations of the energy levels assuming one has approxi-mately ten million protons in the sample. 30
Figure 14 . Zeeman energy levels of an electron-nucleus system presenting the Electron Spin Resonance (ESR) transitions, Nuclear Magnetic Resonance (NMR) transitions and flip-flop transitions. 31
Figure 15 . In a dynamic nuclear polarization experiment, MR-active nuclei (here 13C) are mixed with
a low concentration of unpaired electrons in a glass matrix. The sample is then irradiated with high-power microwaves at the electron res-onance frequency in a high magnetic field (≈ 3 T) and at low temperatures (≈ 1 K). This enables13C hyperpolarization via polarization
c o n t e n t s xvii
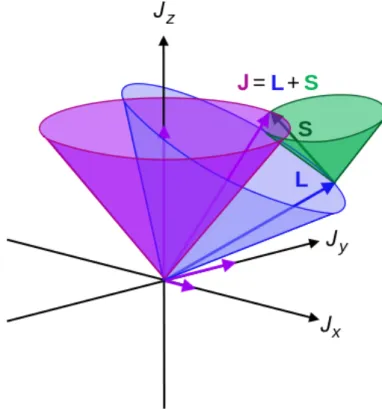
Figure 16 Scheme of orbital and spin angular momenta and the spin-orbit coupling J. 34
Figure 17 Spin-Exchange Optical Pumping setup requires an optical cell containing a noble gas - xenon -, buffer gases (N2 and He), and a small quantity
of vaporized alkali metal (typically Rb). Nu-clei are irradiated by a laser light (795 nm for Rb D1 transition). Photons fully circularly
po-larized (∆mj = +1) are absorbed. Since angular
momentum is conserved, this leads to an ab-sorption from one of two Rb ground electronic (mj = -1/2) states. After collisions with gas
atoms, the ground states are repopulated at ef-fectively equal rates. However, since only one ground state is depleted by the laser, ground-state population accumulates on the other mJ
= 1/2 state, leaving the Rb electronically spin-polarized. A weak magnetic field along the di-rection of laser propagation (drawn in green) enables the degeneracy of the spin levels. Gas-phase collisions then allow spin exchange be-tween the polarized Rb electron spins and the noble gas nuclear spins. 35
Figure 18 129Xe NMR spectrum (in blue) obtained after
15 hours of acquisition and exhibiting a polar-ization of 10−5. Hyperpolarized 129Xe NMR spectrum (in red) obtained after only 1 s of ac-quisition. Polarization has been enhanced by more than 5 orders of magnitude. 36
Figure 19 Production of laser-polarized xenon. Top: Pho-tograph of our SEOP setup; bottom: schematic drawing. BE: beam expander; BS: beam split-ter; λ/4: quarterwave plates; PW: powermeter. B: magnetic field (100 G) colinear to the light
beam. 37
Figure 20 Drawing of the SEOP setup, side and front views. For explanation of the indicated numbers, see the main text. 38
Figure 21 Photograph of the chariot that enables us to transport the hyperpolarized xenon toward the magnet. 42
Figure 22 Photograph of the glass bridge permitting the hyperpolarized xenon transfer from the glass coil to the NMR tube. 42
Figure 23 A.129Xe (upper and lower row) and3He
(mid-dle row) imaging of healthy human lungs, hy-perpolarized gas distributed uniformly through-out the ventilated airspaces of the lung. B.129Xe
imaging of diseased human lung with asthma (upper row), Chronic Obstructive Pulmonary Disease (middle row) and cystic fibrosis (lower row). C.129Xe exchange between lung airspaces and tissue. Reproduced from [2]. 48
Figure 24 Principle of the 129Xe NMR-based biosensing
approach. 50
Figure 25 Carriers encapsulating hyperpolarized xenon and targeting analytes of interest leading to density-based and smart sensors. 51
Figure 26 Generic structure of the cryptophane cores. 52
Figure 27 Structure of the first biosensor molecule de-signed to bind xenon to a protein with high affinity and specificity. Below, the 129Xe NMR
spectrum shows the binding of the biosensor to avidin, thanks to the biotin moiety attached on the host molecule. Adapted from [24]. 53
Figure 28 Structure of the molecular relay consisting in a two-faced guest that is a xenon binding com-petitor. Reproduced from [28]. 54
Figure 29 Modular construction of a sensor based on avidin-conjugated antibody and a set of biotin-avidin-conjugated read-out moieties for dual - NMR and fluo-rescence - functionality. CrA: Cryptophane-A. Adapted from [32]. 55
Figure 30 Time evolution of the 129Xe NMR spectrum
(high-field region) of xenon caged in a biosen-sor let in the presence of oxygenated water. Each arylboronate group transformed into phe-nol group by action of H2O2 leads to a high
field shift variation of the Xe@cage signal by ca. 10 ppm. Such an effect has been under-stood thanks to DFT calculation including rela-tivistic terms for the interaction. Adapted from [41]. 57
Figure 31 Approach combining the use of hyperpolar-ized 129Xe NMR of a cage-molecule function-alized by a ligand able to chelate different cations, showing simultaneous detection of lead, zinc, and cadmium ions at nanomolar concentration. Reproduced from [38]. 58
c o n t e n t s xix
Figure 32 Molecular relay produces an 129Xe NMR
sig-nal upon asig-nalyte detection. Reproduced from [48]. 59
Figure 33 Structure of the permetalated water-soluble crytophane-111and its peculiar129Xe NMR chemical shift.
Reproduced from [10]. 60
Figure 34 Generic structure of the new molecular plat-form : a cryptophane with two different reac-tion sites. Reproduced from [49]. 60
Figure 35 Synthesis and generic structure of the bimodal fluorescence-129Xe NMR biosensor. 62
Figure 36 Direct (A.) and indirect (B.) 129Xe NMR
de-tection of biosensor before multigrafting (inter-mediateI) in PBS at 11.7 T. A. spectrum recorded in 1 scan for a 46 µM solution. B. ultra-fast Z spectroscopy on the same sample. In this last experiment, for one scan (in red) CW satura-tion is applied at an offset ∆ν of -18 kHz from the main xenon signal with a rf strength B1 of
20µT for 4 s. For the second scan (in blue), no rf saturation is applied. 63
Figure 37 Hyperpolarized 129Xe NMR spectrum of IIat 3µM in PBS obtained in one scan. Insert: sub-spectrum obtained by 64 fast repetitions of the sequence soft 90deg - Gaussian pulse centered at 60 ppm - acquisition (inter-scan delay: 93
ms). 63
Figure 38 A.Flow cytometry experiments on HCC827 cells and B. A549 cells incubated with bimodal biosen-sor, and C. immunofluorescence experiments
Figure 39 129Xe NMR spectra obtained with selective
ex-citation at the expected Xe@biosensor frequency (at ca. 70 ppm, i. e. 130 ppm upfield from the dissolved xenon signal), at 308 K. For these experiments the same experimental conditions were used both for HCC827 cells (green) and A549 cells (red): 80 million cells were incubated at 310 K during 2 hours with IIat 25 µg/mL. After centrifugation the supernatant was sep-arated from the cell clot (bottom spectra). The cells were washed two times in phosphate buffer saline (PBS, pH 7.4) and re-suspended in 600 µL of PBS and 50 µL of D2O (top spectra). The
NMR subspectra shown were obtained with a succession of sequences (frequency-selective Gaussian 90deg pulse - acquisition) with an inter-scan delay of 93 ms. 66
Figure 40 HyperCEST depolarization curves for (A) biosen-sor in HCC827 cells, (B) biosenbiosen-sor in A549 cells. Filled symbols: on-resonance saturation, empty symbols: off-resonance saturation. In (C), Z-spectrum obtained for the sample ofb biosen-sor in HCC827 cells (the abscissa indicates the frequency offset from the free xenon signal). 66
Figure 41 Frequency-selective rf pulse sequence used for the direct detection of encapsulated xenon in its cage (with n the number of times the se-quence is repeated). 76
Figure 42 Comparison between 129Xe NMR spectra ob-tained with a fast succession of soft pulses (in red) and a simulation of the exchange effect (in blue) of a sample containing a mixture of four different cryptophanes, differing by the length of their linkers: AM, 223M, 233M,
Cr-EM. 77
Figure 43 Comparison between 129Xe NMR spectra
ob-tained with a fast succession of soft pulses (in red) and a simulation in the absence of xenon exchange (in green) of the same mixture of 4 cryptophanes. 78
Figure 44 Comparison between two simulations of the exchange effect without (in red) and with higher weighting coefficient for the FIDs arriving last
c o n t e n t s xxi
Figure 45 2D129Xe NMR spectrum obtained with selec-tive excitation at the expected Xe@biosensor frequency of a solution of 1.1 µM of Cr-AM at 293 K. 1D spectra correspond to the sum of the first 51 or 128 scans of the 2D experiments. Signal to noise ratios of each condition are in-dicated. 79
Figure 46 A. The 129Xe NMR spectrum of a 50 µM so-lution of cryptophane displays a weak reso-nance from encapsulated xenon at δ3 corre-sponding to Xe@biosensor. Chemical exchange with free Xe outside the cage (resonance δ1)
enables sensitivity enhancement by depolariz-ing the δ3 nuclei and detecting at δ1 B. Se-lective saturation of Xe@biosensor (green) and chemical exchange with the free xenon (blue) allows accumulation of depolarized nuclei (red). This corresponds to the continuous depolar-ization of caged-related magnetdepolar-ization that can be measured indirectly after several cycles by the difference between initial and final bulk magnetization. Adapted from [4]. 81
Figure 47 129Xe HyperCEST depolarization sequence: pulse sequence providing a 2D matrix with each row corresponding to a saturation time tsat. 81
Figure 48 129Xe HyperCEST depolarization curves: Ex-ample of pulse sequence (providing a 2D ma-trix with each row corresponding to a satura-tion time tsat) and plots of the xenon magneti-zation as a function of tsat off-resonance (pale
blue) and on-resonance (dark blue). Consecu-tive data points are separated by 0.5 s; satu-ration: repetition of 100 D-SNOB pulses, max. saturation field strength of 12 µT. The sample was a xenon biosensor at 478 µM in PBS. 82
Figure 49 129Xe Ultra-Fast Z-spectroscopy used pulse
se-quence. Both arrows indicate offset changes, from the Xe@biosesnsor region (O1) to the free xenon signal (O10). A field gradient is applied during saturation (enabling saturation of a slice in the sample) and, after the rf read pulse, an-other field gradient is applied during detection (giving the profile of the sample). The dashed part is optional, but enables the recording of several successive FIDs with only one excita-tion thanks to a multiple spin echo. Reproduced from [9]. 83
Figure 50 Z-spectrum revealing the presence of crypto-phane Cr-A (200 µM) into pulmonary A549 cells (green) is extracted in only two scans : a reference with no saturation Soff (blue) and
an on-resonance saturation Son(red). 84
Figure 51 UFZ-spectrum of a mixture of four cryptophanes (745 nM) in PBS obtained with Bsat = 12 µT
during tsat = 6 s. 85
Figure 52 A129Xe direct detection spectrum showing two
Xe@biosensors signals separated by ∆ν = 1.3 ppm. B Ultra-Fast Z-spectra of the same mix-ture acquired with an acquisition gradient of 16 G.cm−1 and a saturation gradient varying from 0.6 to 6 G.cm−1. The apparent frequency separation between both Xe@biosensors dips is ∆νGacq/Gsat. These spectra were obtained
using Bsat = 12 µT and tsat = 6 s. 85
Figure 53 Comparison between principles, spectra and saturated region of the NMR tube with direct and indirect - UFZ or depolarization - detec-tion methods. 86
Figure 54 Kickout mechanism for the in-out xenon ex-change. 89
Figure 55 Hyperpolarized129Xe CSI experiment. The
sam-ple was an aqueous mixture of two crypto-phanes at 100 µM in an 8 mm-o.d. NMR tube. The axial imaging is divided in 32x32 points in the spatial dimensions (experiment time 1 min 40s). 90
Figure 56 Structure of the bimodal biosensor. 95
Figure 57 Doubly responsive probe for recombinant pro-tein detection. 97
Figure 58 Synthesis of water-soluble cryptophane-AM
c o n t e n t s xxiii
Figure 59 Three constitutional isomers of cryptophane. 98
Figure 60 Comparison between GFP and FlAsH sizes. On this scheme, the fluorescent protein features the protein of interest. 99
Figure 61 A. Schematic representation of cell surface re-ceptor constructions, modified as indicated ei-ther at the C-terminus, or at the third intracel-lular loop. B. Confocal microscopy images of the three receptor constructions transiently ex-pressed in Hela cells and labeled with FlAsH. Top row shows CFP fluorescence whereas bot-tom row shows FlAsH fluorescence. Cells ex-pressing constructs containing the FlAsH bind-ing motif (center and right) show a strong yel-low fluorescence at the cell surface. C. FRET between CFP and FlAsH in cell constructions. Adapted from [12]. 101
Figure 62 Biarsenical dyes and their fluorescence emis-sion wavelength. 102
Figure 63 4-steps synthesis of 5- and 6-carboxyFlAsH or CrAsH, the small ligand. 103
Figure 64 Interaction between a trivalent arsenic atom and a dithiol leading to a 5-bond ring. Reproduced from [22]. 104
Figure 65 Reversible complexation of biarsenical dye on a tetracysteine motif in the presence of an ex-cess of EDT. 105
Figure 66 Two complexing pathways of biarsenical probe towards tetracysteine motif. 106
Figure 67 Structure calculation of the peptide bound to ReAsH, based on NOESY-derived distance con-straints. Reproduced from [25]. 107
Figure 68 Synthesis of CrAsH linked to etylene diamine : compounds 17 and 18. 109
Figure 69 Coupling reaction between Cr-AM and com-pounds 17 and 18: synthesis of the bimodal biosensors 21 and 22. 109
Figure 70 Structure of four different bimodal sensors 110
Figure 71 Comparison of the fluorescence spectra (exci-tation wavelength at 480 nm) of the CrAsH moiety (green) and MM-1 (blue). 111
Figure 72 A Photograph of the "NMR-tuve". B Fluores-cence spectra of MM-1 (2.5 µM) with (red) and without (blue) xenon. 111
Figure 73 Triscarboxyethylphosphine (TCEP) structure. 117
Figure 75 1,2-Ethanedithiol structure. 118
Figure 76 One-scan 129Xe NMR spectra of A. MM-1 in blue at 25 µM, B. MM-2 in red at 15 µM, C. PP-1 at 8 µM in the absence of peptide and D. Hexacarboxylate Cryptophane-A : Cr-AM at 30 µM). 119
Figure 77 129Xe NMR spectra of xenon in A. MM-1 bound
to different target peptides : flexible strand (AREAC-CPGCCK), β-hairpin (GCCGGSGNDAGGCCGG) and α-helix peptide (WEAAAREACCRECCARA). Yellow balls represent cystein residues. B. MM-1and MM-2 bound to the same target peptide. The only difference between these two struc-tures is that cryptophane is grafted to the C5
or C6 of the CrAsH moiety. C. MM-1 and
PP-1bound to the same target peptide. These two biosensors have been synthesized from the two enantiomeric forms of the cryptophane. 120
Figure 78 A. 0.1 to 10 equivalents of WEAAAREACCREC-CARA peptide (from the brightest to the dark-est blue color) were added to 10 µM MM-1 and illuminated at 480 nm in biotek Syner-gyH1 Multi-Mode Plate Reader. Maxima of flu-orescence intensity between λem= 505 nm and
λem = 650 nm were monitored at 37◦C for 90
minutes after 30 seconds of mechanical shak-ing in a 96-well plate. B. Saturation bindshak-ing curve : Fluorescence intensity maxima at the end of the experiment (90 minutes) plotted against concentration of peptide. A non linear fit of specific binding was applied following the equa-tion Y = BmaxX
(Kd app+X) with Bmax the maximum specific binding, Kd app the equilibrium
bind-ing constant. This fit was obtained with a cor-relation coefficient of 0.9945. 122
Figure 79 One-scan 129Xe NMR spectrum of a racemic mixture of MM-1 and PP-1 (25 µM) in phos-phate buffer, after a 90◦impulsion sequence. Insert: sub-spectra obtained by 64 fast repeti-tions of the sequence soft 90◦Gaussian pulse centered at 67 ppm and acquisition (inter-scan delay: 47 ms) without (blue) and with 10 equiv-alents of "RE" tetracysteine-tag (red). 123
c o n t e n t s xxv
Figure 80 One-scan 129Xe NMR spectrum of MM-1 (25
µM) in phosphate buffer, after a 90◦readout pulse sequence. Blue box: sub-spectra obtained by 64 fast repetitions of the sequence soft 90◦Gaussian pulse centered at 67 ppm and acquisition (inter-scan delay: 47 ms) of MM-1 without (black) and with 10 equivalents of "RE" tetracysteine-tag (green). 124
Figure 81 Sub-spectra obtained by 64 fast repetitions of the sequence soft 90◦Gaussian pulse centered at 67 ppm and acquisition (inter-scan delay: 47 ms) of MM-1 without (black) and with 0.5 (or-ange), 1 (blue) and 10 (green) equivalents of "RE" tetracysteine-tag. 125
Figure 82 One-scan 129Xe NMR spectrum of MM-2 15
µM) in phosphate buffer, after a 90◦impulsion sequence. Blue box exhibits selective spectra of MM-2without (black) and with 10 equivalents of "RE" tetracysteine-tag (green). 126
Figure 83 129Xe NMR spectra of a racemic mixture of MM-1and PP-1 (25 µM) with 10 equivalents of SlyD peptide (upper spectrum) and 10 equiva-lents of an other FLN-PG peptide (lower spec-trum). 127
Figure 84 One-scan 129Xe NMR spectrum of MM-1 (8 µM) in phosphate buffer, after a 90◦impulsion sequence. Blue box: sub-spectra obtained by 64 fast repetitions of the sequence soft 90◦Gaussian pulse centered at 67 ppm and acquisition (inter-scan delay: 93 ms) of MM-1 without (black) and with 10 equivalents of "PG" tetracysteine-tag (green) 128
Figure 85 One-scan129Xe NMR spectrum of PP-1 (8 µM)
in phosphate buffer, after a 90◦impulsion se-quence. Blue box: sub-spectra obtained by 32 fast repetitions of the sequence soft 90◦Gaussian pulse centered at 67 ppm and acquisition (inter-scan delay: 93 ms) of PP-1 without (black) and with 10 equivalents of "PG" tetracysteine-tag (green). 129
Figure 86 A. 0.1 to 10 equivalents of AREACCPGCCK peptide (from the brightest to the darkest blue color) were added to 10 µM PP-1 and illumi-nated at 480 nm. The fluorescence intensity max-ima were monitored and reported at 37◦C for 90minutes after 30 seconds of mechanical shak-ing in a 96-well plate between λem = 510 nm
and λem= 650 nm. B. Saturation binding
spec-trum : Fluorescence intensity maxima at the end of the experiment (90 minutes) plotted against concentration of peptide. The same non linear specific binding fit was employed here with a correlation coefficient of 0.9989. C. Evolution of the emission wavelength of normalized fluo-rescence spectra under addition of equivalents of peptide. D. Relation between the wavelength of the maximum fluorescence emission the and proportion of bound biosensors. 130
Figure 87 A.Construction I with the tetracysteine tag at the C-term of Aquamarine. B. Construction II with the tetracysteine tag at the N- term of Aquamarine. C. Construction III with the tetra-cysteine tag at the N-term of the Aquamarine separated by a 17-aminoacid spacer. 137
Figure 88 Normalized absorption (dotted lines) and emis-sion spectra (solid lines) of Histag-Aquamarine-tetracysteine tag (in cyan) and PP1 (in green). This system is excited at λ = 405 nm, which corresponds to the half-maximum of fluores-cent protein absorption. Overlap between donor emission and acceptor absorption is drawn in pale red. 138
Figure 89 A. Construction IV with the tetracysteine tag at the NH2 terminal part of mCherry. B.
Con-struction V with the tetracysteine tag at the NH2 terminal part of mCherry separated by
17aminoacids. 139
Figure 90 Normalized absorption (dotted lines) and emis-sion spectra (solid lines) of Histag-Tetracysteine tag-mCherry (in red) and PP1 (in green). This system is excited at λ = 480 nm, which cor-responds to the half-maximum of fluorescent protein absorption. Overlap between donor emis-sion and acceptor absorption is drawn in pale red. 140
c o n t e n t s xxvii
Figure 91 Principle of the functioning of the biosensor with construction I (Histag-Aquamarine-TC). A.Free PP-1 gives rise to the original encapsu-lated xenon chemical shift and a very low fluo-rescence. B. PP-1 bound to TC-tag of construc-tion I gives rise to a chemical shift variaton for encapsulated xenon and a fluorescence in-crease. B’. The same molecular construct gives rise to Förster Resonance Energy Transfer from the fluorescent protein to PP-1, diminishing the fluorescence signal and lifetime of the protein and increasing the fluorescence of PP-1. 141
Figure 92 UV-Vis absorption spectrum of A. Histag-Aquamarine-tetracysteine tag (in black) with a maximum
absorbance at 430 nm. C. Histag-tetracysteine tag-Aquamarine (in purple) and Histag-tetracysteine tag-Linker-Aquamarine (in black). The orange dotted line represents the shape of the UV-Vis absorption spectrum of the native Aqua-marine, serving as a reference for the double band. D. Histag-tetracysteine tag-mCherry (in yellow) and Histag-tetracysteine tag-Linker-mCherry (in black). The maximum absorbance is at 560 nm. The green dotted line represents the UV-Vis absorption spectrum of the native mCherry. B. Polyacrilamide gel electrophoresis of both TC-tagged Aquamarine and Aquamarine, the first column being the molecular weight marker.
144
Figure 93 A280
A430 or
A280
A560 ratios and structure modification of the five constructions compared to the two references Histag-Aqua and Histag-mCherry.
Figure 94 A.Fluorescence emission spectra of 0 to 5 equiv-alents of PP-1 (from the darkest to the bright-est green color) added to a 2µM Aquamarine-tetracysteine tag solution after illumination at 405 nm. The orange curve corresponds to the fluorescence emission of PP-1 bound to 5 equiv-alents of model "PG" peptide illuminated by a 405 nm light. The red box focuses on the de-crease of fluorescence intensity of the donor. B. Normalized fluorescence emission spectra at 405 nm, showing two modified regions. The blue box focuses on the increase of fluores-cence intensity of the acceptor. The yellow box highlights the modification of the fluorescence spectrum of the donor. C. Normalized fluores-cence emission spectra of samples containing 0.5 to 5 equivalents of PP-1 illuminated with a 480nm source. The orange and purple curves are used as a reference of free PP-1 and PP-1 bound to 5 equivalents of model "PG" peptide.
147
Figure 95 A.Mean fluorescence lifetimes of 0 to 5 equiv-alents of PP-1 added to a 2µM Aquamarine-tetracysteine tag solution after illumination at 450nm. B. Proportion of bound fluorescent pro-teins (αshort), after analysis of the
biexponen-tial decay functions. 149
Figure 96 129Xe NMR selective spectra of free PP-1 (2µM) and bound to 10 equivalents of Aquamarine-tetracysteine tag. 150
Figure 97 129Xe NMR sub-spectra of free xenon in PP-1 (2µM) and bound to 2 equivalents of tetracys-teine tag-Aquamarine and tetracystetracys-teine tag-linker-Aquamarine. Sub-spectra obtained by 2D Frequency-selective excitation sequence, when adding the 30first scans. 151
c o n t e n t s xxix
Figure 98 A.Fluorescence emission spectra of 0 to 5 equiv-alents of Histag-Tetracysteine tag-mCherry (from the darkest to the brightest green color) added to a 2µM PP-1 solution after illumination at 480nm. Spectra have been corrected by the flu-orescence emission of construction IV directly illuminated by the 480 nm light and displayed in red dotted line (contribution of 1%). B. Nor-malized fluorescence emission spectra at 480 nm demonstrating a FRET transfer from the biosensor to the tagged-protein. C. Normalized fluorescence emission spectra of samples con-taining 0 to 5 equivalents of Histag-Tetracysteine tag-mCherry illuminated with a 480 nm source, showing the spectral shift of the emission spec-trum upon binding. 152
Figure 99 129Xe NMR spectra of free PP-1 (2µM) and bound to 4 equivalents of Histag-Tetracysteine tag-mCherry. Spectra were obtained with a frequency-selective excitation sequence (2D) with an half-gaussian pulse. 154
Figure 100 Reduction of a -SS- bond by DTT. 159
Figure 101 Fluorescence microscopy of DH5α cells incu-bated with 26 µM of racemic biosensor for 2 hours, A. rinsed in PBS, B. treated with DTT reagent, C. electroporated and then treated with DTT. D. Fluorescence spectra of the biosensor in the three conditions, illuminated at λex =
470 nm and observed between λem = 490 nm and λem= 570 nm. The spectrum of
electropo-rated bacteria is used as a blank. The red and blue areas enlighten maximum of fluorescence emission: 518 nm for incubated biosensor, 534 nm for incubated biosensor in electroporated bacteria. 160
Figure 102 A.Fluorescence emission spectra of 30.000 COS7-cells incubated 1 hour with 10 µM of racemic biosensor with or without protein corona (via FBS). Spectra were recorded after an excitation at λexc = 480 nm using a plate reader. B.
Flu-orescence microscopy images of COS7-cells in-cubated with 10 µM of biosensor and 30% FBS and illuminated via the biosensor filter cube during texp = 2 s. 162
Figure 103 Influence of the incubation time and biosen-sor concentration on incubated quantities. The cells were incubated for 15, 45, 75 and 115 min-utes with 0.47, 2.8, 24 and 55µM of racemic biosensor. After being rinsed 3 times with PBS, fluorescence microscopy images of the cells in PBS were recorded with the biosensor filter cube. A region of interest (ROI) of the size of a cell was chosen and mean fluorescence intensities of 10 cells in 10 different fields of view were measured using a routine in ImageJ software. The mean values for each sample are reported here, as well as the standard deviation. 163
Figure 104 A. and B.Influence of EDT and β-mercaptoethanol concentration and cell condition -adhered or suspended - on the cell uptake of the racemic biosensor at 1 mM of TCEP. Cells in sample E,F and G were prior detached from the sur-face with 200µL of trypsin, a protease that hy-drolyses proteins. They are centrifuged, resus-pended into DMEM (30% FBS) and incubated with biosensor for 1 hour at 37◦C. After be-ing rinsed 3 times with PBS, fluorescence mi-croscopy images of the cells in PBS with dif-ferent concentration of β-mercaptoethanol and EDT were recorded. A region of interest (ROI) of the size of a cell was chosen and mean flu-orescence intensity of 10 cells in 10 fields of view was measured using a routine in ImageJ software. The mean value for each sample is reported here, as well as the standard devia-tion. C. Transmission microscopy image of cells in U conditions. D. Fluorescence microscopy images of the same cells. 164
Figure 105 Confocal images of COS7-cells incubated for 1 hour at 37◦C with 140 µM of biosensor, reduc-ing mixture and DMEM (30% FBS). After after being rinsed 2 times with PBS, cells were illu-minated with a laser at 488 nm and detected between 500 and 550 nm and imaged in PBS. 36 slices corresponding to 36 different depths (z = 130 nm) of the cells are displayed as well as the projection of the fluorescence and the mean fluorescence of each depth. 166
c o n t e n t s xxxi
Figure 106 Flow cytometry experiments (Gain = 280) of suspended COS7-cells incubated for 1 hour at 37◦C with 100 µM of β-mercaptoethanol, 1 mM of TCEP, 500 µM of EDT, DMEM (30% FBS) and A. 70 µM of racemic biosensor, B. without biosensor. Fluorescence microscopy images us-ing an YFP filter cube of C. suspended cells incubated with racemic biosensor and D. sus-pended cells as a reference. The yellow lane corresponds to the intensity profile of a cell in-cubated E. with biosensor and F. without biosen-sor. 168
Figure 107 A.The fluorescence emission spectrum of cells incubated with 70 µM of the racemic biosen-sor. B. The maximum fluorescence intensities (gain = 90) of four dilutions - 0.06, 0.18, 0.36 and 0.72 µM - of racemic biosensor. The lin-ear regression fit indicates a slope α = 7972 µM−1. 169
Figure 108 Z-spectra of A. the supernatant containing 140 µM of PP-1 and B. cells incubated with 140 µM of PP-1. Data were fitted with a Lorentzian curve using OriginPro software. Both experi-ments were performed with these parameters: Consecutive data points are separated by 0.5 s; saturation: repetition of 100 D-SNOB pulses, max. saturation field strength of 12 µT. 170
Figure 109 Fluorescence microscopy images of PP-1 incu-bated on cells expressing A. TC-tagged Aqua-marine (AquaAqua-marine excitation), B. TC-tagged Aquamarine (biosensor excitation), C. Aqua-marine and D. TC-tagged AquaAqua-marine with an excess of EDT. The chart displays mean fluo-rescence intensities measured in a ROI in 40 cells. 172
Figure 110 Photographs of: A. the van transporting the hyperpolarization setup. B. Hyperpolarization setup in the van. 179
Figure 111 A.TRUE-FISP Coronal encoding images of hy-perpolarized 129Xe in the lungs of a mouse. FOV 5 x 3 cm; Slice 3 cm; 64 x 64, only 2D-FFT, TE = 1.3 ms, TR = 2.6 ms and 0.5 s per image. B. 0.15 mmol of Cr-AM were instilled into the lungs and 90◦ Gaussian pulses of 800 µs cen-tered at 60ppm were implemented with TR = 73.5 ms, NS = 2 and TD1 = 512. 180
Figure 112 HPLC purification and MS analysis of com-pounds 11 and 12. 188
Figure 113 HPLC purification and MS analysis of com-pounds 15 and 16. 189
Figure 114 HPLC purification and MS analysis of com-pounds 17, 18, 19 and 20. 190
Figure 115 Purity check of MM-1 on Luna PFP. Gradient H2O/AcCN 95:5 to 30:70. 191
Figure 116 Purity check of MM-2 on Luna PFP. Gradient H2O/AcCN 95:5 to 30:70. 192
Figure 117 Purity check of PP-1 on Luna PFP. Gradient H2O/AcCN 95:5 to 30:70. 192
Figure 118 DNA sequencing of construction I. 193
Figure 119 DNA sequencing of construction II. 193
Figure 120 DNA sequencing of construction III. 194
Figure 121 DNA sequencing of construction IV. 194
Figure 122 DNA sequencing of construction V. 195
Figure 123 A Designed sequence of the insert coding for tetracystein core, fused at the end of the Aqua-marine sequence with NdeI restriction site. B Map of the designed vector coding for Aqua-marine fused to Histag in NH2-terminal part
L I S T O F TA B L E S
Table 1 Performance of different imaging techniques for in vivo detection. 7
BE Beam Expander
BS Beam Splitter
CB Cucurbituril
CEST Chemical Exchange Saturation Transfer CFP Cyan Fluorescent Protein
COS CV-1 in Origin with SV40 genes
Cr-A Cryptophane-222
Cr-AM Hexacarboxylate Cryptophane-222
Cr-EM Hexacarboxylate Cryptophane-333
CSI Chemical Shift Imaging
CT Computed Tomography
CTV Cyclotriveratrylene
CW Continuous wave
DFT Density Functional Theory
DIEA N, N-diisopropylethylamine
DMEM Dulbecco’s Modified Eagle Medium
DMSO Dimethyl sulfoxide
DNA Deoxyribonucleic Acid
DNP Dynamic Nuclear Polarization
DTT Dithiothreitol
ECFP Enhanced Cyan Fluorescent Protein
EDCI 1-ethyl-3-[3-(dimethylamino)propyl]carbodiimide
EDT Ethane Dithiol
EDTA Ethylenediaminetetraacetic Acid
EGF Epidermal Growth Factor
a c r o n y m s xxxv
ESR Electron Spin Resonance
FACS Fluorescence-Activated Cell Sorting
FBS Fetal Bovine Serum
FDA Food and Drug Administration
FID Free Induction Decay
FLIM Fluorescence-Lifetime Imaging Microscopy FP Fluorescent Protein
FRET Förster Resonance Energy Transfer
FWHM Full Width at Half Maximum
GFP Green Fluorescent Protein
HPLC High-performance Liquid Chromatography
HyperCEST Hyperpolarized129Xe Chemical Exchange Saturation
Transfer
IPTG Isopropyl β-D-1-thiogalactopyranoside
LCMS Liquid Chromatography–Mass Spectrometry
nsLTP Nonspecific Lipid Transfer Protein
MHC Major Histocompatibility Complex
MRI Magnetic Resonance Imaging NHS N-Hydroxysuccinimide
NMDA N-methyl-D-aspartate
NMR Nuclear Magnetic Resonance
NOESY Nuclear Overhauser Effect Spectroscopyy
NSCLC Non-Small Cell Lung Cancer NTA Nitrilotriacetic Acid
OP Optical Pumping
ParaCEST Paramagnetic Chemical Exchange Saturation Transfer
PBS Phosphate buffered saline PET Positron Emission Tomography
PRESS Point-RESolved Spectroscopy PW Powermeter
QY Quantum Yield
RF Radio Frequency
ROI Region Of Interest
SAR Specific Absorption Rate SDS Sodium Dodecyl Sulfate
SEOP Spin-Exchange Optical Pumping
SPECT Single-photon emission computed tomography
SPINOE Spin Polarization-Induced Nuclear Overhauser Effect
SPIO Superparamagnetic Iron Oxide
STEAM STimulated Echo Acquisition Mode
TC Tetra Cysteine
TCEP Tris(2-carboxyethyl)phosphine
TE Echo Time TR Repetition Time
tf-MION Transferrin and Monocrystalline Iron Oxide
UFZ UltraFast Z-Spectroscopy
UV UltraViolet
Part I
C O N C E P T S , S TAT E O F T H E A R T A N D R E L AT E D W O R K
This first part introduces all the basic knowledges required to appreciate the work gathered in this thesis. The first chapter serves as an introduction to the whole manuscript. Chapter 2 is a brief introduction to the general framework of molecular imaging techniques. Chapter 3 describes the NMR imaging technique and one of its improvement: the NMR of hyperpolarized gases. Chapter 4 focuses on the process required to conduct molecular imaging studies with hyperpolarized gases. Finally chapter 5 presents NMR sequences adapted to hyperpolarized gases in exchange.
1
A N I N T E R D I S C I P L I N A R Y P R O J E C T
This project is an interdisciplinary work that unites three recognized teams for research and innovation. Bringing physicists, chemists and biologists together leads to a thoughtful and comprehensive project.
The latter comes within medical approach, well upstream of diagno- Collaboration between Laboratoire Structure et Dynamique par Résonance Magnétique at CEA Saclay, Service de Chimie Bioorganique et de Marquage at CEA Saclay and Laboratoire Chimie Physique at Orsay. These laboratories now belong to University Paris-Saclay.
sis and therapy. Long before curing a pathology, we need to fully understand molecular processes that occur. In most cases, these in-tracellular mechanisms are monitored by fluorescence labels such as fluorescent proteins[1]. Unfortunately, such an heavy construct does
not allow molecular level information and might induce biased mea-surements.
The very ambitious goal of this project is to enable the tracking of in cellulo mechanisms by combination of the properties of fluorescence imaging with those of another advanced imaging technique, nuclear magnetic resonance (NMR). This approach will not only highly pre-cisely locate protein of interest but also bring a structural resolution for comprehension of unknown biological processes at the molecular level. Its uniqueness is its combination between the latest technical ad-vances in NMR and fluorescent labeling. NMR suffers from a very low intrinsic detection sensitivity due to the low energies involved. The use of xenon is of increasing interest for sensitive MRI, owing to its large nuclear spin hyperpolarization afforded by optical pumping[2]
that enhances the NMR signal by several orders of magnitude. The biosensor that is conceived in this project consists in two moieties:
• a cage-molecule that reversibly encapsulates xenon
• a small fluorogenic ligand that is activated after complexation with its target[3]
This target is a 6-amino-acid motif easily incorporated into the se-quence of the protein of interest.
This molecular association enables simultaneous acquisition of very specific NMR and fluorescence signals upon detection of the targeted protein. Thus, the doubly responsive probe combines all character-istics of the two imaging techniques, allowing sensitive detection and longitudinal follow-up of the intracellular mechanism of interest.
B I B L I O G R A P H Y
[1] Osamu Shimomura, Frank H. Johnson, and Yo Saiga. Extraction, purification and properties of aequorin, a bioluminescent protein from the luminous hydromedusan,aequorea. Journal of Cellular and Comparative Physiology, 59(3):223–239, jun 1962.
[2] Alfred Kastler. Quelques suggestions concernant la production optique et la détection optique d’une inégalité de population des niveaux de quantifigation spatiale des atomes. Application à l’expérience de Stern et Gerlach et à la résonance magnétique. J. Phys. Radium, 11(6):255–265, 1950.
[3] B. A. Griffin. Specific covalent labeling of recombinant protein molecules inside live cells. Science, 281(5374):269–272, jul 1998.
2
S TAT E O F T H E A R T
2.1 m o l e c u l a r i m a g i n g
Modern molecular imaging techniques supposedly lead to revo-lutionary paradigm shift in health care and clinical practice. As it ren-ders information that cannot be provided by conventional radiologi-cal imaging, it desperately needs integration of anatomy and function to be fully understood. From simple photograph of the inside of the human body, providing information on bone structure or form and abnormalities of various organs, imaging now offers a dynamic view of those organs and allows visualizing up to cellular metabolism. The development of these imaging techniques is the key to earlier diagno-sis of disease, best follow-up treatments and also biomedical research tools. Thus the physician can not only locate the pathology (anatom-ical imaging), but also assess the activity of processes within it and provide information to improve the suitable treatment. These tech-niques developed particularly in the 21th century form part of the molecular imaging concept. This concept requires two elements:
1. molecular probes whose physical properties are altered by the studied biological process
2. a sensitive technique to detect these molecular probes
Within the spectrum of macroscopic medical imaging, sensi-tivity ranges from the detection of millimolar to micromolar concen-trations with computed tomography (CT) and magnetic resonance imaging (MRI) respectively, to picomolar concentrations in single-photon emission computed tomography (SPECT) and positon emis-sion tomogrraphy (PET). All the techniques presented in Table 1and
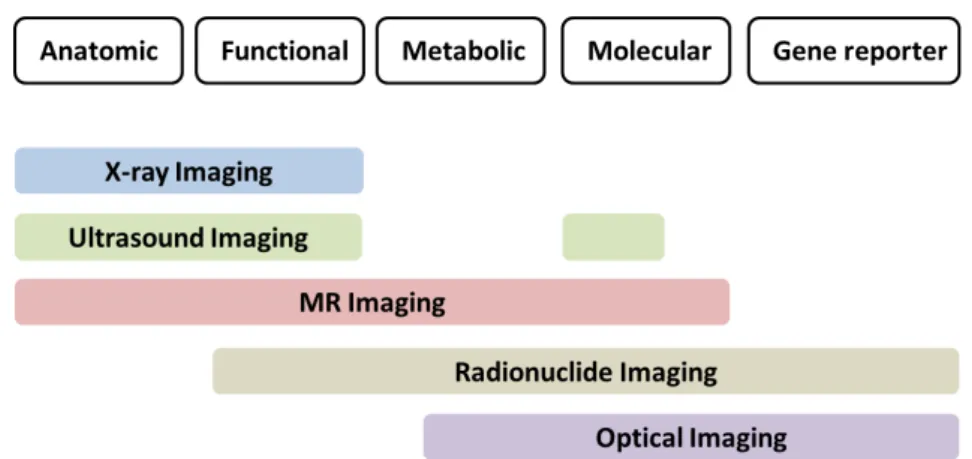
Figure 1have different characteristics and purposes that may be com-plementary according to the nature and symptoms of the disease.
PET/SPECT X-ray Optical MRI Ultrasound Spatial resolution 1-10mm 100µm 1-5mm 10-100 µm 30µm Temporal resolution 60-1000s 10-100ms 1-200ms 10-100ms 1-100ms Penetration +++ +++ + +++ ++ Radiation ++ ++ - - -Sensitivity pM µM fM-nM µM-mM µM-mM Cost +++ ++ + +++ +
Figure 1: Most popular medical imaging modalities and their main applica-tions.
Optical imaging has unparalleled sensitivity but the strong light scattering by heavy tissues limits their observation to thicknesses of less than 1-2 mm, which is not suitable for in vivo experiments. This penetration depth may be increased up to 10 cm using fluores-cent semiconductor nanocrystals (quantum dots)[2], photon
migra-tion measurements in the frequency domain[3] or semiconducting
polymer nanoparticles[4] (Figure 2).
Figure 2: In vivo systemic persistent luminescent imaging of a mouse before (Bkg) and after intravenous injection of nanoparticles which had been excited prior to injection and imaged at 2, 12, 20 and 60 min-utes to excitation light.
Ultrasound imaging is relatively inexpensive, widely avail-able, portable and has a higher penetration depth than optical tech-niques. It is the most physiological modality, able to image structure and function with less sedation than other modalities. This means that function is minimally disturbed, and multiple repeat studies can easily be assessed. However ultrasound has received less attention than other imaging modalities because it has a very low sensitivity. More recently, the development of microbubble contrast agents has opened many new opportunities, including new functional imaging
2.2 mri probes 9
methods, the ability to image capillary flow and the possibility of molecular targeting using labelled microbubbles.[5]
Positron emission tomography and single photon emission computed tomography (PET and SPECT) have the advantage of being functional imaging techniques (probing the function and metabolism of the entire human body), but are limited by their spatial and tempo-ral resolutions (1-2 mm in clinical scanners). Furthermore, the short life of the required radioligands, such as 2-[18
F]fluoro-2-deoxy-D-glucose, does not allow the long-term monitoring of the biological process of interest. The X-ray modality is, for its part, heavily lim-ited to bone and solid tumors. The latter three techniques are also subjected to the use of ionizing radiation which also implies the man-agement of radioactive wastes.
Finally, magnetic resonance imaging is a good compromise to achieve functional imaging in vivo in real time and without any radiation. It is notable that the major advantage of MRI is its high spatial resolution (25-100 µm level) and the excellent tissue contrast. In this context, MRI overruns other molecular imaging approaches up to date and is available for both morphological and functional assessments. However, this technique suffers from very low sensitiv-ity due to the very low population differences between energy levels at Boltzmann equilibrium. We will focus specifically on this method thereafter.
2.2 m r i p r o b e s
When placed in a magnetic field, nuclear magnetic moments precess at a given frequency and are able to accept energy from a ra-diofrequency wave applied at this resonance frequency. The behavior of the energy inserted into the system is described by two relaxation constants: the T2 or transverse relaxation time and the T1 or longitu-dinal relaxation time.
The interest of MRI for molecular imaging has experienced a renewed enthusiasm 20 years ago with the development of the first activatable contrast agents that act as biosensors in response to a specific biolog-ical activity. There are different types of biosensors (contrast agents, hyperpolarized endogenous and exogenous substances. . . ) which may reflect a physiological alteration due to a pathology : extracellular pH,[6] partial pressure of O2in tumor cells,[7] lactate,[8] Ca2+ions,[9]
Zn2+ions,[10] temperature etc.
Most of the agents fall into four classes, based on the MRI contrast mechanisms they engage: (1) longitudinal relaxation time (T1) agents, detected by T1 relaxation-weighted MRI [11]; (2) transverse relaxation
time (T2) agents, usually based on superparamagnetic iron oxide (SPIO), and detected by T2 relaxation-weighted MRI;[12](3) chemical
exchange saturation transfer (CEST) agents, monitored by a variant of magnetization transfer imaging;[13] and (4) heteronuclear agents,
detected by nuclear magnetic resonance (NMR) signals from nuclei other than protons, most prominently19F[14] or hyperpolarized31P[15]
and129Xe.
The main classes (Figure 3) of these sensors and the major applica-tions highlighted will be presented in this chapter.
Figure 3: Main classes of MRI constrast agents (in purple and dark blue) and MRI tracers (in light blue).
2.2.1 Relaxation contrast agents
Contrast agents are designed to accelerate the magnetic relaxation rates 1/T1and 1/T2 of protons of water molecules, that is, to shorten
the time during which the populations of protons return to their ini-tial state after excitation by radio frequency wave. The ability of these contrast agents to accelerate those speeds and therefore increase the contrast is measured by their relaxivity (expressed in mM−1s−1). Ide-ally, a biosensor has a great relaxivity when it reaches its target ("on" state) and a relaxivity near zero the rest of the time ("off" state).
2.2.1.1 Transverse relaxation time agents
T2 agents are capable of shortening the T2/T∗2 of water protons in
their vicinity through a local magnetic field effect. Thus, their pres-ence in the MRI image is witnessed by a signal loss (darkening). Nanoparticles are often used to modify the local magnetic suscep-tibility. Iron oxide nanoparticles are the best known agents of this
2.2 mri probes 11
class. SPIOs (Superparamagnetic iron oxides) were first utilized to la-bel and track transplanted cells in the rat brain (seeFigure 4).[16,17]
Their relaxivity can be modified by playing with the strength of the induced magnetic field. It can be achieved by changing the size of the agent, for example by controlled agglomeration. This gives rise to higher relaxivities and enables more efficient intracellular labeling.[18, 19]
Figure 4: Magnetic Resonance images of a rat head 6 days following trans-plantation of magnetically labeled rat fetal striatal tissue (one of the nuclei in the subcortical basal ganglia of the forebrain). The transplanted tissue was prior incubated with super-paramagnetic ferrite particles coupled to wheat germ agglutinin. Labeled tissue was injected unilaterally into the striatum. The images represent adjacent coronal 2.5 mm thick sections through a rat head (from A to D). The brain appears as an area of relative high signal inten-sity in the dorsomedial aspect of the images indicated by the open arrows in panels A and B. The transplanted tissue appears as an area of very low signal intensity indicated by an arrow in panel C. Adapted from [17].
A limitation to the use of these SPIO nanoparticles is their occa-sional extracellular deposition in tissues, either by active exocytosis or passive release through the death of transplanted cells. Further-more these agents are often considered not to be the candidates of choice for designing smart agents, due to the difficulty to modulate the T2/T∗2 contrast as a function of the microenvironment
character-istics. Also, the signal loss is not desirable when the target has an intrinsically low signal, which is the case for lungs for example. 2.2.1.2 Longitudinal relaxation time agents
T1 agents, however, require direct interaction with the water protons. For modulating the relaxivity of these agents, the three main param-eters are :
1. hydration (q) : number of water molecules bound to the agent 2. exchange kinetics of water (1/τm) : rate at which the water
molecules bind to and detach from the agent 3. rotational correlation time of the agent (τR).
Gadolinium complexes are the most common agents of this class. This metal ion has a symmetric electron distribution (Gd(III) f7). This means Gd(III) has a long electron relaxation time and operate on the relaxation of close nuclei.
Their relaxivity may be modified by specifically modulating the num-ber of available sites.
Achieving responsive biosensors based on gadolinium combines this concept to the use of a ligand or a conformational change to target a specific receptor or a physiological parameter. This permits for ex-ample, pH detection[6]. In this example, 7 of the 9 coordination sites
of gadolinium are held by a chelator, 1 site is held by a nitrophenol group and the last one by a water molecule. Once nitrophenol group is protonated, it dissociates from gadolinium and leaves free access to a water molecule. The hydration number goes from q=1 to q=2 that increases the relaxivity of the agent. The biosensor therefore has an "off" state with low relaxivity and an "on" state with a high relaxivity corresponding to the protonation or low pHs.
As a research tool, Gd3+has been used to label and track different types of stem cells, such as hematopoietic progenitor cells, monocytic cells, endothelial progenitor cells and mesenchymal stem cells in cell transplantation studies in small animals.[20, 21] This strategy can be
extended to the study of many physiological parameters, but the tox-icity of free gadolinium strongly limits the contrast agent doses. This has been reported for patients with impaired kidney function, caus-ing severe fibrosis and even death.
In addition to Gd3+, manganese (Mn II) is another potentially use-ful positive contrast agent for T1-weighted MRI. As the kinetics and behavior of Mn2+ ions inside the cell mimic those of calcium ions,
Mn2+-enhanced MRI has been used to study neuronal activity.[22]
2.2.2 Chemical Exchange Saturation Transfer agents
A new class of magnetic resonance contrast agents called chemical ex-change saturation transfer (CEST) agents, introduces image contrast in a fundamentally different way. Their action is not based on proton relaxation; instead, CEST contrast relies on the existence of at least two pools of protons with different NMR chemical shifts. One pool is made up of the exchangeable protons of the contrast agent (pool A). The second pool is bulk water (pool B). If proton spins in pool A are saturated by a continuous frequency-selective RF saturation pulse, exchange of protons from pool A to pool B during this saturation pe-riod decreases the intensity of pool B spins (seeFigure 5).
2.2 mri probes 13
Figure 5: Illustration of the CEST mechanism showing the Boltzmann dis-tribution of proton spins and the simulated NMR spectra for two chemically distinct pools of protons. Application of a frequency se-lective RF pulse causes saturation of the NMR signal, which is then transferred to the bulk water proton pool by chemical exchange.
There are two main classes of CEST agents: diamagnetic and para-magnetic agents. Diapara-magnetic agents are based on amino acids, pro-teins and sugars. They rely on exchanging protons belonging to –NH and –OH groups whose signals are usually separated by 2-5 ppm from the water signal. They are referred to as DIACEST agents. They can be used to image their own presence, or environmental factors such as pH, temperature and transplanted cells.[23,24,25]
PARACEST agents, however, contain paramagnetic metals with a high magnetic moment that do not affect T1 but instead induce large
fre-quency difference (∆ω) between the exchanging proton (or water molecule) with respect to the bulk water frequency. Unlike Gd((III), PARACEST agents has unpaired f electrons. The electron relaxation time is then shorter and therefore does not induce a nuclear relaxation but a dipolar shift. The most common of these agents are derived from paramagnetic lanthanide ion complexes with either exchange-able –NH protons or lanthanide ion-bound water molecules. The large frequency difference allows much easier RF saturation of the paramagnetically shifted proton without indirect partial saturation of bulk water protons. Similar to diaCEST agents, these paraCEST agents exhibit characteristics strongly dependent on physicochemical parameters such as temperature or pH. They can therefore be used to map these parameters.[26,27]
Figure 6shows the thermometry images obtained by locating the1H
chemical shift of a Eu3+-based paraCEST agent.
Although the amplification factor reached is promising (FA ≈ 105 to 106), the recorded detection threshold is 60 µM in vitro. In order

![Figure 19 displays the schematic drawing of the experimental setups. This work was published in [6]](https://thumb-eu.123doks.com/thumbv2/123doknet/12703433.355746/75.892.156.628.459.866/figure-displays-schematic-drawing-experimental-setups-work-published.webp)


