HAL Id: hal-02635143
https://hal-univ-rennes1.archives-ouvertes.fr/hal-02635143
Submitted on 28 May 2020
HAL is a multi-disciplinary open access
archive for the deposit and dissemination of sci-entific research documents, whether they are pub-lished or not. The documents may come from teaching and research institutions in France or abroad, or from public or private research centers.
L’archive ouverte pluridisciplinaire HAL, est destinée au dépôt et à la diffusion de documents scientifiques de niveau recherche, publiés ou non, émanant des établissements d’enseignement et de recherche français ou étrangers, des laboratoires publics ou privés.
predicts emotional outcome following subthalamic
nucleus deep brain stimulation
Philippe Voruz, Florence Le Jeune, Claire Haegelen, Karim N’Diaye,
Jean-François Houvenaghel, Paul Sauleau, Sophie Drapier, Dominique
Drapier, Didier Grandjean, Marc Vérin, et al.
To cite this version:
Philippe Voruz, Florence Le Jeune, Claire Haegelen, Karim N’Diaye, Jean-François Houvenaghel,
et al.. Motor symptom asymmetry in Parkinson’s disease predicts emotional outcome following
subthalamic nucleus deep brain stimulation. Neuropsychologia, Elsevier, 2020, 144, pp.107494.
2
Motor symptom asymmetry in Parkinson's disease predicts emotional outcome 3
following subthalamic nucleus deep brain stimulation 4
5
Philippe Voruza*, Florence Le Jeuneb,c*, Claire Haegelend,e, Karim N'Diayef, Jean-François 6
Houvenaghelb,g, Paul Sauleaub,h, Sophie Drapierb,g, Dominique Drapierb,i, Didier Grandjeanj, 7
Marc Vérinb,g*, Julie Pérona,k* 8
9
*
These authors contributed equally to this work
10 a
‘Clinical and Experimental Neuropsychology’ laboratory, Faculty of Psychology, Geneva, 11
Switzerland 12
b
‘Behavior and Basal Ganglia’ research unit, University of Rennes 1-Rennes University 13
Hospital, France 14
c
Nuclear Medicine Department, Eugène Marquis Center, Rennes, France 15
d
Neurosurgery Department, Pontchaillou Hospital, Rennes University Hospital, Rennes, 16
France 17
e
MediCIS, INSERM-University of Rennes I, France 18
f
‘Behavior, Emotion, and Basal Ganglia’ research unit, Brain and Spine Institute, Paris, 19
France 20
g
Neurology Department, Pontchaillou Hospital, Rennes University Hospital, France 21
h
Physiology Department, Pontchaillou Hospital, Rennes University Hospital, France 22
i
Adult Psychiatry Department, Guillaume Régnier Hospital, Rennes, France 23
j
‘Neuroscience of Emotion and Affective Dynamics’ laboratory, Faculty of Psychology and 24
Educational Sciences-Swiss Center for Affective Sciences, University of Geneva, Switzerland 25
k
Cognitive Neurology Unit, Neurology Department, University Hospitals of Geneva, 26 Switzerland 27 28 Corresponding author: 29
Dr Julie Péron, Faculty of Psychology and Educational Sciences, 40 bd du Pont d’Arve, 1205 30
Geneva, Switzerland, Tel.: +41 22 379 94 55 31
julie.peron@unige.ch 32
2
Acknowledgements
33
The present study was performed at the Neurology Department of Rennes University 34
Hospital, France (Prof. Vérin), and the design and acquisition part of the study was funded by 35
the France Parkinson association. The first author was funded by Swiss National Foundation 36
grant no. 105314_182221 (PI: Dr Julie Péron). The funders had no role in data collection, 37
discussion of content, preparation of the manuscript, or decision to publish. We would like to 38
thank the patients and healthy controls for contributing their time to this study. We are also 39
grateful to the Ear, Nose, and Throat Department of Rennes University Hospital for 40
conducting the hearing tests. 41
42
Conflict of interest
43
The authors report no conflicts of interest. 44
3 ABSTRACT
46
The objective of this study was to explore the brain modifications associated with vocal 47
emotion (i.e., emotional prosody) processing deficits in patients with Parkinson’s disease after 48
deep brain stimulation of the subthalamic nucleus, and the impact of motor asymmetry on 49
these deficits. We therefore conducted 18-fluorodeoxyglucose positron emission tomography 50
scans of 29 patients with left- or right-sided motor symptoms of Parkinson’s disease before 51
and after surgery, and correlated changes in their glucose metabolism with modified 52
performances on the recognition of emotional prosody. Results were also compared with 53
those of a matched healthy control group. Patients with more left-sided motor symptoms 54
exhibited a deficit in vocal emotion recognition for neutral, anger, happiness and sadness in 55
the preoperative condition that was normalized postoperatively. Patients with more right-sided 56
motor symptoms performed comparably to controls in the preoperative condition, but differed 57
significantly on fear postoperatively. At the metabolic level, the improvement observed 58
among patients with left-sided motor symptoms was correlated with metabolic modifications 59
in a right-lateralized network known to be involved in emotional prosody, while the 60
behavioral worsening observed among patients with right-sided motor symptoms was 61
correlated with metabolic modifications in the left parahippocampal gyrus and right 62
cerebellum. We suggest that surgery has a differential impact on emotional processing 63
according to motor symptom lateralization, and interpret these results as reflecting the 64
(de)synchronization of the limbic loop in the postoperative condition. 65
Keywords: emotional prosody, Parkinson's disease, asymmetry, striatum, 18FDG-PET, 66
subthalamic nucleus, deep brain stimulation 67
4 Abbreviations: ANOVA, analysis of variance; BA, Brodmann area; DBS, deep brain
69
stimulation; 18FDG-PET, 18-fluorodeoxyglucose positron emission tomography; FDR, false 70
discovery rate; fMRI, functional magnetic resonance imaging; GLMM, generalized linear 71
mixed model; HC, healthy control; H&Y, Hoehn and Yahr scale; IFG, inferior frontal gyrus; 72
LEDD, levodopa-equivalent daily dose; LPD, patients with Parkinson’s disease exhibiting 73
predominantly left-sided motor symptoms; MADRS, Montgomery-Åsberg Depression Rating 74
Scale; MCST, Modified Wisconsin Card Sorting Test; MDRS, Mattis Dementia Rating Scale; 75
OFC, orbitofrontal cortex; PD, Parkinson’s disease; RPD, patients with Parkinson’s disease 76
exhibiting predominantly right-sided motor symptoms; S&E, Schwab and England scale; 77
SPM, statistical parametric mapping; STAI, State-Trait Anxiety Inventory; STN, subthalamic 78
nucleus; UPDRS, Unified Parkinson’s Disease Rating Scale. 79
5 1 INTRODUCTION
81
Over the past decade, research on the emotional effects of subthalamic nucleus (STN) 82
deep brain stimulation (DBS) in patients with Parkinson’s disease (PD) or 83
obsessive-compulsive disorder, coupled with intracranial recordings or metabolic functional 84
imaging, has enabled researchers to explore the STN’s functional specialization and 85
integration in emotion (Le Jeune et al., 2010; Péron, Frühholz, Vérin, & Grandjean, 2013; 86
Péron, Grandjean, et al., 2010; Péron, Le Jeune, et al., 2010). On the basis of this corpus of 87
findings, an integrative model has been developed (Péron et al., 2013), according to which the 88
STN forms part of a distributed neural network underlying emotion processing in humans. 89
More specifically, rather than playing a specific function in a given emotional process, the 90
STN, together with other basal ganglia, coordinates neural patterns, either synchronizing or 91
desynchronizing the activity of the different neuronal populations involved in specific 92
emotion components. For the recognition of vocal expressions of emotion (i.e., emotional 93
prosody), for instance, the basal ganglia recruit and synchronize the activity of the structures 94
involved in the different steps of emotional prosody processing, while competing neuronal 95
patterns are inhibited (Péron et al., 2013). This mechanistic process subtends the ensuing 96
function. In line with Graybiel (2008)’s propositions concerning the motor and cognitive 97
domains, the basal ganglia iteratively assess contexts and select actions in order to form (or 98
control the expression of) coordinated emotional sequences. If these emotional sequences 99
become recurrent or repetitive, the basal ganglia combine their representations into units (also 100
called chunks). In other words, the basal ganglia code for the neuronal co-activation of the 101
different cortical and subcortical structures needed for specific emotion components, in order 102
to chunk information into manageable quanta. This information chunking provides a 103
mechanism for acquiring and expressing emotional repertoires which, without such 104
information compression, would be biologically unwieldy or difficult to implement. This 105
6 model has given rise to several postulates that have already been partially tested and
106
validated. 107
First, it suggests that, in functional terms, the STN is a constituent part of all the 108
distributed networks that subtend specific emotional subprocesses. This hypothesis was 109
confirmed in a high-resolution functional magnetic resonance imaging (fMRI) study of 110
healthy individuals (Péron, Frühholz, Ceravolo, & Grandjean, 2015) that explored the 111
structural and functional connectivity of the STN with other brain regions related to vocal 112
emotion, by combining diffusion tensor imaging and psychophysiological interaction analysis. 113
Second, it suggests that the basal ganglia, and more specifically the STN, are sensitive 114
to rhythm, owing to their intrinsic functional role of rhythm organizer, or coordinator of 115
neural patterns. In a more operational way, the model hypothesizes that the STN is involved 116
in i) all stages of emotion processing, and ii) all emotion processing irrespective of stimulus 117
valence (positive or negative) and sensory modality (e.g., visual or auditory). This has been 118
confirmed by intracranial local field potential recordings in patients with PD undergoing DBS 119
(Kühn et al., 2005; Péron et al., 2017). 120
Third and last, the model suggests that although STN DBS restores motor functions, 121
the surgery impairs nonmotor functions such as emotion processing. More specifically, STN 122
DBS restores the functional synchronization of the motor loop while at the same time 123
desynchronizing the limbic one (Péron et al., 2013). The model further suggests that the 124
metabolic modifications correlating with emotional disturbances following surgery are both 125
task dependent and sensory input dependent (Péron et al., 2013). This hypothesis has been 126
tested and validated for most emotional components, including the recognition of facial 127
emotions (Le Jeune et al., 2008), the affective component of theory of mind (Péron, Le Jeune, 128
et al., 2010), subjective emotional experiences or feelings (Ory et al., 2015), and action 129
7 tendencies (Le Jeune et al., 2009). However, it has yet to be tested for the recognition of vocal 130
emotions (i.e., emotional prosody), defined as suprasegmental changes in the course of a 131
spoken utterance, encompassing intonation, amplitude, envelope, tempo, rhythm, and voice 132
quality (Grandjean, Banziger, & Scherer, 2006). 133
Finally, a recent study in the field of emotion recognition in PD indicated that the 134
asymmetry of motor symptoms is an important clinical factor, in that it may influence the 135
presence or severity of affective disorders in PD . In this study, results indicated that patients 136
with left-sided motor symptoms (LPD) displayed vocal emotion deficits. These correlated 137
with the asymmetry of these motor symptoms, as well as with glucose metabolism 138
modifications in the right brain network subtending higher-order processes of vocal emotion 139
recognition. This inferred differential impact of PD motor symptom asymmetry on the 140
recognition of emotional prosody was recently corroborated by a meta-analysis (Coundouris, 141
Adams, Grainger, & Henry, 2019). However, the interaction of this variable with the effects 142
of STN DBS has yet to be explored. 143
144
1.1 Aim of the study 145
In this context, the purpose of the present study was twofold. The first aim was to test 146
the notion that the STN is a functional component of the brain network subtending the 147
recognition of emotional prosody at the metabolic level. The second aim was to test the 148
impact of motor asymmetry on emotional performances before and after DBS. We therefore 149
combined and correlated the emotional prosody performances of 29 consecutive patients with 150
PD who underwent STN DBS in pre- versus postoperative conditions with modifications in 151
cerebral glucose metabolism, as assessed with 18-fluorodeoxyglucose positron emission 152
tomography(18FDG-PET), and according to the precise anatomical positions of the 153
8 stimulation contacts within the target structure. The patients were carefully selected to create 154
two clinically homogeneous subgroups of patients that could be differentiated by the 155
lateralization of their motor symptoms, as attested by the calculation of an asymmetry index. 156
157
1.2 Predictions 158
Regarding behavioral results, on the strength of previous results concerning the
159
effects of STN DBS on emotional prosody recognition in patients with PD (Péron, Cekic, et 160
al., 2015; Péron, Grandjean, et al., 2010), we expected to observe a significant modulation of 161
emotional prosody recognition scores in the postoperative condition, but no difference in the 162
preoperative condition between the PD group and a group of healthy controls (HC). Given the 163
results reported by Stirnimann et al. (2018), we predicted that these effects would be driven 164
by the LPD subgoup (i.e., patients with greater right hemispheric brain dysfunction). 165
Regarding cognitive-metabolic results, on the basis of Péron et al.’s model (2013), we
166
expected to find significant correlations between modifications in emotion recognition 167
performances in the postoperative condition and glucose metabolism modifications in the 168
brain network subtending emotional prosody recognition, namely the orbitofrontal and 169
auditory cortices (i.e., voice-sensitive areas), amygdala, basal ganglia (notably the striatum), 170
and posterior cerebellum (Ethofer, Anders, Erb, Droll, et al., 2006; Ethofer, Anders, Erb, 171
Herbert, et al., 2006; Ethofer et al., 2011; Frühholz, Ceravolo, & Grandjean, in press; 172
Grandjean et al., 2005; Sander et al., 2005; Schirmer & Kotz, 2006; Wildgruber, Ethofer, 173
Grandjean, & Kreifelts, 2009). 174
9 2 PARTICIPANTS AND METHODS
176
2.1 Participants 177
One group of patients with PD and one HC group took part in the study. All the 178
patients met the clinical criteria of the Parkinson’s UK Brain Bank for idiopathic PD (Hughes, 179
Daniel, Kilford, & Lees, 1992). 180
2.1.1 Patients with Parkinson’s disease (Table 1)
181
The patient group consisted of a series of 29 consecutive patients with medically 182
intractable PD who underwent bilateral STN DBS at Rennes University Hospital (France). 183
Standard selection and exclusion criteria for surgery were applied to all patients (Welter et al., 184
2002). In particular, patients with brain atrophy were excluded on the basis of the 185
preoperative MRI. There were 16 men and 13 women in the patient group. Their mean age at 186
surgery was 56.5 years (SD = 7.98, range = 36-68), and their mean education level (in years 187
of school completed) was 11.30 (SD = 3.60, range = 6-20). According to the criteria of the 188
Edinburgh Handedness Inventory (Oldfield, 1971), 27 patients were right-handed, and two 189
were left-handed. Their mean disease duration at surgery was 11.20 years (SD = 4.20, range = 190
6-22). The total levodopa-equivalent daily dose (LEDD) was calculated on the basis of 191
Lozano et al. (1995): M = 1280.76 mg (SD = 588.50, range = 360-2520) before STN DBS and 192
M = 717.21 mg (SD = 562.47, range = 0-2020) after STN DBS.
193
The patients with PD were divided into two subgroups, based on side of symptom 194
onset: primarily left-affected (LPD; n = 13) versus primarily right-affected (RPD; n = 16). We 195
then calculated an asymmetry index based on the lateralized items (Items 20–26) of Part III of 196
the Unified Parkinson’s Disease Rating Scale (UPDRS III; Fahn & Elton, 1987), by 197
subtracting the item scores related to the left side of the body from the item scores related to 198
the right side of the body, in order to use the patients’ current asymmetry status to corroborate 199
our distinction. T tests for independent groups revealed a significant difference between the 200
10 two subgroups on the asymmetry index in both the on-dopa (t = -4.72, p < .001) and off-dopa 201
(t = -3.25, p = .003) conditions. In the preoperative condition, the two patient subgroups were 202
otherwise similar, in terms of sex ratio (8 women and 8 men in the RPD group; 6 women and 203
7 men in the LPD group), age, education level, age at motor symptom onset, disease duration, 204
and stage of the disease (Table 1). 205
206
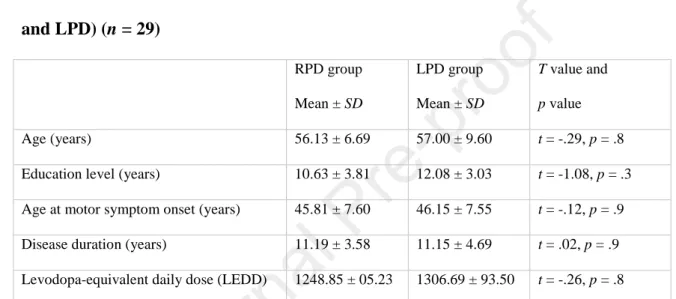
Table 1. Sociodemographic data before STN DBS for the two patient subgroups (RPD 207 and LPD) (n = 29) 208 RPD group Mean ± SD LPD group Mean ± SD T value and p value Age (years) 56.13 ± 6.69 57.00 ± 9.60 t = -.29, p = .8 Education level (years) 10.63 ± 3.81 12.08 ± 3.03 t = -1.08, p = .3 Age at motor symptom onset (years) 45.81 ± 7.60 46.15 ± 7.55 t = -.12, p = .9 Disease duration (years) 11.19 ± 3.58 11.15 ± 4.69 t = .02, p = .9 Levodopa-equivalent daily dose (LEDD) 1248.85 ± 05.23 1306.69 ± 93.50 t = -.26, p = .8
Note. T test for independent groups. SD: standard deviation; LPD: patients with PD exhibiting
209
predominantly left-sided motor symptoms; RPD: patients with Parkinson's disease exhibiting 210
predominantly right-sided motor symptoms. 211
2.1.2 Matched healthy controls
212
The HC group consisted of 29 healthy matched individuals who had no history of 213
neurological disease, head injury or alcohol abuse, and displayed no signs of dementia, as 214
attested by their scores on the Mattis Dementia Rating Scale (Mattis, 1988) (mean score = 215
141.70, SD = 1.70). There were 16 men and 13 women in this group. Their mean age was 216
54.35 years (SD = 8.50, range = 35-66), and their mean education level was 12.40 years (SD = 217
11 2.50, range = 9-15). According to the criteria of the Edinburgh Handedness Inventory
218
(Oldfield, 1971), 27 HC participants were right-handed and two were left-handed. 219
The two groups (whole PD vs. HC) were comparable for handedness and sex ratio. 220
Furthermore, there was no statistical difference between the two groups on either age (t = -221
1.274, p = .2) or education level (t = 1.594, p = .1). 222
After receiving a full description of the study, all participants gave their written 223
informed consent, and the study was conducted in accordance with the Declaration of 224
Helsinki. 225
2.2 General procedure 226
All patients were assessed 3 months before and 3 months after surgery with motor, 227
PET, and neuropsychological tests. These evaluations were all performed in the same week. 228
All patients had stimulation turned on and were on levodopa when they underwent the PET 229
and neuropsychological assessments. 230
2.3 Motor assessments 231
All patients were evaluated according to the Core Assessment Program for 232
Intracerebral Transplantation (Langston et al., 1992) and scored on the UPDRS I-IV (Fahn & 233
Elton, 1987), Hoehn and Yahr scale (H&Y, Hoehn & Yahr, 1967), and Schwab and England 234
scale (S&E, Schwab & England, 1969) 3 months before and 3 months after surgery. Patients 235
were assessed on and off levodopa before and after surgery. Stimulation remained on after 236
surgery. 237
2.4 Neurosurgery and electrode location (SI 1) 238
Quadripolar (from 0 for the most ventral contact to 3 for the most dorsal) 3389 DBS 239
electrodes (Medtronic, Minneapolis, MN, USA) were implanted bilaterally in the STN in a 240
single operating session. The overall methodology was similar to that previously described by 241
Benabib and colleagues (2000). A brain MRI was performed at the onset of the surgical 242
12 procedure, to calculate the stereotactic coordinates for positioning the two selected electrode 243
contacts (one on the left and one on the right). The intended coordinates at the tip of Contact 0 244
were 10-12 mm from the midline, 0-3 mm behind the midcommissural point, and 3-5 mm 245
below the anterior commissure-posterior commissure line. During the operation, the final 246
course and depth of the electrodes was determined by the best effect obtained on rigidity with 247
no side effects and at the lowest voltage. A three-dimensional computed tomography brain 248
scan performed a few days later confirmed the position of the electrodes. The exact contact 249
locations for each patient and for each of the right and left electrodes are available in 250
Supplementary Material SI 1. 251
In all patients, chronic stimulation was monopolar, using a single contact of the 252
quadripolar electrode chosen for the best motor improvement. The stimulation characteristics 253
were as follows: mean pulse width 60 µs for the right side (SD = 0) and 60 µs (SD = 0) for the 254
left side, mean frequency 133 Hz (SD = 8.2) for the right side and 131 Hz (SD = 6.1) for the 255
left side, and mean voltage 2.2 V (SD = 0.6) for the right side and 2.2 V (SD = 0.6) for the left 256
side. 257
2.5 Neuropsychological and psychiatric assessment 258
A short neuropsychological and psychiatric battery was administered to participants 259
prior to the vocal emotion recognition sessions (Péron et al., 2011; Péron, Grandjean, et al., 260
2010). This battery included the MDRS (Mattis, 1988) and a series of tests to assess frontal 261
executive functions: Nelson modified Wisconsin Card Sorting Test (MCST, Nelson, 1976), 262
Trail Making Test (TMT, Reitan, 1958), Categorical and Literal Fluency Test (Cardebat, 263
Doyon, Puel, Goulet, & Joanette, 1990), Action (Verb) Fluency Task (Woods et al., 2005), 264
and Stroop test (Stroop, 1935). Depression was assessed with the Montgomery-Åsberg 265
Depression Rating Scale (MADRS, Montgomery & Asberg, 1979). This scale was chosen 266
because of the predominance of psychic items over somatic ones, thus limiting interference 267
13 with the PD symptoms. Finally, the State-Trait Anxiety Inventory (STAI, Spielberger,
268
Gorsuch, Lushene, Vagg, & Jacobs, 1993) was used to assess anxiety, and the Apathy 269
Evaluation Scale (clinician version; (Marin, Biedrzycki, & Firinciogullari, 1991) to assess 270
apathy. 271
272
2.6 Vocal emotion recognition assessment 273
2.6.1 Stimuli
274
All participants were exposed to a set of vocal stimuli (Péron et al., 2011; Péron, 275
Grandjean, et al., 2010). These stimuli, extracted from the database developed and validated 276
by Banse and Scherer (1996), consisted of short segments of meaningless speech 277
(pseudoword 1: fɪ gœt laiʃ ʃɑ̃ kil gɔs tɛʀ, pseudo-word 2: h’ɛt s’ɒ̃dik pr’ɒ̃g nj’y v’ɛntzi), 278
obtained by concatenating different syllables found in Indo-European languages so that they 279
would be perceived of as natural utterances, with emotional intonation (across different 280
cultures) but no semantic content. Four categories of emotional prosody (anger, fear, 281
happiness, and sadness), together with a neutral condition, were used in the present study. We 282
selected utterances produced by 12 different actors (6 women and 6 men), each expressed 283
with five different prosodies (anger, fear, happiness, neutral, and sadness). The set of vocal 284
stimuli (pseudowords) comprised 60 stimuli (12 actors × 5 emotion conditions) and is 285
extensively described elsewhere (Péron, Cekic, et al., 2015; Péron, Grandjean, et al., 2010). 286
2.6.2 Vocal emotion recognition procedure
287
All stimuli were presented bilaterally via stereo headphones with an Authorware 288
program designed especially for this study. Participants sat comfortably in a quiet room in 289
front of the computer and looked at a fixation cross while listening to the stimuli. They were 290
told that they would hear meaningless speech uttered by male/female actors and that these 291
actors would express emotions through their utterances. Participants were required to listen to 292
14 each stimulus, after which they were asked to rate its emotional content on a set of visual 293
analogue scales ranging from Not at all to Very much, which were simultaneously displayed 294
on the computer screen (see Appendix). More specifically, participants rated each stimulus on 295
six scales: one scale for each featured emotion (anger, fear, happiness, and sadness), one for 296
neutral, and one for the surprise emotion, so that we could determine whether the fear 297
emotion expressed by the human voice was confused with surprise, as is the case with facial 298
expressions (Ekman, 2003; Scherer & Ellgring, 2007). Participants were told that they could 299
listen again to each stimulus as many as six times, by clicking on a button on the computer 300
interface (click counter). Participants were given two examples to familiarize themselves with 301
the task. 302
2.6.3 Audiometric screening procedure
303
To ensure that all participants had normal hearing, we carried out a standard 304
audiometric screening procedure (AT-II-B audiometric test) to measure tonal and vocal 305
sensitivity. This was done in the Ear, Nose and Throat Department of Rennes University 306
Hospital. None of the patients included in the study wore hearing aids or had a history of 307
tinnitus or a hearing impairment. 308
As described elsewhere (Le Jeune et al., 2008; Péron, Biseul, et al., 2010; Péron, 309
Grandjean, et al., 2010; Péron et al., 2009), Versions A and B of the emotional recognition 310
task were counterbalanced, to avoid a list effect between the pre- and postoperative conditions 311
in the PD group. The protocol was completed in a single 90-minute session. 312
2.7 PET imaging 313
2.7.1 Acquisition
314
All patients underwent the 18FDG-PET scans in a resting state with their eyes open. 315
They underwent two scans while on their antiparkinsonian medication: the first was 316
performed 3 months before surgery, and the second 3 months after surgery, with the 317
15 stimulator switched on. PET measurements were performed with a dedicated Discovery ST 318
PET scanner (GEMS, Milwaukee, WI, USA) in 2D mode with an axial field of view of 15.2 319
cm. A 222-296 MBq injection of 18FDG was administered intravenously under standardized 320
conditions (in a quiet, dimly lit room with the patient’s eyes and ears open), with normal 321
fasting blood glucose < 1.4 g/l before injection. During acquisition, the patient’s head was 322
immobilized with a head holder. A cross-laser system was used to achieve stable and 323
reproducible positioning. A 20-minute 2D emission scan was performed 30 minutes post-324
injection and after X-ray-based attenuation correction. The patient was positioned at the 325
center of the field of view. Following scatter, dead time, and random corrections, the PET 326
images were reconstructed by 2D filtered back projection, yielding 47 contiguous transaxial 327
3.75-mm thick slices. 328
2.7.2 PET image transformation
329
Using a method described elsewhere (Le Jeune et al., 2008), we analyzed the data with 330
statistical parametric mapping (SPM) software (Wellcome Department of Cognitive 331
Neurology, London, UK) implemented in MATLAB Version 8 (Mathworks Inc., Sherborn, 332
MA, USA). All the patients’ images were first realigned and normalized to MNI space. 333
2.8 Statistical analysis 334
2.8.1 Analyses testing predictions about behavioral results
335
Sociodemographic, neuropsychological, and psychiatric data. Intergroup
336
comparisons were performed using t tests for two independent groups. Intragroup 337
comparisons were performed using t tests for two dependent groups, to evaluate the effect of 338
experimental condition. 339
Vocal emotion recognition data. We calculated three generalized linear mixed models
340
(GLMMs) with participant as the random factor. This type of statistical model allows random 341
effects such as interindividual variability to be controlled, in addition to fixed effects. Using R 342
16 software, we calculated a first GLMM with three within-participants factors: emotion (five 343
levels), scale (six levels), and condition (pre- vs. postoperative; two levels). A second GLMM 344
was run with emotion (five levels) and scale (six levels) as within-participants factors, and 345
group (PD preoperative vs. HC; two levels) as a between-participants factor. A third GLMM 346
was calculated with emotion (five levels) and scale (six levels) as within-participants factors, 347
and group (PD postoperative vs. HC; two levels) as a between-participants factor. To 348
investigate the effects in greater detail, for each model, we used the phia package in R and 349
performed contrasts between the groups (or conditions) for each prosodic category and each 350
rating scale. Each p value yielded by the contrasts was false discovery rate (FDR) 351
corrected. 352
Relationship between vocal emotion recognition performances and secondary
353
variables. To assess the relationships between the psychiatric, clinical, neuropsychological
354
and sociodemographic variables and the recognition of emotional prosody variables, we 355
entered these variables in multiple regression models. More specifically, the postoperative - 356
preoperative deltas for emotional prosody ratings were entered as dependent variables and the 357
postoperative - preoperative deltas for the sociodemographic, psychiatric, clinical, and 358
neuropsychological variables, as well as the contact locations, were entered as independent 359
variables. In addition, relative to our operational hypotheses, we included the preoperative on-360
dopa motor asymmetry index. The regression analyses were performed with experimental 361
emotional conditions and secondary variables of interest (i.e., those reported to be significant 362
between the pre- and postoperative conditions), in order to avoid Type I errors. The results of 363
forward, backward, and stepwise regressions were all consistent. 364
2.8.2 Analyses testing predictions about cognitive-metabolic results
365
The SPM software established correlations between pre- versus postoperative changes 366
in recognition of emotional prosody data and pre- versus postoperative changes in brain FDG 367
17 uptake. To identify those regions that correlated significantly with the recognition of
368
emotional prosody, we tested a general linear “single subject, covariates only” model for 369
every voxel, with emotional prosody as a covariant: one model for each of the emotional 370
prosody recognition-dependent variables that were found to be significantly different in the 371
postoperative condition compared with the preoperative one, between the RPD and LPD 372
subgroups, or between the PD patient group and HC. As levodopa medication can influence 373
neural metabolism, we included LEDD as a nuisance variable. Relative to our operational 374
hypotheses, and as with the cognitive-emotional regressions, we included the preoperative on-375
dopa motor asymmetry index as a second nuisance variable. This yielded a regression 376
coefficient that was then converted into a t value. Two t tests were performed, one intended to 377
reveal correlations between modifications in emotional scores and decreased cerebral glucose 378
metabolism, the other to reveal correlations between these modifications and increased 379
cerebral FDG uptake. Next, t statistic parametric maps were calculated for each covariate. 380
Clusters of a minimum of 70 contiguous voxels with a threshold of p < 0.001 (corrected for 381
multiple comparisons) were deemed to be significant for cortical structures, while clusters of 382
a minimum of 25 contiguous voxels with a threshold of p < 0.001 (corrected for multiple 383
comparisons) were deemed to be significant for smaller structures such as the basal ganglia, 384
thalamus and amygdala, as well as for cerebellar structures. 385
18 3 RESULTS
387
3.1 Clinical and motor results (Table 2) 388
3.1.1 Intergroup comparisons
389
Apart from the motor asymmetry index (see Methods), no significant difference 390
between the LPD and RPD patients was observed in either the pre- or postoperative condition 391
(all ps > .08). 392
3.1.2 Intragroup comparisons
393
For both patient subgroups, we observed a significant motor improvement 3 months 394
after surgery. For the RPD subgroup, the effects were significant for the motor UPDRS III 395
score in both the off-dopa (t = 4.79, p < .001) and on-dopa (t = 4.16, p = .008) conditions, the 396
off-dopa S&E score (t = 2.08, p = .046), and the off-dopa H&Y score (t = -2.18, p = .04). For 397
the LPD subgroup, the effects were only significant for the motor UPDRS III score in the off-398
dopa condition (t = 4.1, p = .001). LEDD decreased significantly after surgery for both 399
subgroups (RPD: t = -3.41, p < .001; LPD: t = -2.09, p = .047). All the data, other effects, p 400
and statistical values are available in full in Table 2. 401
402
19 Table 2. Motor scores before (preoperative condition, baseline) and after (postoperative 404
condition, M+3) STN DBS for patients with PD (n = 29), according to subgroup (LPD or 405
RPD). 406
RPD Off-dopa RPD On-dopa LPD Off-dopa LPD On-dopa
Pre Mean ± SD Post Mean ± SD Pre Mean ± SD Post Mean ± SD Pre Mean ± SD Post Mean ± SD Pre Mean ± SD Post Mean ± SD UPDRS III 35.34 ± 15.87 14.83 ± 8.38** 8.16 ± 5.32 4.90 ± 3.66* 31.12 ± 9.01 15.46 ± 9.98* 8.27 ± 6.39 4.81 ± 3.82 S&E (%) 56.54 ± 23.00 74.38 ± 23.00** 81.43 ± 24.13 93.75 ± 6.19 70.77 ± 15.49 76.92 ± 15.49 87.69 ± 12.56 94.62 ± 10.32 H&Y 2.60 ± 1.05 1.72 ± 1.17* 1.1 ± 0.99 0.91 ± 1.07 2.19 ± 0.75 2.04 ± 0.77 1.03 ± 0.83 0.81 ± 0.99 LEDD NA NA 1306.69 ± 593.18 685.47 ± 544.12** NA NA 1248.75 ± 605.23 753.85 ± 603.07* 407
Note. T test for dependent groups. STN DBS: subthalamic nucleus deep brain stimulation;
408
LPD: patients with Parkinson’s disease exhibiting predominantly left-sided motor symptoms; 409
RPD: patients with Parkinson's disease exhibiting predominantly right-sided motor 410
symptoms; UPDRS: Unified Parkinson’s Disease Rating Scale; SD: standard deviation; S&E: 411
Schwab & England scale; H&Y: Hoehn & Yahr scale; LEDD: levodopa-equivalent daily 412
dose; NA: not applicable. *p < 0.05. **p < 0.001.
413 414
3.2 Neuropsychological background and psychiatric results (Table 3) 415
3.2.1 Intergroup comparisons
416
RPD versus HC. In the preoperative condition, there were significant differences
417
between the RPD and HC groups on the TMT B-A (t = -2.92, p = .01), the numbers of criteria 418
(t = 2.49, p = .02) and errors (t = -2.56, p = .01) in the MCST, the Action (Verb) Fluency Task 419
(t = -2.13, p = .04), MADRS (t = -3.95, p < .01), and STAI A (t = -2.13, p = .04). In the 420
20 postoperative condition, there were significant differences between the RPD and HC groups 421
on the TMT B-A (t = -2.99, p =.01) and MDRS (t = -2.8, p = .01). The RPD subgroup 422
therefore had poorer cognitive performances than HC and were more depressed. 423
LPD versus HC. In the preoperative condition, no significant differences were found
424
for neuropsychological background and psychiatric tests. In the postoperative condition 425
however, there were significant differences on the number of criteria (t = 2.15, p = .04) in the 426
MCST and on the Action (Verb) Fluency Task (t = 2.19, p = .03). The LPD subgroup 427
therefore had poorer cognitive performances than HC. 428
LPD versus RPD. Interestingly, the RPD and LPD subgroups differed significantly in
429
the preoperative condition on STAI A (t = 2.69, p = .01) and B (t = 2.17, p = .01), with RPD 430
patients scoring higher on anxiety than LPD patients. In the postoperative condition, no 431
significant difference was found between the RPD and LPD subgroups on any of the 432
neuropsychological background or psychiatric tests. 433
3.2.2 Intragroup comparisons
434
Within RPD. No significant difference was found between the pre- and postoperative
435
conditions for neuropsychological background and psychiatric tests, except for phonemic 436
verbal fluency (t = -3.19, p = .009), on which RPD patients performed more poorly in the 437
postoperative condition than in the preoperative one. 438
Within LPD. No significant difference was found between the preoperative and
439
postoperative conditions for neuropsychological background and psychiatric tests, except for 440
phonemic verbal fluency (t = -3.05, p = .01) and the MDRS (t = -2.53, p = .03), on which 441
LPD patients performed more poorly in the postoperative condition than in the preoperative 442
one. 443
21 Table 3. Performances of patients with PD before (preoperative condition, M-3, n = 29) 444
and after (postoperative condition, M+3, n = 29) STN DBS, according to subgroup (LPD 445
or RPD), and HC (n = 29) on neuropsychological tests 446 RPD Preoperative Mean ± SD RPD Postoperative Mean ± SD LPD Preoperative Mean ± SD LPD Postoperative Mean ± SD HC Mean ± SD MDRS (/144) 140.31 ± 2.94 141.00 ± 2.22 140.92 ± 1.89 138.08 ± 4.36# 141.68 ± 1.70
Stroop Test - Interference 1.73 ± 8.17 2.48 ± 7.55 3.60 ± 6.39 5.21 ± 7.52 3.09 ± 6.83
TMT B-A (s) 75.06 ± 47.08* 95.93 ± 84.64* 64.54 ± 79.16 75.69 ± 76.2 42.56 ± 23.87
Categorical verbal fluency (2 min)
30.38 ± 9.49 28.94 ± 9.24 27.69 ± 13.30 29.38 ± 12.37 32.64 ± 7.52
Phonemic verbal fluency (2 min) 22.69 ± 6.07 19.63 ± 5.29# 20.92 ± 7.43 17.00 ± 6.38# 20.96 ± 6.29
Action (Verb) Fluency (1 min) 13.06 ± 6.21* 13.56 ± 5.12 14.38 ± 6.59 13.31 ± 5.95* 16.24 ± 4.85
MCST - Number of categories (/6) 5.54 ± 0.82* 5.82 ± 0.35 5.75 ± 0.62 5.21 ± 1.75* 5.96 ± 0.20 MCST - Number of errors 5.50 ± 4.56* 3.63 ± 3.59 3.58 ± 4.68 4.67 ± 6.84 2.80 ± 2.10 MCST - Number of perseverative errors 1.44 ± 1.82 1.13 ± 1.67 1.08 ± 2.07 1.83 ± 3.33 0.56 ± 0.77 MADRS 5.60 ± 4.39* 4.73 ± 4.61* 3.15 ± 3.48 3.38 ± 4.46 1.29 ± 2.07 STAI-A State 40.62 ± 11.84* 34.54 ± 7.78 29.64 ± 5.37@ 32.36 ± 11.25 31.06 ± 10.70 STAI-B Trait 44.79 ± 8.62 41.86 ± 9.87 36.64 ± 11.20@ 38.64 ± 11.25 39.82 ± 9.16 AES Total 32.40 ± 5.45 34.73 ± 9.66 30.08 ± 7.54 30.69 ± 7.06 -
Note. STN DBS: subthalamic nucleus deep brain stimulation; LPD: patients with Parkinson’s
447
disease exhibiting predominantly left-sided motor symptoms; RPD: patients with Parkinson's 448
disease exhibiting predominantly right-sided motor symptoms; HC: healthy controls; MDRS: 449
Mattis Dementia Rating Scale; TMT: Trail Making Test; MCST: Modified Wisconsin Card 450
Sorting Test; MADRS: Montgomery-Åsberg Depression Rating Scale; STAI: State-Trait 451
Anxiety Inventory; AES, Apathy Evaluation Scale; SD: standard deviation. * p < 0.05 452
compared with HC group (t test for independent samples). # p < 0.05 compared with 453
preoperative condition (t test for dependent samples). @ p < 0.05 compared with RPD group (t 454
test for independent samples). 455
22 3.3 Vocal emotion recognition results (Tables 4 & 5)
457
Interestingly, analysis revealed the following significant interaction effects: Emotion × 458
Scale × Condition × Side of symptom onset, F(20, 20733) = 1.8, p = .01; Emotion × Scale × 459
Side of symptom onset, F(20, 20733) = 4.4, p < .001; Scale × Condition × Side of symptom 460
onset, F(5, 20733) = 5.28, p < .001; Condition × Emotion × Scale, F(20, 20733) = 2.1, p < 461
.001; Emotion × Scale, F(20, 20733) = 376.44, p < 0.001; Scale × Side of symptom onset, 462
F(20, 20733) = 8.42, p < .001; and Scale x Condition, F(5, 20733) = 3.76, p = .002. There
463
were also main effects of emotion, F(4, 20733) = 13.67, p < .001, and scale, F(5, 20733) = 464
37.1, p < .001. There was no significant effect of either Condition × Emotion × Side of 465
symptom onset, F < 1, Emotion x Side of symptom onset, F < 1, Emotion × Condition, F < 1, 466
or Condition x Side of symptom onset, F(4, 20733) = 2.43, p = .12. Nor was there a 467
significant main effect of either condition, F(1, 20733) = 3.25, p = .07, or side of symptom 468
onset, F < 1. 469
To investigate these effects in greater detail, we ran Condition × Side of symptom 470
onset × Scale interaction analyses for each separate emotion. Contrasts (FDR corrected) were 471
then performed between the groups for each prosodic category and ratings on (a) the target 472
scale, that is, the scale (e.g., Anger) corresponding to the stimulus emotion (e.g., anger), and 473
(b) the nontarget scales, that is, the scales that did not correspond to the stimulus emotion (e.g. 474
Fear scale for anger stimulus). Contrasts were performed for the nontarget scales in order to 475
investigate the patterns of confusion between the different emotions. Means and standard 476
deviations are available in Table 4, and summarized results in Table 5. 477
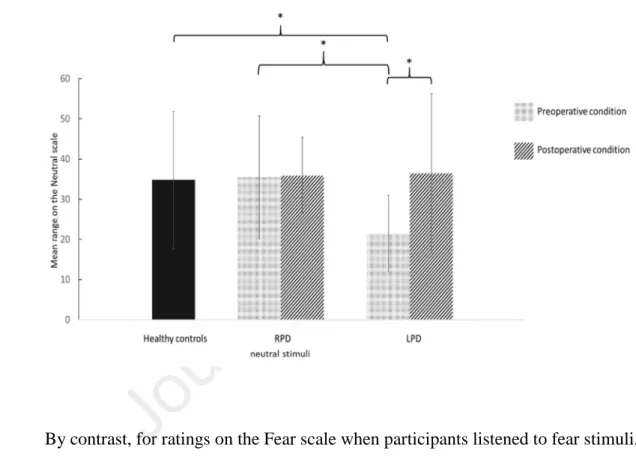
In the preoperative condition, compared with both the RPD subgroup and HC, the 478
LPD subgroup exhibited emotional deficits for ratings on the target scales when they listened 479
to neutral (Fig. 1) and happiness stimuli. Moreover, compared with HC, the LPD subgroup 480
23 exhibited emotional deficits for ratings on the target scale when they listened to sadness 481
stimuli. These significant differences were no longer present in the postoperative condition. 482
483
Figure 1. Mean ratings (and standard deviations) across all three groups (RPD, 484
LPD and HC) on the Neutral scale when the stimulus was neutral 485
486
487 488
By contrast, for ratings on the Fear scale when participants listened to fear stimuli, the 489
RPD subgroup did not differ significantly from either the HC or LPD in the preoperative 490
condition. However, they provided a significantly higher number of emotional misattributions 491
in the postoperative condition, compared with HC (Fig. 2). 492
493 494
24 Figure 2. Mean ratings (and standard deviations) for all three groups (RPD, LPD and 495
HC) on the Fear scale when the stimulus was fear. 496
497
498
All the effects are summarized in Table 5. 499
500
25 Table 4. Mean ratings (standard deviations) of pseudoword stimuli in emotional prosody 502
task for patients with PD (preoperative vs. postoperative condition), according to 503
subgroup (LPD; n = 13 vs. RPD; n = 16), and for HC 504
RPD Preoperative condition (baseline) (n = 16)
Emotion Anger scale Happiness scale Neutral scale Fear scale Surprise scale Sadness scale
Anger 46.20 (± 11.91) 1.76 (± 2.50) 5.03 (± 5.88) 4.57 (± 5.27) 7.72 (± 6.66) 0.66 (± 1.97) Fear 7.34 (± 7.26) 3.16 (± 2.58) 4.23 (± 3.83) 38.61 (± 14.65) 8.68 (± 10.29) 10.03 (±12.94) Happiness 5.36 (± 4.92) 34.07 (± 11.99) 1.77 (± 3.06) 6.95 (± 6.73) 13.81 (± 10.57) 5.87 (± 6.19) Neutral 0.15 (± 0.08) 6.41 (± 5.90) 34.40 (± 18.54) 0.67 (± 0.97)* 11.36 (± 8.32) 1.34 (± 1.69) Sadness 0.98 (± 2.17) 1.06 (± 2.75) 18.93 (± 10.42) 8.91 (± 8.13) 3.52 (± 5.42) 33.58 (± 17.96) RPD Postoperative condition (M+3) (n = 16)
Emotion Anger scale Happiness scale Neutral scale Fear scale Surprise scale Sadness scale
Anger 48.39 (± 11.98) 0.71 (± 1.46) 6.51 (± 6.72) 5.18 (± 7.11) 9.08 (± 6.34) 1.13 (± 1.81)
Fear 6.74 (± 5.34) 3.38 (± 3.41) 5.67 (± 7.20) 34.88 (± 13.30)* 12.99 (± 9.91) 9.47 (± 8.48)
Happiness 3.85 (± 4.59) 30.45 (± 13.93) 4.61 (± 6.47) 6.12 (± 6.09) 19.70 (± 10.11) 6.50 (± 8.26)
Neutral 0.43 (± 0.54) 6.67 (± 6.60) 36.04 (± 15.29) 1.68 (± 1.83)* 11.83 (± 9.75) 1.63 (± 2.01)
Sadness 2.65 (± 4.08) 1.17 (± 2.20) 14.34 (± 12.09) 9.33 (± 7.44) 4.65 (± 5.87) 36.14 (± 17.23)
LPD Preoperative condition (baseline) (n = 13)
Emotion Anger scale Happiness scale Neutral scale Fear scale Surprise scale Sadness scale
Anger 46.01 (± 13.67) 1.92 (± 4.95) 5.75 (± 3.97) 6.62 (± 11.14) 11.91 (± 10.91) 6.05 (± 12.14) Fear 11.33 (± 14.70) 3.42 (± 7.14) 5.76 (± 7.51) 37.46 (± 21.02) 14.68 (± 12.56) 14.35 (± 15.37) Happiness 9.39 (± 11.67) 23.29 (± 10.27)*@ 2.52 (± 4.02) 10.41 (± 10.71) 24.03 (± 14.46)@ 12.39 (± 12.12) Neutral 5.69 (± 11.61) 7.22 (± 8.80) 22.67 (± 8.71) 4.94 (± 10.34)*@ 17.69 (± 14.25)@ 7.03 (± 12.44) Sadness 5.07 (± 11.53) 2.01 (± 4.85) 19.12 (± 8.52) 11.94 (± 11.40) 6.82 (± 13.99) 30.65 (± 10.96)* LPD Postoperative condition (M+3) (n = 13)
Emotion Anger scale Happiness scale Neutral scale Fear scale Surprise scale Sadness scale
Anger 48.31 (± 13.51) 3.56 (± 10.13) 9.34 (± 10.71) 6.68 (± 11.11) 12.86 (± 12.72) 4.36 (± 12.31)
Fear 7.95 (± 11.37) 4.21 (± 12.32) 8.78 (± 11.98) 38.93 (± 17.64) 14.15 (± 14.57) 12.08 (± 11.06)
Happiness 8.66 (± 11.73) 24.66 (± 11.88) 7.73 (± 12.24) 14.06 (± 12.74) 19.83 (± 15.13) 13.29 (± 12.07)
Neutral 3.77 (± 11.56) 4.97 (± 8.81) 38.95 (± 18.24)# 3.93 (± 10.72) 18.61 (± 14.66)@ 5.64 (± 13.03)
26
HC group (n = 29)
Emotion Anger scale Happiness scale Neutral scale Fear scale Surprise scale Sadness scale
Anger 51.97 (± 10.09) 1.29 (± 4.55) 4.22 (± 5.55) 6.40 (± 8.04) 11.26 (± 9.51) 2.24 (± 4.26) Fear 8.75 (± 9.63) 1.27 (± 2.23) 2.67 (± 4.86) 43.46 (± 11.09) 12.04 (± 9.93) 14.56 (± 11.19) Happiness 9.49 (± 7.41) 30.83 (± 10.23) 1.88 (± 3.26) 7.38 (± 4.62) 19.44 (± 10.81) 8.74 (± 7.12) Neutral 1.09 (± 2.70) 6.76 (± 7.83) 34.57 (± 17.33) 1.20 (± 1.57) 16.34 (± 10.08) 3.23 (± 3.82) Sadness 2.38 (± 4.26) 1.28 (± 2.38) 20.16 (± 13.86) 9.55 (± 7.17) 3.17 (± 3.95) 39.53 (± 16.96) 505
Note. PD: Parkinson’s disease; SD: standard deviation; LPD: patients with Parkinson’s
506
disease exhibiting predominantly left-sided motor symptoms; RPD: patients with Parkinson's 507
disease exhibiting predominantly right-sided motor symptoms; HC: healthy controls. * p < .05 508
compared with HC group (intergroup comparisons). # p < 0.05 compared with preoperative 509
condition (intragroup comparisons). @ p < 0.05 compared with RPD group (intergroup 510
comparisons). 511
27 Table 5. Table summarizing vocal emotion recognition results (FDR corrected)
513
514
Note. LPD: patients with Parkinson’s disease exhibiting predominantly left-sided motor
515
symptoms; RPD: patients with Parkinson's disease exhibiting predominantly right-sided 516
motor symptoms; HC: healthy controls; pre: preoperative condition; post: postoperative 517
condition; ns: Not statistically significant. 518
519
Emotion Scale Intergroup
comparisons
Intragroup comparisons
Preoperative condition Postoperative condition (Pre vs. post)
Anger Anger ns ns ns Fear ns ns ns Happiness ns ns ns Neutral ns ns ns Sadness ns ns ns Surprise ns ns ns Fear Anger ns ns ns Fear ns RPD < HC ns Happiness ns ns ns Neutral ns ns ns Sadness ns ns ns Surprise ns ns ns Happiness Anger ns ns ns Fear ns ns ns Happiness LPD < RPD; LPD < HC ns ns Neutral ns ns ns Sadness ns ns ns Surprise LPD > RPD ns ns Neutral Anger ns ns ns Fear ns ns ns Happiness ns ns ns
Neutral LPD < RPD; LPD < HC ns LPD pre < LPD post
Sadness ns ns ns Surprise LPD > RPD; RPD < HC LPD < RPD ; RPD < HC ns Sadness Anger ns ns ns Fear ns ns ns Happiness ns s ns Neutral ns ns ns Sadness LPD < HC ns ns Surprise ns ns ns
28 3.4 Relationships between vocal emotion recognition performances and secondary
520
variables 521
When the stimuli were neutral and the scale was Neutral, the best fit was achieved 522
using LEDD (R2 = .29, p = .008). 523
When the stimuli were neutral and the scale was Surprise, the best fit was achieved 524
using the on-dopa off-stim UPDRS III score (R2 = .27, p = .007) and x coordinate of the right 525
DBS electrode (R2 = .22, p = .005). 526
When the stimuli were happiness and the scale Happiness, the best fit was achieved 527
using the y coordinate of the right DBS electrode (R2 = .12, p = .048), x coordinate of the left 528
DBS electrode (R2 = .08 p = .02), preoperative on-dopa motor asymmetry index (R2 = .08, p = 529
.003), and Action (Verb) Fluency Task score (R2 = .03, p = .02). 530
When the stimuli were happiness and the scale was Surprise, the best fit was achieved 531
using the on-dopa off-stim UPDRS III score (R2 = .22, p = .02), off-dopa on-stim UPDRS III 532
score (R2 = .16, p = .03), and Action (Verb) Fluency Task score (R2 = .09, p = .04). 533
When the stimuli were fear and the scale was Fear, the best fit was achieved using the 534
MDRS score (R2 = .22, p = .02), on-dopa S&E score (R2 = .22, p = .008), x coordinate of the 535
right DBS electrode (R2 = .11, p = .04), on-dopa off-stim UPDRS III score (R2 = .03, p = .02), 536
number of categories in the MCST (R2 = .06, p = .02), and Action (Verb) Fluency Task score 537
(R2 = .03, p = .02). 538
When the stimuli were sadness and the scale Sadness, no significant results were 539
observed. 540
541 542
29 Table 6. Regions with decreased or increased glucose metabolism following STN DBS in 543
the patient group (n = 29), for each significant result 544 Emotion / Scale Regions MNI X coordinates MNI Y coordinates MNI z coordinates z value Voxel number neutral / Neutral Negative correlations:
Right cerebrum, frontal lobe, middle frontal gyrus (BA 6)
36 6 54 3.75 91
Positive correlations:
Right cerebellum, posterior lobe, Lobules VIII and VIIb
36 -44 -50 3.61 29*
sadness / Sadness
Negative correlations:
Right temporal lobe, superior temporal gyrus (BA 41)
54 -24 6 3.90 167
Right frontal lobe, inferior frontal gyrus (BA 45)
40 20 16 3.76 108
happiness / Happiness
Positive correlations:
Right temporal lobe, superior temporal gyrus, insula (BA 38)
44 8 -16 3.58 30*
fear / Fear
Negative correlations:
Left limbic lobe,
parahippocampal gyrus (BA 35)
-16 -10 -24 3.82 29*
Right cerebellum, anterior lobe of cerebellum, culmen, Lobules IV and V
26 -34 -26 3.79 36*
Note. Results for each emotion/Scale are ordered according to z score values. MNI: Montreal
545
Neurological Institute; BA: Brodmann area. p < .001 corrected. k > 70 for cortical structures. 546
k > 25* for subcortical and cerebellar structures. 547
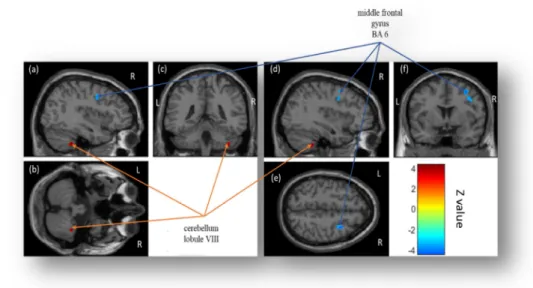
30 3.5 Relationship between recognition of emotional prosody and cerebral metabolic 548
results (Table 6 and Figs 3-6) 549
3.5.1 Model 1: Ratings on Neutral scale for neutral stimuli (Fig. 3)
550
Correlations between decreased cerebral glucose metabolism and increased ratings 551
after STN DBS (negative correlations) were observed in the right middle frontal gyrus 552
(Brodmann area, BA 6). Correlations between increased cerebral glucose metabolism and 553
increased ratings after STN DBS (positive correlations) were observed in the right posterior 554
lobe of the cerebellum (Lobules VIII and VIIb). 555
556
Figure 3. Statistical parametric maps displaying correlations between decreased 557
cerebral glucose metabolism and increased ratings (Images a, d, e and f) on the Neutral 558
scale when patients listened to neutral stimuli (in blue), and between increased cerebral 559
glucose metabolism and increased ratings (Images a, b, c and d) on the Neutral scale 560
when they listened to neutral stimuli (in red) after STN DBS. 561
562
Note. Significant differences (p < .001 corrected, k > 70 for cortical structures and k > 25 for
563
subcortical and cerebellar structures) are shown in three orthogonal views. R: right 564
hemisphere; L: left hemisphere. 565
31
3.5.2 Model 2: Ratings on Surprise scale for neutral stimuli
566
No significant correlations were observed. 567
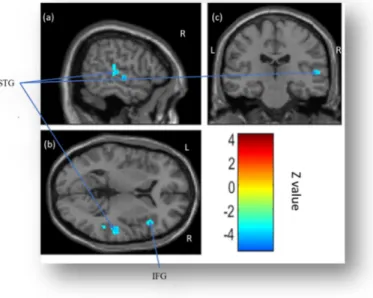
3.5.3 Model 3: Ratings on Sadness scale for sadness stimuli (Fig. 4)
568
Correlations between decreased cerebral glucose metabolism and increased ratings 569
after STN DBS (negative correlations) were observed in the right superior temporal gyrus 570
(BA 41) and right inferior frontal gyrus (IFG) (BA 45). No significant correlations were 571
observed between increased cerebral glucose metabolism and increased ratings after STN 572
DBS (positive correlations). 573
574
Figure 4. Statistical parametric maps displaying correlations between decreased 575
cerebral glucose metabolism and increased ratings (Images a, b and c) on the Sadness 576
scale when patients listened to sadness stimuli after STN DBS. 577
578
Note. Significant differences (p < .001 corrected, k > 70) are shown in three orthogonal views.
579
IFG: inferior frontal gyrus; L: left hemisphere; R: right hemisphere; STG: superior temporal 580
gyrus. 581
32
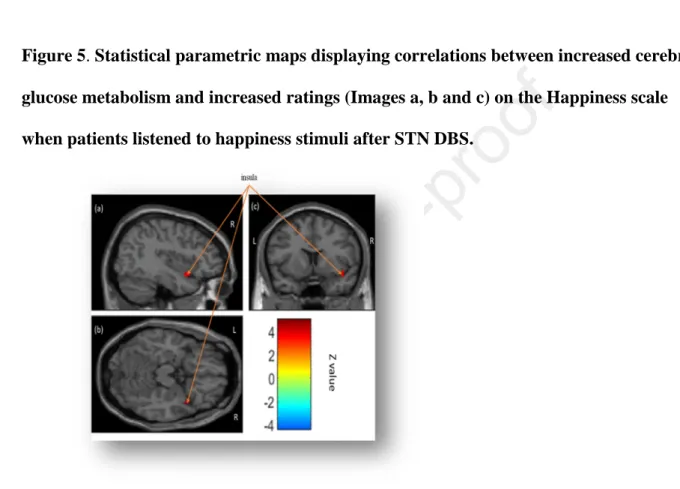
3.5.4 Model 4: Ratings on Happiness scale for happiness stimuli (Fig. 5)
583
No significant correlations were observed between decreased cerebral glucose 584
metabolism and increased ratings after STN DBS (negative correlations). Correlations 585
between increased cerebral glucose metabolism and increased ratings after STN DBS 586
(positive correlations) were observed in the right insula (BA 38). 587
588
Figure 5. Statistical parametric maps displaying correlations between increased cerebral 589
glucose metabolism and increased ratings (Images a, b and c) on the Happiness scale 590
when patients listened to happiness stimuli after STN DBS. 591
592
Note. Significant differences (p < .001 corrected, k > 70 for cortical structures and k > 25 for
593
subcortical and cerebellar structures) are shown in three orthogonal views. R: right 594
hemisphere; L: left hemisphere. 595
596
3.5.5 Model 5: Ratings on Surprise scale for happiness stimuli
597
No significant correlations were observed. 598
599 600
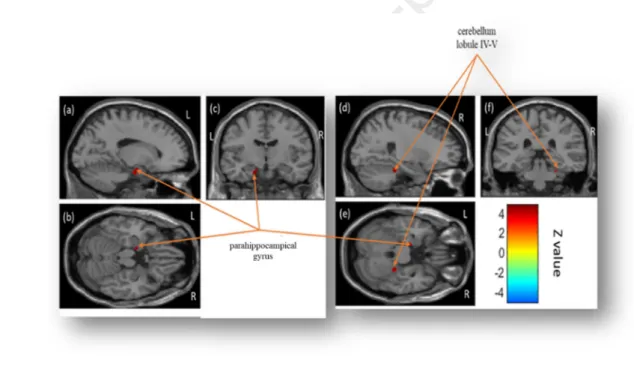
33
3.5.6 Model 6: Ratings on Fear scale for fear stimuli (Fig. 6)
601
No significant correlations were observed between decreased cerebral glucose 602
metabolism and increased ratings after STN DBS (negative correlations). Correlations 603
between increased cerebral glucose metabolism and increased ratings after STN DBS 604
(positive correlations) were observed in the right anterior cerebellum (Lobules IV and V) and 605
left parahippocampal gyrus (BA 35). 606
607
Figure 6. Statistical parametric maps displaying correlations between increased cerebral 608
glucose metabolism and decreased ratings (Images a, b, c, d, e and f) on the Fear scale 609
when patients listened to fear stimuli after STN DBS. 610
611
Note. Significant differences (p < .001 corrected, k > 70 for cortical structures and k > 25 for
612
subcortical and cerebellar structures) are shown in three orthogonal views. R: right 613
hemisphere; L: left hemisphere. 614
34 4 DISCUSSION
616
The aim of the present study was twofold: first, to investigate the effects of STN DBS 617
on the ability of patients with PD to recognize emotional prosody, and to correlate these 618
emotional prosody modifications with changes in cerebral glucose metabolism; second, to test 619
the impact of motor asymmetry on emotional prosody performances before and after DBS. 620
We therefore correlated the emotional prosody performances of 29 consecutive patients with 621
left- or right-sided PD motor symptoms who underwent STN DBS in pre- versus 622
postoperative conditions with modifications in cerebral glucose metabolism, as assessed with 623
18
FDG-PET. 624
Based on Péron et al. (2013)’s model, we expected to observe impaired emotional 625
prosody recognition in the postoperative condition. These emotional modifications following 626
STN DBS would be correlated with glucose metabolism modifications in the cerebral network 627
that subtends emotional prosody, namely, the orbitofrontal cortex (OFC), IFG, auditory 628
cortex, basal ganglia, amygdala, and posterior cerebellum. In the light of Stirnimann et al. 629
(2018)'s results, we predicted that these emotional effects would be driven by a specific 630
subgroup of patients characterized by more left-sided motor symptoms (i.e., with greater right 631
hemispheric brain dysfunction). Results partially confirmed these hypotheses, but also 632
revealed patterns of effects that were more complex than expected. An interaction between 633
STN DBS and motor lateralization had a differential impact on the performances of LPD and 634
RPD patients, resulting in two main patterns of effects. 635
4.1 Dichotomization of effects 636
The behavioral results could be grouped into two patterns of effect. 637
The first pattern was characterized by performances that seemed to normalize 638
postoperatively. This was the case for ratings on the target scales when participants listened to 639
35 neutral, happiness or anger stimuli, as well as on the nontarget Surprise scale when
640
participants listened to happiness stimuli. These effects were driven by the performances of 641
the LPD subgroup. 642
The second pattern was characterized by a postoperative deterioration in the ability to 643
recognize emotional vocal expressions, characterized by comparable performances across the 644
control and PD groups in the preoperative condition, but significantly different performances 645
in the postoperative condition for ratings on the Fear scale when participants listened to fear 646
stimuli. This effect was driven by the performances of the RPD subgroup. 647
As far as cognitive-metabolic correlations are concerned, interesting and partly 648
predicted results emerged. We found predicted correlations between modifications in 649
emotional prosody recognition and metabolic modifications in the right IFG, superior 650
temporal gyrus, insula and posterior cerebellum. However, the involvement of the left 651
perirhinal cortex (BA 35) and right middle frontal gyrus (BA 6) had not been predicted. 652
653
4.2 Differential impact of STN DBS according to motor symptom asymmetry 654
Overall, we observed that patients in the LPD subgroup exhibited a vocal emotional 655
impairment in the preoperative condition for neutral, sadness and happiness stimuli that STN 656
DBS seemed to normalize. By contrast, the surgery seemed to have a deleterious effect on 657
fear recognition abilities in the RPD subgroup of patients. 658
From our point of view, this pattern of results, while partly unexpected, can still be 659
interpreted in the context of Péron et al. (2013)’s model, and even seems to reinforce it. 660
Accordingly, RPD patients, who did not show any emotional impairment prior to surgery, 661
owing to the right hemispheric specialization of the basal ganglia during vocal emotion 662
processing (Stirnimann et al., 2018), developed emotional impairment in the wake of DBS. 663
Just as dopatherapy can create an overdose effect on functionally intact circuits, so STN DBS 664
36 can desynchronize the limbic loop while at the same time re-synchronizing the activity of the 665
motor loop, as predicted by Péron et al. (2013)'s model. By contrast, LPD patients did display 666
vocal emotional impairment prior to surgery (in line with Stirnimann et al., (2018), but STN 667
DBS seemed to normalize this deficit, through the functional re-synchronization of the limbic 668
loop, thereby restoring the necessary cerebral and cerebellar interactions needed for intact 669
vocal emotion processing. 670
The present results corroborate the notion of hemispheric specialization of the STN 671
during vocal emotion decoding, suggesting that the right STN plays a role in emotional 672
prosody processing. This is in line with three studies in patients with PD (Garrido-Vasquez et 673
al., 2013; Stirnimann et al., 2018; Ventura et al., 2012) that demonstrated an emotional 674
prosody processing impairment in LPD but not in RPD, compared with HC. It is also 675
congruent with a neuroimaging study in HC (Kotz et al., 2003) that reported right but not left 676
basal ganglia activation by emotional prosody. Finally, our results are in line with two 677
intracranial event-related potential studies among patients with PD who had undergone DBS 678
that revealed heightened neural activity at the spike (Eitan et al., 2013) and local field 679
potential (Péron et al., 2017) levels in the right ventral STN, in response to emotional versus 680
neutral auditory material. STN DBS appears to have a differential impact, depending on the 681
lateralization of patients’ motor symptoms and their baseline emotion perception abilities. The 682
metabolic results seem to go in the same direction, as we observed that the pattern of effects 683
primarily involving modifications in the RPD subgroup’s performances (worsening) 684
correlated with metabolic modifications in the left hemisphere (i.e., parahipppocampal gyrus), 685
while the pattern of results mainly involving modifications in the LPD subgroup’s 686
performances (improvement) correlated with metabolic modifications solely in the right 687
hemisphere. 688
37 Accordingly, we believe that the literature in this domain should be reread in the light 689
of these new findings, and it may be that the divergent results that have sometimes been 690
reported, and which have fueled virulent debates in the scientific community (Péron, 2014), 691
can be attributed to the fact that analyses are generally conducted for the whole group, even 692
though the patients in question are actually quite heterogeneous. We observed an effect of 693
DBS on emotional prosody recognition at the subgroup level, and we can assume that studies 694
suggesting that there is no post-DBS effect are those that fail to take motor lateralization at 695
disease onset into account, thereby inducing a noneffect. For instance, a recent study 696
concluded that after STN DBS, the ability to recognize emotional prosody remains intact, and 697
only fear production is impaired (Jin et al., 2017). It is interesting to note that its results at the 698
whole group level were almost the same as ours (compare Supplementary Material Fig. SI 2 699
in this article with Fig. 1b in Jin et al., 2017). Had these authors analyzed their data separately 700
according to motor lateralization, we can speculate that the patterns of results would have 701
been different. Future studies should distinguish between patients on the basis of their motor 702
lateralization. 703
4.3 Specificity of the emotions affected and potential STN involvement in embodiment 704
processes 705
The question of the specificity of the emotions affected remains to be addressed. Why 706
does the recognition of some emotions deteriorate (here, fear) and that of others improve 707
(here, anger, happiness, neutral and sadness)? Our study was not designed to answer this 708
question, but previous results can shed light on it, notably regarding neutral emotion. 709
The case of neutral is very interesting. Our results replicated Mondillon et al. (2012)’s 710
results for the recognition of neutral, but unfortunately this study did not distinguish between 711
LPD and RPD patients. When Mondillon et al. (2012) explored the recognition of facial 712