HAL Id: hal-02988416
https://hal.sorbonne-universite.fr/hal-02988416
Submitted on 4 Nov 2020
HAL is a multi-disciplinary open access
archive for the deposit and dissemination of
sci-entific research documents, whether they are
pub-lished or not. The documents may come from
teaching and research institutions in France or
abroad, or from public or private research centers.
L’archive ouverte pluridisciplinaire HAL, est
destinée au dépôt et à la diffusion de documents
scientifiques de niveau recherche, publiés ou non,
émanant des établissements d’enseignement et de
recherche français ou étrangers, des laboratoires
publics ou privés.
Rate upon Translation Inhibition
Qing Zhang, Elisa Brambilla, Rui Li, Hualin Shi, Marco Cosentino
Lagomarsino, Bianca Sclavi
To cite this version:
Qing Zhang, Elisa Brambilla, Rui Li, Hualin Shi, Marco Cosentino Lagomarsino, et al.. A Decrease
in Transcription Capacity Limits Growth Rate upon Translation Inhibition. mSystems, 2020, 5 (5),
�10.1128/mSystems�. �hal-02988416�
A Decrease in Transcription Capacity Limits Growth Rate upon
Translation Inhibition
Qing Zhang,a* Elisa Brambilla,aRui Li,bHualin Shi,b,c Marco Cosentino Lagomarsino,d* Bianca Sclavia*
aLBPA, UMR 8113 CNRS, ENS Paris-Saclay, Cachan, France
bCAS Key Laboratory of Theoretical Physics, Institute of Theoretical Physics, Chinese Academy of Sciences, Beijing, China cSchool of Physical Sciences, University of Chinese Academy of Sciences, Beijing, China
dLCQB, UMR 7238 CNRS, Sorbonne Université, Paris, France
ABSTRACT In bacterial cells, inhibition of ribosomes by sublethal concentrations of antibiotics leads to a decrease in the growth rate despite an increase in ribosome content. The limitation of ribosomal activity results in an increase in the level of ex-pression from ribosomal promoters; this can deplete the pool of RNA polymerase (RNAP) that is available for the expression of nonribosomal genes. However, the magnitude of this effect remains to be quantified. Here, we use the change in the activity of constitutive promoters with different affinities for RNAP to quantify the change in the concentration of free RNAP. The data are consistent with a signifi-cant decrease in the amount of RNAP available for transcription of both ribosomal and nonribosomal genes. Results obtained with different reporter genes reveal an mRNA length dependence on the amount of full-length translated protein, consis-tent with the decrease in ribosome processivity affecting more strongly the transla-tion of longer genes. The genes coding for the  and ’ subunits of RNAP are among the longest genes in the Escherichia coli genome, while the genes coding for ribosomal proteins are among the shortest genes. This can explain the observed de-crease in transcription capacity that favors the expression of genes whose promoters have a high affinity for RNAP, such as ribosomal promoters.
IMPORTANCE Exposure of bacteria to sublethal concentrations of antibiotics can lead to bacterial adaptation and survival at higher doses of inhibitors, which in turn can lead to the emergence of antibiotic resistance. The presence of sublethal con-centrations of antibiotics targeting translation results in an increase in the amount of ribosomes per cell but nonetheless a decrease in the cells’ growth rate. In this work, we have found that inhibition of ribosome activity can result in a decrease in the amount of free RNA polymerase available for transcription, thus limiting the pro-tein expression rate via a different pathway than what was expected. This result can be explained by our observation that long genes, such as those coding for RNA polymerase subunits, have a higher probability of premature translation termination in the presence of ribosome inhibitors, while expression of short ribosomal genes is affected less, consistent with their increased concentration.
KEYWORDS antibiotic, transcription, translation
B
acteria often encounter sublethal levels of antibiotics produced by other microor-ganisms in their environment. A decrease in growth rate under these conditions can allow a strain to survive long enough until the inhibitor is no longer present or, in some cases, until the bacteria become resistant to the antibiotic via the selection of preexisting mutations or an increase in mutation rates (1–4). However, the mechanistic details of these response pathways often remain to be described. The cellular response to the limitation of translation activity is thought to be related to the pathway involvedCitation Zhang Q, Brambilla E, Li R, Shi H,
Cosentino Lagomarsino M, Sclavi B. 2020. A decrease in transcription capacity limits growth rate upon translation inhibition. mSystems 5: e00575-20.https://doi.org/10.1128/mSystems .00575-20.
Editor Zackery Bulman, University of Illinois at
Chicago
Copyright © 2020 Zhang et al. This is an
open-access article distributed under the terms of theCreative Commons Attribution 4.0 International license.
Address correspondence to Bianca Sclavi, [email protected]. * Present address: Qing Zhang, CAS Key Laboratory of Theoretical Physics, Institute of Theoretical Physics, Chinese Academy of Sciences, Beijing, China; Marco Cosentino Lagomarsino, IFOM, FIRC Institute of Molecular Oncology, Milan, Italy, and Dipartimento di Fisica, Università degli Studi di Milano and INFN, Milan, Italy; Bianca Sclavi, LCQB, UMR 7238 CNRS, Sorbonne Université, Paris, France.
Inhibition of ribosome activity can result in a decrease in the amount of free RNA polymerase available for transcription, limiting the protein expression rate and thus the growth rate via a different pathway than what would be expected.
Received 1 July 2020 Accepted 31 July 2020 Published
Molecular Biology and Physiology
crossm
8 September 2020
on November 4, 2020 by guest
http://msystems.asm.org/
in the stringent response, the regulatory mechanism that decreases ribosome produc-tion in response to a decrease in amino acid availability. This is mediated by the change in concentration of the secondary messenger molecule, (p)ppGpp, that is produced by the RelA enzyme when the pool of amino acids decreases and ribosomes are not loaded with charged tRNAs (5, 6). ppGpp can directly inhibit ribosome assembly (7, 8) and the activity of RNA polymerase (RNAP) at ribosomal promoters while increasing the activity of the promoters of genes for amino acid biosynthesis (9). The transcription of ribosomal operons can use a large fraction of the free RNA polymerase pool in the cell because of the high affinity of the ribosomal promoters for the enzyme and a high frequency of transcription initiation. Therefore, the regulation of ribosomal promoter activity can be a means by which the pool of free RNA polymerase can be repartitioned between ribosomal operon transcription and nonribosomal mRNA synthesis. This has been referred to as the “passive control” of transcription regulation (10–14).
The ppGpp-dependent feedback loop also plays a role in the regulation of ribosome content as a function of growth rate (15–17). Growth rate-dependent regulation of gene expression determines the allocation of cellular resources between the produc-tion of ribosomes and that of other proteins and results in a linear increase in ribosome content with increasing growth rate (15, 18–20). In richer growth media, when the amount of amino acids is higher, ppGpp levels are lower, favoring ribosome production and a higher fraction of active ribosomes (16). In poorer media, it is the inverse: accumulation of ppGpp slows down the production of new ribosomes, and a smaller fraction of the ribosome pool is in an active form (19).
When ribosome activity is inhibited by sublethal concentrations of antibiotics, amino acids are used more slowly and their concentration increases, which can result in a decrease in the intracellular ppGpp pool (5). The cellular response, as predicted by the ppGpp feedback loop, is to produce a larger amount of ribosomes and an increased translation rate; however, despite this increase, the cell’s growth rate is reduced (18, 19). This has been proposed to result from a decrease in the resources available for the production of nonribosomal proteins that become limiting for cellular metabolism (18). More recent results point to a decrease in the fraction of active ribosomes to explain the decrease in the total protein production rate (19, 21).
To measure the effect that the inhibition of ribosome activity can have on gene expression resulting from a possible repartition of RNAP, we have compared the activity of a ribosomal promoter to that of constitutive promoters with different affinities for RNAP. This approach stems from a well-established protocol developed by Hans Bremer and coworkers of using quantitative measurements of changes in constitutive and ribosomal promoter activity as reporters of changes in the amount of free RNAP and of ppGpp (22–25).
In parallel, we analyzed transcriptomics and proteomics data from the literature on the direct and indirect effects of changing ppGpp concentration and translation limitation on gene expression (26, 27). The results from this analysis are consistent with a linear decrease with decreasing growth rate in the concentration of free RNAP available for promoter binding and transcription. We propose a model that can explain this decrease in transcriptional activity based on the observation that gene length and a gene’s operon position can be an important parameter on the change in protein expression in the presence of sublethal levels of chloramphenicol and that two of the four proteins composing the core of RNAP are two of the longest gene products in the Escherichia coli genome that, in addition, are found within the same operon.
RESULTS
Transcription regulation by ppGpp does not suffice to explain gene expression changes with increasing translation inhibition by chloramphenicol. In order to
measure the effect of increasing ribosome inhibition on RNAP repartition between ribosomal and nonribosomal promoters, we have chosen three reporter cassettes. The first contains a shortened version of the well-characterized rRNA operon promoter rrnBP1, here called P1, that includes the sequence from ⫺69 to ⫹6 relative to the
on November 4, 2020 by guest
http://msystems.asm.org/
transcription start site (28). The binding sites for Fis and the higher-affinity H-NS binding site are thus omitted from this construct. This promoter has a GC-rich discrim-inator region at the transcription initiation site that makes the open complex sensitive to changes in negative supercoiling and to inhibition by ppGpp (see Table S1 in the supplemental material) (24, 29, 30). The second promoter used here is a constitutive promoter, P5, that has consensus⫺10 and ⫺35 sequences and no discriminator region. The third is PLtet, also a strong constitutive promoter with no discriminator region but with a lower affinity for RNA polymerase due to a nonconsensus⫺10 sequence (31) (Table S1). Bremer and coworkers have shown that the activity of the rrnBP1 promoter is inversely proportional to the concentration of ppGpp in vivo (24) and that the activity of constitutive promoters can be used to estimate the amount of free RNA polymerase in the cell (22, 24). Each of these promoters was placed upstream of the gfpmut2 gene, and this cassette was inserted in the chromosome together with a kanamycin resis-tance gene expressed divergently from the chosen promoter (see Fig. S1 in the supplemental material). Growth of these strains in a 96-well plate allowed us to measure the changes in growth rate, the green fluorescent protein (GFP) concentration, and the resulting GFP production rate (Gpr) as a function of chloramphenicol concen-tration (Fig. 1 and Fig. S1). We compared four different growth media, M9 with glucose (M9-glu), M9 with glycerol (M9-gly), and these two media supplemented with Casamino Acids (cAA). This results in four different growth rates. Furthermore, it has already been shown that cells growing in a growth medium containing amino acids have a lower concentration of ppGpp (16, 24), allowing us to compare the effects due to changing concentrations of this key metabolite without the use of mutant strains that can result in secondary effects on cell metabolism due to the multiple targets of ppGpp (8, 32). In the absence of translation inhibition, the change in promoter activity measured as a function of growth rate is consistent with previous measurements on constitutive promoters and rrnBP1-derived promoters (11, 28, 33) (Fig. 1A). The concentration of GFP from the constitutive promoters tends to decrease at the higher growth rates, due to their lack of specific growth rate-dependent regulation and the increased dilution rate (34), while the concentration of GFP expressed from the rrnBP1 promoter increases with growth rate until the last point, where Fis activation, absent in this construct, has been shown to be required for continued increased expression (28). The PLtet promoter has a lower affinity for RNAP than P5 does (see below); however, when RNAP binds at the PLtet promoter, it initiates transcription with a higher frequency than at P5 (31), resulting in a higher promoter activity and consequently a higher GFP concentration (Fig. 1A).
Previous work has shown that as the concentration of chloramphenicol is increased, the total RNA content relative to the total protein mass increases—reflecting the increase in rRNA—and the concentration of a reporter protein expressed from a constitutive promoter decreases (18). Therefore, the expected result here is that the GFP concentration from a rRNA promoter (P1) should increase while the concentration from a constitutive promoter (P5 or PLtet) should decrease, with the lower-affinity constitutive promoter (PLtet) decreasing at a higher rate if increasing amounts of RNAP are being used for transcription of ribosomal operons. The comparison of P1 and PLtet agrees with this prediction. Unexpectedly, however, for the P1 and P5 promoters, the patterns of change in GFP production rate and GFP concentration are very similar (Fig. 1 and Fig. S2).
The pattern of the change of expression for these two promoter constructs depends strongly on whether the growth medium contains Casamino Acids, independently of the carbon source. In the absence of cAA, the increase in GFP concentration as a function of chloramphenicol (Cm) is significantly greater than in their presence (Fig. 1). Increased expression from the P1 promoter in the growth media lacking cAA would be expected from a decrease in ppGpp as a result of increased amino acid pools due to ribosome inhibition; the P5 promoter on the other hand does not contain the GC-rich discriminator region and is not expected to show increased activity upon a decrease in ppGpp. ppGpp, however, is also known to negatively regulate the activity of ribosomes
on November 4, 2020 by guest
http://msystems.asm.org/
and the overall translation rate as well as the transcription elongation rate (7, 8, 21); therefore, a decrease in ppGpp in the growth media lacking cAA is expected to lead to an increase in translation rate, irrespective of the promoter sequence. The similar increase in GFP concentration of these two different promoters thus points to a stronger effect of ppGpp on GFP expression at the level of translation and transcription elongation of the gfpmut2 gene rather than at the transcription initiation level. In summary, regulation of transcription initiation by ppGpp cannot solely explain the change in GFP expression from different promoters with increasing sublethal levels of chloramphenicol. However, the shared increase in GFP concentration observed for both the P1 and P5 promoters is consistent with an overall increase in the translation rate, as observed previously in these experimental conditions (19, 21).
A decrease in free RNAP concentration with increasing translation inhibition by chloramphenicol. Since the translation rate of GFP is shared by the three promoter
FIG 1 Promoters with different affinities for RNAP react differently to translation limitation. (A) Change in GFP concentration (relative fluorescence units [RFU] of GFP/OD610) as a function of growth rate (in
doublings per hour). Four growth media were used, from the slowest to the fastest: M9-glycerol, M9-glucose, M9-glycerol⫹Casamino Acids, M9-glucose⫹Casamino Acids. P5 and PLtet are both consti-tutive promoters with different affinities for RNAP, while P1 is a shortened version of the rrnBP1 rRNA promoter with a RNAP affinity similar to P5 but regulated by ppGpp. (B) Change in GFP concentration as a function of increasing concentration of chloramphenicol in the four growth media. The growth media with Casamino Acids (cAA) are shown in red, and the ones without Casamino Acids are in green. The four points correspond to 0, 2, 4, and 8M final chloramphenicol concentration as noted next to the data points. The error bars represent the standard errors of the means (SEM) from 3 independent experiments. The error bars smaller than the symbols are not shown. Comparison of the panels shows that ppGpp regulation at the transcriptional level alone cannot account for the change in GFP expression in response to translation limitation.
on November 4, 2020 by guest
http://msystems.asm.org/
constructs, it is possible to obtain an estimate of the magnitude of the promoter-specific effect of ppGpp, and of changes in free RNAP, on the transcription rate by measuring the ratios of GFP production rates. This operation “cancels out” the trans-lation component of gene expression and isolates the transcription-specific effect as the ratio of promoter activities (see Materials and Methods). Figure 2A shows the change in the ratios of promoter activities as a function of growth rate in the absence of chloramphenicol. The ratio of P1 to P5 rates increases rapidly between M9-glu and M9-cAA-gly, consistent with a lower level of ppGpp in the cells growing in the presence of cAA (24) increasing the probability of transcription initiation specifically from P1.
In the presence of Cm, the fold increase of gene expression from P1 is greater than the one of P5 in the cells that are grown without cAA, consistent with a decrease in ppGpp levels by the addition of the antibiotic (Fig. 2C). As the Cm concentration is increased further, the difference between the two promoters decreases again to the initial level. On the other hand, in the growth media with cAA, and thus lower levels of ppGpp, the P1-to-P5 ratio decreases, indicating that the change in GFP production rate from P1 is lower than that of P5 as a function of increasing Cm. A similar result is also observed for the PLtet-to-P5 ratio, this time independently of either the carbon source or amino acid content (Fig. 2B).
The comparison of two constitutive promoters with differing affinities for RNAP can be used to estimate the change in the amount of free RNAP that is available for transcription in vivo (24, 35). Since PLtet has a lower affinity for RNAP than P5, if the free FIG 2 Ratios of promoter activities for the different promoters can be used to estimate the changes in the concentration of free RNAP. (A) Ratio of PLtet to P5 and P1 to P5 as a function of growth rate (in doublings per hour). (B) Ratio of PLtet to P5 with increasing chloramphenicol concentration. (C) Ratio of P1 to P5 with increasing chloramphenicol concentration. (D) Estimated decrease in the concentration of free RNAP from the change in the ratios of promoter binding as a function of chloramphenicol concentration. To obtain this estimate, the relative activity of the promoters as a function of free RNAP concentration (cf) was obtained from the respective RNAP binding constants, Ki僆 {K1, K5, KLtet} using cf/
(Ki⫹ cf). The constant K5is determined by fitting the data obtained in the absence of Cm from our
experiments and the amount of free RNAP obtained from the literature (34) (see Materials and Methods).
K1and KLtetwere derived by the formula K5exp(ΔE), where ΔE is the difference between the binding
energies of RNAP with P1 (or PLtet) and P5 (see Materials and Methods). The black vertical bars indicate the concentrations of free RNAP that give the measured promoter activity ratios shown in panel B for different Cm concentrations, shown above the plot. The ratio of PLtet and P5 promoter activities for example is obtained by taking the ratio of GFP production rates (Gpr): Gpr(PLtet)/Gpr(P5)⫽ a(K5⫹
cf)/(KLtet⫹ cf), where a is a scaling factor. K5and a were fixed by fitting the data in the absence of Cm
from our experiments and the literature (34) (see Materials and Methods). Data from the cells growing in cAA-glu was used so that ppGpp-dependent regulation of P1 is small and can be ignored. Fig. S2A and B in the supplemental material shows the estimation of RNAP concentration for the four growth media used. Fig. S2C and D shows an estimation of the change in ppGpp as a function of chloramphenicol concentration.
on November 4, 2020 by guest
http://msystems.asm.org/
RNAP concentration increases, the ratio of promoter activities of PLtet and P5 will increase when the amount of free RNAP is within a range of concentrations that span the dissociation constant of PLtet (Fig. 2D). In this same range of concentrations, the binding of RNAP to P5 will change by a smaller amount, since the higher affinity of this promoter means that it will be almost at saturation. This is indeed what is observed in the data as a function of growth rate in the absence of Cm (Fig. 2A), in agreement with the previous estimates of the change in free RNAP as a function of doubling time (23, 34).
The change in activity of the promoters as a function of free RNAP concentration (cf)
can be obtained from the respective RNAP binding constants, Ki僆{K1, K5, KLtet} using
cf/(Ki⫹ cf). The differences in binding affinity for each promoter can be estimated based
on a statistical-mechanical selection model developed by Berg and von Hippel (36) where ΔE is the difference between the binding energies (see Text S1 in the supple-mental material). If one of these affinity constants is known, one can then use these calculations to estimate the other two. The affinity of RNAP for P5 in terms of RNAP concentration can be obtained from fitting the change in the Gpr(PLtet)/Gpr(P5) ratio as a function of growth rate from our experimental data (Fig. 2A and Fig. S3A) with the following equation, Gpr(PLtet)/Gpr(P5) ⫽ a(K5 ⫹ cf)/(KLtet⫹ cf), where a is a scaling
factor that accounts for the difference in transcription initiation frequency, and the RNAP concentration at the different growth rates is obtained from a previous study (34) (see Materials and Methods).
Figure 2D shows the estimated binding curves for RNAP to each promoter; the vertical bars indicate the ratio of promoter activity that corresponds to the values measured experimentally (Fig. 2B). The Cm concentration for each of these ratios is shown on the top x axis. The positions of these black vertical bars relative to the x axis indicate the concentrations of free RNAP.
Because of their different affinities for RNAP, the decrease in free RNAP with increasing chloramphenicol has a stronger effect on PLtet first, then on P1, and finally on P5. Note that in order for the ratios obtained from the experimental results to be coherent with the RNAP binding curves, the P5 promoter needs to be nearly saturated by RNAP in the absence of Cm, consistent with the high affinity of the interaction resulting from the consensus⫺10 and ⫺35 sequences of this promoter. This simple model of RNAP-dependent capacity can explain the data in Fig. 2B on the change in the PLtet-to-P5 ratio.
Therefore, from the values of the RNAP affinities for the two constitutive promoters, PLtet and P5, and the relative changes in promoter activity, it is possible to estimate the change in the amount of free RNAP in the cells as a function of increasing translation limitation. Figure S2 in the supplemental material shows the estimation of RNAP concentration obtained for the four growth media used here.
Using the ratio of the promoter activities of P1 and P5, it is possible to estimate the change in ppGpp as a function of growth rate and as a function of Cm (Fig. S2), in a fashion similar to the approach validated by Bremer and colleagues (24).
In summary, the changes in transcription activity measured by the decrease in the PLtet-to-P5 and P1-to-P5 ratios are in line with a decrease in free RNAP concentration. This decrease is independent of a ppGpp-mediated repartition between ribosomal and nonribosomal promoters, since it can be observed to the same extent in the growth media with and without cAA (Fig. 2B and Fig. S3), which have been previously shown to result in different ppGpp levels in the cell (16).
The decrease in ribosome processivity by chloramphenicol reduces the expres-sion of longer genes more than shorter ones. A possible cause for the decrease in
the pool of free RNAP independently of the changes in ppGpp is a decrease in the total amount of RNAP per cell. The RNA polymerase holoenzyme is composed of five subunits:, =, , two copies of ␣, and a factor. rpoB and rpoC, coding for  and =, are among the longest genes in E. coli with a length of 4,029 bp and 4,224 bp, respectively (the average gene length in E. coli is about 900 bp [see Fig. S6]).
on November 4, 2020 by guest
http://msystems.asm.org/
The processivity of translation, the probability of the ribosome reaching the end of the gene before stalling and falling off, has been shown to decrease exponentially with increasing gene length (37). We reasoned that if, in addition, ribosome processivity is decreased by an inhibitor, then the probability to finish the translation of a long gene would be lowered even more compared to a shorter gene, decreasing the rate of expression of the longer gene to a greater extent in the presence of translation inhibitors.
From the known values for the affinity of ribosomes for chloramphenicol, we derived a model to calculate the probability Phitthat a ribosome will be “hit” by chloramphen-icol before reaching the end of a mRNA of a given length (as described by Dai et al. [19] [see details in Text S1]). Ribosome stalling leads to the nonsymmetric degradation of mRNA and stops further translation by other ribosomes. The following equation can be used to describe the dependence of Phiton protein length, i.e.,
Phit⫽ 1 ⫺ exp
共
⫺kon[Cm]L ⁄ v兲
(1)where kondenotes the binding constant of Cm with ribosome [kon⫽ 0.034 (M·min)⫺1 (38)], L indicates protein length, and v is the translation elongation rate dependent on the RNA/protein mass ratio (Text S1).
To test this model, we compared the changes in gene expression from the same constitutive promoter, P5, of two different genes, gfpmut2 (714 bp), and lacZ (3,072 bp), in the presence of increasing chloramphenicol concentrations (Fig. 3A). Using equation 1, it is possible to estimate an order of magnitude of the effect of the antibiotic. At 8M Cm (the highest concentration used here), Phitis 23% for LacZ (1,024 amino acids [aa]), while for GFP, it is 6% (238 aa).
The experimental results show that while the concentration of GFP increases as a function of Cm concentration,-galactosidase concentration decreases (Fig. 3A). Fig-ure 3B shows the change in the ratio of the shorter protein to the longer protein as a function of Cm concentration. The black line shows the fit obtained to the model of ribosome processivity. These results therefore indicate that a gene’s length, in addition to its promoter’’s affinity for RNAP, can influence how its expression levels change in the presence of sublethal concentrations of ribosome inhibitors and could thus explain a possible mechanism that leads to decreased RNAP availability.
By the same mechanism, increased probability of ribosomes stalling in the presence of chloramphenicol can also lead to degradation of a whole operon’s RNA, so that genes that are found farther downstream from the transcription start site have a higher probability of not being translated than those at the beginning of the operon. A recent study has shown this to be the case for the genes within the lac operon and those in the ribosomal protein operons S10 and Spc (21). The rpoB and rpoC genes follow each other within the same operon, which can result in a further decrease in the expression of the downstream gene.
FIG 3 Gene length can influence gene expression under translation limitation. (A) Change in GFP (238 aa) and-galactosidase (1,024 aa) expressed from the P5 promoter as a function of increasing chlor-amphenicol concentration. The bacteria were grown in M9 with glucose plus cAA with chlorchlor-amphenicol (Cm) at concentrations of 0, 2M, 4 M, or 6 M in flasks. The concentrations were normalized by dividing the data by the point without Cm. (B) Fit of the model to the ratio of GFP to-galactosidase concentrations from the data in panel A. The growth rate at each chloramphenicol concentration is the average over the two strains. The error bars correspond to the SEM from three independent experiments.
on November 4, 2020 by guest
http://msystems.asm.org/
A decrease in translation processivity can result in decreased expression of late operon genes. In order to obtain a quantitative measure of the effect of operon
position on gene expression in the presence of translation limiting antibiotic concen-trations, we have measured the expression of two fluorescent reporter proteins, red fluorescent protein (RFP) and GFP, whose genes have been placed within the same operon, where the rfp gene is upstream of the gfp gene (Fig. 4). Increasing Cm results in a decrease in the GFP-to-RFP ratio, consistent with increased polarity effects leading to premature transcription termination (21) and to degradation of the operon mRNA decreasing the expression of GFP when a ribosome translating the upstream RFP gene is inhibited by chloramphenicol. These results can be reproduced by a model using the parameter values for the probability of translation termination obtained from the com-parison in GFP versus LacZ translation (Fig. 3) (see Text S1 for the details of the model). The insertion of terminators of different efficiencies between the two genes can be used to test for the role of an interaction between RNAP and the leading ribosome in affecting the probability of transcription termination (39) (Text S1). The presence of a ribosome trailing the RNAP inhibits formation of the hairpin and therefore of transcrip-tion terminatranscrip-tion. The results obtained here show that the decrease in the GFP-to-RFP ratio by chloramphenicol is independent of the presence and efficiency of the termi-nator of the two genes (Fig. 4B and Fig. S8). Therefore, at these low Cm concentrations, the probability of decoupling of transcription and translation, of hitting the first translating ribosomes, is not significant enough to result in increased transcription arrest by the folding of the hairpin loop of the terminator.
Finally, in light of these results we have also analyzed data from a previously published proteomics study that measured protein fractional abundance as a function of increasing sublethal chloramphenicol concentration for a set of more than 1,000 E. coli proteins (26). We have found that by itself RNAP affinity for a given promoter is not a predictor of whether the expression of a gene will increase or decrease under translation limitation. This is because RNAP affinity for a promoter is not only dictated by the promoter’s sequence but also by the presence of possible transcription factors. It is interesting to note however that ribosomal promoters all have a higher than average affinity for RNAP, independently of the activity of their transcription activator Fis whose activity is dependent on growth rate and growth phase (Fig. S6).
The data set from Hui et al. (26) was also used to determine whether gene length could be a predictor of changes in gene expression under translation limitation (Fig. S6). Once the short ribosomal genes have been omitted from the set, gene length
FIG 4 Operon position can influence gene expression under translation limitation; however, it is independent of transcription-translation coupling. (A) Sketch for GFP and RFP fused in an operon with an intergenic terminator of efficiency y (see the details of the construction in reference 39) and the formula of the expression ratio of GFP to RFP. When the efficiency y is zero, it corresponds to the case without intergenic terminator (see “no ter” in panel B). (B) The expression ratio between downstream GFP and upstream RFP [in the units of RFU(GFP)/RFU(RFP)], as a function of growth rate decreases with increasing Cm concentration. The experimental ratios (symbols) are fit with the same model (lines) on ribosome stalling-induced mRNA degradation used to describe the difference between-gal and GFP expression in Fig. 3 (see supplemental material). “no ter” and “ter 1 to 4” correspond to terminator sequences of increasing efficiency that can be used to estimate the contribution of transcription-translation coupling (“I21” [no terminator], “R9,” “R17,” “W13,” and “R32,” respectively, in reference 39). The cells were grown in M9 minimal medium containing glucose. Cm was added to a final concentration of 0, 2, or 4M.
on November 4, 2020 by guest
http://msystems.asm.org/
by itself is not enough to predict changes of gene expression, likely due to compen-satory effects from differing promoter affinities for RNAP. However, when the expres-sion of genes within the same operon, and thus likely to share the same promoter, is compared, we see that on average a downstream gene within an operon decreases more in expression than the genes found upstream within the same operon in the presence of increasing levels of chloramphenicol (Text S1 and Fig. S7).
DISCUSSION
A linear decrease in transcription capacity with increased translation limita-tion. Here, we have used the approach developed by Hans Bremer and colleagues
(22–25), using the comparison of the activity of promoters with different RNAP affinities to estimate the changes in the amount of free RNA polymerase under translation limiting conditions. When the growth rate is varied by using growth media with different nutrient content, the data are consistent with a decrease in the amount of free RNAP with decreasing growth rate (Fig. 2A), in agreement with previous estimates (34). However, the decrease in free RNAP when growth rate decreases due to increasing translation limitation has a steeper, linear slope (Fig. 2B; see also Fig. S2 in the supplemental material), suggesting that a decrease in transcription capacity could limit the maximum growth rate under these conditions.
Perhaps surprisingly, the translation rate increases in the presence of sublethal levels of antibiotics targeting ribosomes (Fig. S8) (19). This can result from a decrease in ppGpp relieving the inhibition it has on ribosome assembly and activity, thus activating the subpopulation of ribosomes that is stored in an inactive state (7, 8, 19, 40–43). The higher increase in translation rate in the growth media without cAA is consistent with a larger fraction of inactive ribosomes in the cells growing at these lower growth rates that can be quickly reactivated by a decrease in ppGpp concentration, not only for rapid adaptation to changes in local nutrient content but also to respond to the presence of growth inhibitors (19, 40–43). In rich growth media, when ppGpp levels are low, the potential of the cell to increase its translation capacity to respond to the presence of the inhibitor is limited by the smaller fraction of inactive ribosomes. In this case, a decrease in transcription capacity when translation is compromised could play an important role for the cell’s continued growth by mantaining balanced amounts of mRNA and proteins (19, 44).
The evidence provided here points to a possible cellular adaptation mechanism leading to a reduction in transcription capacity when ribosome activity is compromised. Decoupling of transcription and translation can have several deleterious effects, includ-ing mRNA degradation and R-loop accumulation that can interfere with DNA replica-tion, causing genome instability and increased mutation rates (45). Moreover, this adaptation decreases the cost of transcription of untranslated mRNAs (46) and allows for more resources to be available for the synthesis of increased amounts of ribosomes to respond to the presence of translation inhibitors.
A decrease in transcription capacity results in repartition of RNAP depending on promoter affinity. The increase in translation rate in the presence of sublethal
concentrations of chloramphenicol can help explain the similarity in the change in GFP concentration when it is expressed from the two promoters, P1 and P5, that are differentially regulated by ppGpp but with an equivalently high affinity for RNAP. This similarity also indicates that the decrease in ppGpp, while it does have an effect on the transcription from P1 (Fig. 2C), does not have a very large effect on the repartition of RNA polymerase between ribosomal and nonribosomal promoters, as the same de-crease in the amount of free RNAP is observed in growth media where the cells contain different amounts of ppGpp (Fig. 2B and Fig. S2).
The repartition of RNA polymerase instead results from the competition among promoters for a smaller pool of available enzyme and therefore depends on the affinity of their interaction, as can be observed on the data obtained comparing GFP expression from the high-affinity P5 promoter with the lower-affinity PLtet promoter. The decrease in the amount of free RNAP estimated by measuring the ratio of GFP production rates
on November 4, 2020 by guest
http://msystems.asm.org/
from these two constitutive promoters (PLtet/P5) is about 10-fold, independently of the presence of amino acids in the growth medium (Fig. 2 and Fig. S2) and therefore of the change in ppGpp concentration.
The decrease in free RNAP could be due to different factors affecting the nonspecific interactions of the enzyme with the genome (23); however, the results obtained here from the comparison of the expression of two proteins of different lengths, -galactosidase (-gal) and GFP (Fig. 3) and of proteins encoded by genes within the same operon (Fig. 4 and Fig. S7) suggest that a decrease in the amount of the full-length protein may have a significant contribution to this effect. The RNA polymer-ase core contains two of the longest proteins in E. coli, the and ’ subunits (Fig. S6) that are found one after the other within the same operon, increasing the probability that a ribosome will stall before reaching the end of the mRNA. This is consistent with the results from a recent study by Zhu and coworkers showing that sublethal levels of chloramphenicol result in premature transcription termination and that this effect can also result in decreased expression of genes found downstream within a given operon (21).
This interpretation is further supported by the proteomics analysis of Hui et al. (26). They measured the change in protein fraction of more than 1,000 proteins in the presence of increasing concentrations of Cm by quantitative mass spectrometry. Their results show that the and ’ subunits of RNAP remain a constant fraction of the proteome with increasing Cm and decreasing growth rate. If the concentration of RNAP decreases with increasing Cm, and transcription is limiting for total protein production, then the amount of RNAP will determine the total amount of proteins that can be produced. The fraction of RNAP over all other proteins will thus remain nearly constant as chloramphenicol concentration is increased and growth rate decreases.
Moreover, these results can shed light on a recent study by Dai et al. (19) where it was proposed that in the presence of sublethal concentrations of Cm, despite an increase in the translation elongation rate due to a higher concentration of ternary complexes, the reduction in the total protein production rate results from a decrease in the active ribosome fraction, or the fraction of ribosomes that can reach the end of a mRNA in the presence of the inhibitor (19). Here, we identify RNAP as one of the genes that is likely to be most affected by the decrease in ribosome processivity due to the length of its and = subunits, while shorter genes are affected to a lesser extent.
Is the extreme length of RNA polymerase genes a feature conserved for the coupling of translation and transcription rates? The extreme length of the and =
subunits of RNAP is conserved throughout bacteria (47). In the case of Helicobacter-aceae and Wolbachia, the two genes are even fused together (47, 48). The gene length of and = subunits can vary in different strains since they are composed of indepen-dent structural modules separated by spacers of differing length (47). In E. coli, the spacer sequences, which account for more than 25% of the total sequence, can be deleted without causing a significant decrease in transcription activity. In archea and chloroplasts, some of the conserved protein modules are found in separate genes, and in E. coli, they can be split from each other to produce an active enzyme (49), suggesting that the length of these genes is not imposed by functional constraints. The reason why the RNAP and ribosomal proteins find themselves at opposite ends of the spectrum of gene lengths in bacteria is likely linked to the assembly process, structural flexibility, and stability of the final multiprotein complex (50, 51); however, these results suggest that it could also play an important role for the cell’s continued growth with balanced amounts of mRNA and proteins in the presence of antibiotics that decrease translation processivity.
The decrease in growth rate due to limiting transcription may be unexpected, as ribosome activity is usually thought to always be rate-limiting for bacterial growth; however, depending on the growth conditions, transcription has also been seen to become limiting in eukaryotic cells (68), pointing to different strategies of cellular adaptation to changing growth conditions and limitations. Understanding how bacteria modulate their growth rate and resource allocation in response to inhibition of growth
on November 4, 2020 by guest
http://msystems.asm.org/
has paramount importance in biotechnological and health applications (52–55). The results presented here provide a new cellular mechanism by which bacterial cells can decrease their growth rate in response to antibiotic stress (1, 44, 56). In summary, in the presence of sublethal concentrations of chloramphenicol, it is not translation that becomes limiting for the cell’s growth rate, or the ppGpp-dependent repartition of RNAP between ribosomal and nonribosomal promoters, but it is the decrease in total transcription capacity (Fig. 5). It remains to be established whether this is a common response to other translation limiting factors, although a similar pattern of a decrease in growth rate despite a proportional increase in rRNA content and translation rate has been observed in the past with antibiotics such as tetracycline, erythromycin, and neomycin, and limiting expression of initiator factors 2 and 3 (18, 19).
MATERIALS AND METHODS
Strains, promoters, and reporters. GFP and-galactosidase (-gal) were used as the reporter proteins to measure the rate of gene expression from a specific promoter. The GFP gene used is gfpmut2 coding for a fast-folding GFP (57). The-galactosidase gene is a 5=-end-modified lacZ from the pCMVbeta plasmid (58). Comparison with the wild-type lacZ gene shows that the additional 23 amino acids do not change the results obtained with this version of the reporter gene (data not shown). The promoters include two constitutive promoters (P5, obtained from T5 phage, and PLtet, i.e., PLtetO-1[31]) and a
shortened version of an rRNA promoter (rrnBP1 without the upstream Fis and H-NS sites) (see Table S1 in the supplemental material). The constructs of P1-gfpmut2, P5-gfpmut2, PLtet-gfpmut2, and P5-lacZ with a divergent kanamycin resistance gene were inserted in the chromosome of the Escherichia coli BW25113 strain. P1-gfpmut2 and P5-gfpmut2 (for Fig. 1) were inserted at position 258235 between the convergent crl and phoE genes, PLtet-gfpmut2 was at position 356850 between cynR and codA, and P5-lacZ and P5-gfpmut2 (for Fig. 3) were at position 1395689 between uspE and ynaJ. Genome position did not have an effect on the change in reporter gene expression as a function of Cm. The double fluorescent protein system (RFP-GFP constructs) has been described previously (39). The ribosome binding sites (RBS), i.e., Shine-Dalgarno sequences, used in the above constructs are all similar to the
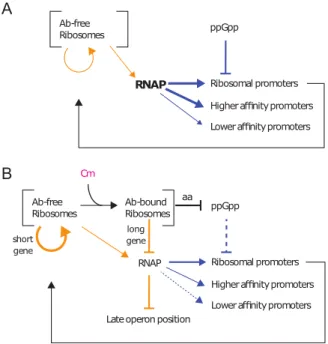
Ab-free Ribosomes Ab-bound Ribosomes Cm ppGpp
RNAP Ribosomal promoters Higher affinity promoters Lower affinity promoters Late operon position
short gene long gene Ab-free Ribosomes ppGpp
RNAP Ribosomal promoters Higher affinity promoters Lower affinity promoters
aa
A
B
FIG 5 Summary. Orange arrows show translation effects, and blue arrows show transcription effects. (A) In the absence of translation limitation, the amount of RNAP available is regulated in part by its partition between ribosomal and nonribosomal promoters by the changes in ppGpp and the ensuing transcription rate of ribosomal promoters. (B) The decrease in ribosome processivity by inhibitors such as chloram-phenicol (Cm) increases the probability of mRNA degradation, thus penalizing the expression of longer genes and of genes at the end of operons. RNAP subunits and ’ are among the longest genes in E.
coli and are found one after the other within the same operon, while ribosomal proteins are among the
shortest genes. The decrease in free RNAP can be measured by a decreasing ratio of high-affinity to low-affinity promoter gene expression rate. In nutrient-poor media, inhibition of ribosome activity by chloramphenicol increases the pool of amino acids and decreases the levels of ppGpp, increasing both ribosome production and ribosome activity. Ab, antibiotic.
on November 4, 2020 by guest
http://msystems.asm.org/
consensus UAAGGAGGU (59). The RBS for GFP (gfpmut2) and -gal (lacZ) is GAAGGAGAU; for RFP (mCherry), it is AGAGGAGAA.
Bacterial growth and fluorescence measurements. Bacterial growth was carried out in M9 minimal growth medium supplemented with 0.5% glycerol (gly), 0.5% glucose (glu), 0.5% glycerol plus 0.2% Casamino Acids (cAA⫹gly) and 0.5% glucose ⫹ 0.2% Casamino Acids (cAA⫹glu). The preculture was obtained from the inoculation of one bacterial colony in LB growth medium. After overnight growth, the seed culture was washed once with phosphate-buffered saline (PBS) and diluted 200 times with the corresponding growth medium containing a specific concentration of chloramphenicol (Cm). This culture was diluted again 200 times once it reached exponential phase. The cultures were grown in flasks, shaking at 37°C and 170 rpm, and optical density and fluorescence were measured with a plate reader (Tecan Infinite 200Pro) every 30 to 50 min. Alternatively, the cultures were grown in a 96-well plate, with 150l of bacterial culture per well covered by 70 l mineral oil. The culture plate was kept at 37°C in the plate reader, shaking and measuring fluorescence and optical density at 610 nm (OD610) every 7 min. The
autofluorescence measured from the wild-type strain BW25113 was subtracted from the fluorescence of the fluorescent strains at the same OD (dependent on the medium). The experimental procedure of the -galactosidase assay followed the protocol of Zhang et al. (60) except that the bacterial strains were cultivated in flasks instead of 48-well plates (18, 61, 62). The measurement of RFP-GFP constructs followed the protocol described previously (39).
Analysis of GFP reporter expression data. Experimental data obtained from the plate reader were analyzed with Matlab to obtain growth rate, protein concentration, and protein expression rate. The pipeline is shown in Fig. S1 in the supplemental material. The window in the growth curve corresponding to the exponential growth phase was defined as a linear range between an upper and a lower threshold in the growth curve plot of log OD610versus time (the thresholds determined manually or from an
automated method [63] gave similar results). Growth rate was derived from the slope of log OD610versus
time in exponential phase (Fig. S1B and C). GFP concentration was derived as the slope of the plot of GFP versus OD610in the exponential growth phase (Fig. S1B).-Galactosidase concentration in Miller units
was obtained by the following formula (Fig. S1C): -gal activity ⫽ 1, 000A
冉
0.011冊
共
20兲
冉
1OD610
冊
⫽ (2 ⫻ 10 6)冉
AOD610
冊
(2) where A comes from the fit of OD450as a function of time with the formula A(1 – e–␥t)/␥ and ␥ is a decay
factor from taking into account that the reaction product o-nitrophenol is volatile (60). The rate of protein expression is defined as the product of protein concentration and growth rate ().
Estimation of the change in RNAP concentration from the analysis of the effect of Cm on GFP expression from the P5 and PLtet promoters. P5 and PLtet are constitutive promoters; therefore, their binding affinity with RNAP alone can be used to determine the probability that RNAP will be bound to the promoter at a given RNAP concentration. If the difference in RNAP affinity for two constitutive promoters is known, the difference in transcription rate from these promoters can be used to estimate the change in free RNAP concentration in vivo (Fig. 2 and Fig. S2). In order to obtain an estimate of the absolute concentration of RNAP, the data obtained on the transcription rates in the absence of Cm can be compared to previously published values as a function of growth rate (34).
Transcription initiation can be described by Michaelis-Menten kinetics, where the process of RNAP binding with the promoter is faster than the following isomerization steps including the formation of open complex. We formalize the relative transcription rates (TR) of P5 and PLtet as
TR
共
P5兲
⫽ cf⁄共
cf⫹ K5兲
(3)and
TR
共
PLtet兲
⫽ acf⁄共
cf⫹ KLtet兲
(4)where cfdenotes the free RNAP concentration, K5and KLtetare the dissociation constants for P5 and
PLtet, respectively, and a is a scaling factor that accounts for the difference in transcription initiation frequency. The transcription initiation frequency, or promoter escape, is higher at PLtet than at P5, resulting in an increased probability of GFP expression for each binding event, and is assumed to be independent of RNAP concentration. This can explain why the GFP production rate (Gpr) PLtet-to-P5 ratio is greater than 1 (Fig. 2 in the main text and Fig. S3A), despite the difference in binding affinity.
The ratio of two dissociation constants (Kj/Ki) can be represented as an exponential function of the
difference of the corresponding binding energies (Ej– Ei), i.e.,Kj⁄Ki⫽ eEj⫺Ei. The binding energies of RNAP
with the three promoters can be estimated based on their DNA sequence (see above). If one dissociation constant (Ki) is known, the other one, (Kj), can be estimated with the formula Kj⫽ KieEj⫺Ei.
We assume that the translation rate of GFP from the three promoter-gfpmut2 constructs is the same, and that therefore it will cancel out when the ratio of GFP expression rate is taken. The ratio of GFP production rates for PLtet and P5 is thus equivalent to the ratio of the transcription rates (TR) obtained from equations 3 and 4
Gpr
共
PLtet兲
Gpr共
P5兲
⫽ TR共
PLtet兲
TR共
P5兲
⫽ a cf⫹ K5 cf⫹ KLtet (5) If the difference in RNAP binding affinities for P5 and PLtet are known (from the free energy calculation above), the change in Gpr ratio with growth rate or with the Cm concentration can be used to estimate the change in free RNAP concentration (Fig. 2 in the main text).It is also possible to estimate the absolute free RNAP concentration in the cell from the available data on the change in the concentration of free RNAP as a function of growth rate (34) and our data on the
on November 4, 2020 by guest
http://msystems.asm.org/
PLtet/P5 Gpr in different growth media. The free RNAP concentration, cf, as a function of growth rate ()
can be obtained by fitting the data of Klumpp and Hwa (34), with log cf ⫽ Aexp(–r/), giving A⫽ 6.82log m⫺3and
r⫽ 0.11 doublings/hour (Fig. S2B). The change in Gpr(PLtet)/Gpr(P5) as a
function of growth rate obtained by our experimental data (Fig. S2A) is consistent with the change in RNAP concentration measured previously (34). We can thus obtain the value of a and K5by fitting the
Gpr ratio data with equation 5 and the RNAP concentration at the different growth rates: a⫽ 10.5 and
K5⫽ 90m⫺3. Finally, we can use equation 5 to estimate the free RNAP concentration in the presence
of Cm (Fig. S3B).
SUPPLEMENTAL MATERIAL
Supplemental material is available online only.
TEXT S1, PDF file, 0.09 MB. FIG S1, EPS file, 0.6 MB. FIG S2, EPS file, 0.5 MB. FIG S3, EPS file, 0.2 MB. FIG S4, EPS file, 0.1 MB. FIG S5, EPS file, 0.3 MB. FIG S6, EPS file, 0.8 MB. FIG S7, EPS file, 0.4 MB. FIG S8, EPS file, 0.3 MB. TABLE S1, XLSX file, 0.01 MB.
ACKNOWLEDGMENTS
We thank Luca Ciandrini and Gilles Fischer for useful comments on the manuscript. This work was supported by HFSP grant RGY0070/2014 (B.S., M.C.L., and Q.Z.), Italian Association for Cancer Research (AIRC), grant AIRC-IG (REF: 23259) (M.C.L.), and the Strategic Priority Program of the Chinese Academy of Sciences (XDA17010504) (H.S. and Q.Z.).
REFERENCES
1. Mathieu A, Fleurier S, Frénoy A, Dairou J, Bredeche M-F, Sanchez-Vizuete P, Song X, Matic I. 2016. Discovery and function of a general core hormetic stress response in E. coli induced by sublethal concentrations of antibiotics. Cell Rep 17:46 –57.https://doi.org/10.1016/j.celrep.2016 .09.001.
2. Kohanski MA, Dwyer DJ, Hayete B, Lawrence CA, Collins JJ. 2007. A common mechanism of cellular death induced by bactericidal antibiot-ics. Cell 130:797– 810.https://doi.org/10.1016/j.cell.2007.06.049. 3. Levin-Reisman I, Ronin I, Gefen O, Braniss I, Shoresh N, Balaban NQ. 2017.
Antibiotic tolerance facilitates the evolution of resistance. Science 355: 826 – 830.https://doi.org/10.1126/science.aaj2191.
4. Andersson DI, Hughes D. 2014. Microbiological effects of sublethal levels of antibiotics. Nat Rev Microbiol 12:465– 478.https://doi.org/10.1038/ nrmicro3270.
5. Hauryliuk V, Atkinson GC, Murakami KS, Tenson T, Gerdes K. 2015. Recent functional insights into the role of (p)ppGpp in bacterial physiology. Nat Rev Microbiol 13:298 –309.https://doi.org/10.1038/nrmicro3448. 6. Murray HD, Schneider DA, Gourse RL. 2003. Control of rRNA expression
by small molecules is dynamic and nonredundant. Mol Cell 12:125–134.
https://doi.org/10.1016/s1097-2765(03)00266-1.
7. Nunes-Alves C. 2016. Bacterial physiology: (p)ppGpp target ribosome assembly. Nat Rev Microbiol 14:266. https://doi.org/10.1038/nrmicro .2016.44.
8. Zhang Y, Zborníková E, Rejman D, Gerdes K. 2018. Novel (p)ppGpp binding and metabolizing proteins of Escherichia coli. mBio 9:e02188-17.
https://doi.org/10.1128/mBio.02188-17.
9. Haugen SP, Ross W, Gourse RL. 2008. Advances in bacterial promoter recognition and its control by factors that do not bind DNA. Nat Rev Microbiol 6:507–519.https://doi.org/10.1038/nrmicro1912.
10. Gummesson B, Magnusson LU, Lovmar M, Kvint K, Persson Ö, Ballesteros M, Farewell A, Nyström T. 2009. Increased RNA polymerase availability directs resources towards growth at the expense of maintenance. EMBO J 28:2209 –2219.https://doi.org/10.1038/emboj.2009.181.
11. Klumpp S, Zhang Z, Hwa T. 2009. Growth rate-dependent global effects on gene expression in bacteria. Cell 139:1366 –1375.https://doi.org/10 .1016/j.cell.2009.12.001.
12. Mauri M, Klumpp S. 2014. A model for sigma factor competition in bacterial cells. PLoS Comput Biol 10:e1003845.https://doi.org/10.1371/ journal.pcbi.1003845.
13. Nyström T. 2004. Growth versus maintenance: a trade-off dictated by RNA polymerase availability and sigma factor competition? Mol Micro-biol 54:855– 862.https://doi.org/10.1111/j.1365-2958.2004.04342.x. 14. Stracy M, Lesterlin C, Garza de Leon F, Uphoff S, Zawadzki P, Kapanidis
AN. 2015. Live-cell superresolution microscopy reveals the organization of RNA polymerase in the bacterial nucleoid. Proc Natl Acad Sci U S A 112:E4390 –E4399.https://doi.org/10.1073/pnas.1507592112.
15. Paul BJ, Ross W, Gaal T, Gourse RL. 2004. rRNA transcription in Esche-richia coli. Annu Rev Genet 38:749 –770.https://doi.org/10.1146/annurev .genet.38.072902.091347.
16. Zhang X, Liang S-T, Bremer H. 2006. Feedback control of ribosome synthesis in Escherichia coli is dependent on eight critical amino acids. Biochimie 88:1145–1155.https://doi.org/10.1016/j.biochi.2006.03.012. 17. Potrykus K, Murphy H, Philippe N, Cashel M. 2011. ppGpp is the major
source of growth rate control in E. coli. Environ Microbiol 13:563–575.
https://doi.org/10.1111/j.1462-2920.2010.02357.x.
18. Scott M, Gunderson CW, Mateescu EM, Zhang Z, Hwa T. 2010. Interdepen-dence of cell growth and gene expression: origins and consequences. Science 330:1099 –1102.https://doi.org/10.1126/science.1192588. 19. Dai X, Zhu M, Warren M, Balakrishnan R, Patsalo V, Okano H, Williamson
JR, Fredrick K, Wang Y-P, Hwa T. 2016. Reduction of translating ribo-somes enables Escherichia coli to maintain elongation rates during slow growth. Nat Microbiol 2:16231.https://doi.org/10.1038/nmicrobiol.2016 .231.
20. Bremer H, Dennis P. 1996. Modulation of chemical composition and other parameters of the cell by growth rate, p 1553–1569. In Neidhardt FC, Ingraham JL, Low KB, Magasanik B, Schaechter M, Umbarger HE (ed), Escherichia coli and Salmonella typhimurium: cellular and molecular biology, 2nd ed. American Society for Microbiology, Washington, DC. 21. Zhu M, Mori M, Hwa T, Dai X. 2019. Disruption of transcription–translation
coordination in Escherichia coli leads to premature transcriptional termina-tion. Nat Microbiol 4:2347–2356.https://doi.org/10.1038/s41564-019 -0543-1.
on November 4, 2020 by guest
http://msystems.asm.org/
22. Bremer H, Dennis P, Ehrenberg M. 2003. Free RNA polymerase and modeling global transcription in Escherichia coli. Biochimie 85:597– 609.
https://doi.org/10.1016/s0300-9084(03)00105-6.
23. Patrick M, Dennis PP, Ehrenberg M, Bremer H. 2015. Free RNA polymer-ase in Escherichia coli. Biochimie 119:80 –91.https://doi.org/10.1016/j .biochi.2015.10.015.
24. Zhang X, Dennis P, Ehrenberg M, Bremer H. 2002. Kinetic properties of rrn promoters in Escherichia coli. Biochimie 84:981–996.https://doi.org/ 10.1016/s0300-9084(02)00010-x.
25. Liang S-T, Bipatnath M, Xu Y-C, Chen S-L, Dennis P, Ehrenberg M, Bremer H. 1999. Activities of constitutive promoters in Escherichia coli. J Mol Biol 292:19 –37.https://doi.org/10.1006/jmbi.1999.3056.
26. Hui S, Silverman JM, Chen SS, Erickson DW, Basan M, Wang J, Hwa T, Williamson JR. 2015. Quantitative proteomic analysis reveals a simple strategy of global resource allocation in bacteria. Mol Syst Biol 11:784.
https://doi.org/10.15252/msb.20145697.
27. Traxler MF, Summers SM, Nguyen H-T, Zacharia VM, Hightower GA, Smith JT, Conway T. 2008. The global, ppGpp-mediated stringent re-sponse to amino acid starvation in Escherichia coli. Mol Microbiol 68: 1128 –1148.https://doi.org/10.1111/j.1365-2958.2008.06229.x. 28. Dennis PP, Ehrenberg M, Bremer H. 2004. Control of rRNA synthesis in
Escherichia coli: a systems biology approach. Microbiol Mol Biol Rev 68:639 – 668.https://doi.org/10.1128/MMBR.68.4.639-668.2004. 29. Felth L, Molzahn C, Wang S, Henderson K, Ruff E, Poulos M, Chhabra M,
Bieter L, Artsimovitch I, Record MT. 2016. Systematic studies of effects of the discriminator on stabilization of the open complex and abortive and productive initiation. FASEB J 30:1055.6.
30. Pemberton IK, Muskhelishvili G, Travers AA, Buckle M. 2000. The G ⫹C-rich discriminator region of the tyrT promoter antagonises the formation of stable preinitiation complexes. J Mol Biol 299:859 – 864.https://doi .org/10.1006/jmbi.2000.3780.
31. Lutz R, Bujard H. 1997. Independent and tight regulation of transcrip-tional units in Escherichia coli via the LacR/O, the TetR/O and AraC/I1-I2 regulatory elements. Nucleic Acids Res 25:1203–1210.https://doi.org/10 .1093/nar/25.6.1203.
32. Traxler MF, Zacharia VM, Marquardt S, Summers SM, Nguyen H-T, Stark SE, Conway T. 2011. Discretely calibrated regulatory loops controlled by ppGpp partition gene induction across the “feast to famine” gradient in Escherichia coli. Mol Microbiol 79:830 – 845. https://doi.org/10.1111/j .1365-2958.2010.07498.x.
33. Ryals J, Little R, Bremer H. 1982. Control of rRNA and tRNA syntheses in Escherichia coli by guanosine tetraphosphate. J Bacteriol 151: 1261–1268.https://doi.org/10.1128/JB.151.3.1261-1268.1982.
34. Klumpp S, Hwa T. 2008. Growth-rate-dependent partitioning of RNA polymerases in bacteria. Proc Natl Acad Sci U S A 105:20245–20250.
https://doi.org/10.1073/pnas.0804953105.
35. Sendy B, Lee DJ, Busby SJW, Bryant JA. 2016. RNA polymerase supply and flux through the lac operon in Escherichia coli. Philos Trans R Soc Lond B Biol Sci 371:20160080.https://doi.org/10.1098/rstb.2016.0080. 36. Berg OG, von Hippel PH. 1987. Selection of DNA binding sites by
regulatory proteins. Statistical-mechanical theory and application to operators and promoters. J Mol Biol 193:723–750. https://doi.org/10 .1016/0022-2836(87)90354-8.
37. Tsung K, Inouye S, Inouye M. 1989. Factors affecting the efficiency of protein synthesis in Escherichia coli. Production of a polypeptide of more than 6000 amino acid residues. J Biol Chem 264:4428 – 4433. 38. Harvey RJ, Koch AL. 1980. How partially inhibitory concentrations of
chloramphenicol affect the growth of Escherichia coli. Antimicrob Agents Chemother 18:323–337.https://doi.org/10.1128/aac.18.2.323. 39. Li R, Zhang Q, Li J, Shi H. 2016. Effects of cooperation between
trans-lating ribosome and RNA polymerase on termination efficiency of the Rho-independent terminator. Nucleic Acids Res 44:2554 –2563.https:// doi.org/10.1093/nar/gkv1285.
40. Mori M, Schink S, Erickson DW, Gerland U, Hwa T. 2017. Quantifying the benefit of a proteome reserve in fluctuating environments. Nat Commun 8:1225.https://doi.org/10.1038/s41467-017-01242-8.
41. Gausing K. 1982. Regulation of ribosome synthesis in E. coli. Trends Biochem Sci 7:65– 67.https://doi.org/10.1016/0968-0004(82)90079-2. 42. McGinnis JL, Liu Q, Lavender CA, Devaraj A, McClory SP, Fredrick K,
Weeks KM. 2015. In-cell SHAPE reveals that free 30S ribosome subunits are in the inactive state. Proc Natl Acad Sci U S A 112:2425–2430.
https://doi.org/10.1073/pnas.1411514112.
43. Bakshi S, Choi H, Weisshaar JC. 2015. The spatial biology of transcription
and translation in rapidly growing Escherichia coli. Front Microbiol 6:636.
https://doi.org/10.3389/fmicb.2015.00636.
44. Greulich P, Scott M, Evans MR, Allen RJ. 2015. Growth-dependent bac-terial susceptibility to ribosome-targeting antibiotics. Mol Syst Biol 11: 796.https://doi.org/10.15252/msb.20145949.
45. Gowrishankar J, Harinarayanan R. 2004. Why is transcription coupled to translation in bacteria? Mol Microbiol 54:598 – 603. https://doi.org/10 .1111/j.1365-2958.2004.04289.x.
46. Hausser J, Mayo A, Keren L, Alon U. 2019. Central dogma rates and the trade-off between precision and economy in gene expression. Nat Com-mun 10:68.https://doi.org/10.1038/s41467-018-07391-8.
47. Lane WJ, Darst SA. 2010. Molecular evolution of multi-subunit RNA polymerases: sequence analysis. J Mol Biol 395:671– 685.https://doi.org/ 10.1016/j.jmb.2009.10.062.
48. Zakharova N, Paster BJ, Wesley I, Dewhirst FE, Berg DE, Severinov KV. 1999. Fused and overlapping rpoB and rpoC genes in helicobacters, campylobacters, and related bacteria. J Bacteriol 181:3857–3859.https:// doi.org/10.1128/JB.181.12.3857-3859.1999.
49. Severinov K, Mustaev A, Kukarin A, Muzzin O, Bass I, Darst SA, Goldfarb A. 1996. Structural modules of the large subunits of RNA polymerase. Introducing archaebacterial and chloroplast split sites in the beta and beta= subunits of Escherichia coli RNA polymerase. J Biol Chem 271: 27969 –27974.https://doi.org/10.1074/jbc.271.44.27969.
50. Davis JH, Williamson JR. 2017. Structure and dynamics of bacterial ribosome biogenesis. Philos Trans R Soc B 372:20160181.https://doi.org/ 10.1098/rstb.2016.0181.
51. Murakami KS, Darst SA. 2003. Bacterial RNA polymerases: the wholo story. Curr Opin Struct Biol 13:31–39. https://doi.org/10.1016/s0959 -440x(02)00005-2.
52. Scott M, Hwa T. 2011. Bacterial growth laws and their applications. Curr Opin Biotechnol 22:559 –565. https://doi.org/10.1016/j.copbio.2011.04 .014.
53. Davies J, Spiegelman GB, Yim G. 2006. The world of subinhibitory antibiotic concentrations. Curr Opin Microbiol 9:445– 453. https://doi .org/10.1016/j.mib.2006.08.006.
54. Deris JB, Kim M, Zhang Z, Okano H, Hermsen R, Groisman A, Hwa T. 2013. The innate growth bistability and fitness landscapes of antibiotic-resistant bacteria. Science 342:1237435.https://doi.org/10.1126/science .1237435.
55. de Jong H, Geiselmann J, Ropers D. 2017. Resource reallocation in bacteria by reengineering the gene expression machinery. Trends Mi-crobiol 25:480 – 493.https://doi.org/10.1016/j.tim.2016.12.009. 56. Balaban N. 2011. Persistence: mechanisms for triggering and enhancing
phenotypic variability. Curr Opin Genet Dev 21:768 –775.https://doi.org/ 10.1016/j.gde.2011.10.001.
57. Cormack BP, Valdivia RH, Falkow S. 1996. FACS-optimized mutants of the green fluorescent protein (GFP). Gene 173:33–38. https://doi.org/10 .1016/0378-1119(95)00685-0.
58. MacGregor GR, Caskey CT. 1989. Construction of plasmids that express E. coli beta-galactosidase in mammalian cells. Nucleic Acids Res 17:2365.
https://doi.org/10.1093/nar/17.6.2365.
59. Shine J, Dalgarno L. 1974. The 3=-terminal sequence of Escherichia coli 16S ribosomal RNA: complementarity to nonsense triplets and ribosome binding sites. Proc Natl Acad Sci U S A 71:1342–1346.https://doi.org/10 .1073/pnas.71.4.1342.
60. Zhang Q, Li R, Li J, Shi H. 2018. Optimal allocation of bacterial protein resources under nonlethal protein maturation stress. Biophys J 115: 896 –910.https://doi.org/10.1016/j.bpj.2018.07.021.
61. Zhang X, Bremer H. 1995. Control of the Escherichia coli rrnB P1 pro-moter strength by ppGpp. J Biol Chem 270:11181–11189.https://doi .org/10.1074/jbc.270.19.11181.
62. Shetty RP. 2008. Applying engineering principles to the design and construction of transcriptional devices. PhD dissertation. Massachusetts Institute of Technology, Cambridge, MA.
63. Rudge TJ, Brown JR, Federici F, Dalchau N, Phillips A, Ajioka JW, Haseloff J. 2016. Characterization of intrinsic properties of promoters. ACS Synth Biol 5:89 –98.https://doi.org/10.1021/acssynbio.5b00116.
64. Keseler IM, Mackie A, Peralta-Gil M, Santos-Zavaleta A, Gama-Castro S, Bonavides-Martínez C, Fulcher C, Huerta AM, Kothari A, Krummenacker M, Latendresse M, Muñiz-Rascado L, Ong Q, Paley S, Schröder I, Shearer AG, Subhraveti P, Travers M, Weerasinghe D, Weiss V, Collado-Vides J, Gunsalus RP, Paulsen I, Karp PD. 2013. EcoCyc: fusing model organism databases with systems biology. Nucleic Acids Res 41:D605–D612.
https://doi.org/10.1093/nar/gks1027.
on November 4, 2020 by guest
http://msystems.asm.org/
65. Shimada T, Yamazaki Y, Tanaka K, Ishihama A. 2014. The whole set of constitutive promoters recognized by RNA polymerase RpoD holoen-zyme of Escherichia coli. PLoS One 9:e90447.https://doi.org/10.1371/ journal.pone.0090447.
66. Santos-Zavaleta A, Salgado H, Gama-Castro S, Sanchez-Perez M, Gomez-Romero L, Ledezma-Tejeida D, García-Sotelo JS, Alquicira-Hernández K,
Muñiz-Rascado LJ, Peña-Loredo P, Ishida-Gutiérrez C, Velázquez-Ramírez DA, Del Moral-Chávez V, Bonavides-Martínez C, Méndez-Cruz C-F, Gala-gan J, Collado-Vides J. 2019. RegulonDB v 10.5: tackling challenges to unify classic and high throughput knowledge of gene regulation in E.
coli K-12. Nucleic Acids Res 47:D212–D220.https://doi.org/10.1093/nar/
gky1077.