HAL Id: inserm-02310721
https://www.hal.inserm.fr/inserm-02310721
Submitted on 10 Oct 2019
HAL is a multi-disciplinary open access
archive for the deposit and dissemination of
sci-entific research documents, whether they are
pub-lished or not. The documents may come from
teaching and research institutions in France or
abroad, or from public or private research centers.
L’archive ouverte pluridisciplinaire HAL, est
destinée au dépôt et à la diffusion de documents
scientifiques de niveau recherche, publiés ou non,
émanant des établissements d’enseignement et de
recherche français ou étrangers, des laboratoires
publics ou privés.
Meryl Dahan, Caroline Scemama, Raphaël Porcher, David Biau
To cite this version:
Meryl Dahan, Caroline Scemama, Raphaël Porcher, David Biau. Reporting of heterogeneity of
treat-ment effect in cohort studies: a review of the literature. BMC Medical Research Methodology, BioMed
Central, 2018, 18 (1), pp.10. �10.1186/s12874-017-0466-6�. �inserm-02310721�
R E S E A R C H A R T I C L E
Open Access
Reporting of heterogeneity of treatment
effect in cohort studies: a review of the
literature
Meryl Dahan
*, Caroline Scemama, Raphael Porcher and David J. Biau
Abstract
Background: This article corresponds to a literature review and analyze how heterogeneity of treatment (HTE) is reported and addressed in cohort studies and to evaluate the use of the different measures to HTE analysis. Methods: prospective cohort studies, in English language, measuring the effect of a treatment (pharmacological, interventional, or other) published among 119 core clinical journals (defined by the National Library of Medicine) in the last 16 years were selected in the following data source: Medline. One reviewer randomly sampled journal articles with 1: 1 stratification by journal type: high impact journals (the New England Journal of Medicine, JAMA, LANCET, Annals of Internal Medicine, BMJ and Plos Medicine) and low impact journal (the remaining journals) to identify 150 eligible studies. Two reviewers independently and in duplicate used standardized piloted forms to screen study reports for eligibility and to extract data. They also used explicit criteria to determine whether a cohort study reported HTE analysis. Logistic regression was used to examine the association of prespecified study
characteristics with reporting versus not reporting of heterogeneity of treatment effect.
Results: One hundred fifty cohort studies were included of which 88 (58%) reported HTE analysis. High impact journals (Odds Ratio: 3.5, 95% CI: 1.78–7.5; P < 0.001), pharmacological studies (Odds Ratio: 0.26, 95% CI: 0.13–0.51; P < 0.001) and studies published after 2014 (Odds Ratio: 0.5, 95% CI: 0.25–0.97; P = 0.004) were associated with more frequent reporting of HTE. 27 (31%) studies which reported HTE used an interaction test.
Conclusion: More than half cohort studies report some measure of heterogeneity of treatment effect. Prospective cohort studies published in high impact journals, with large sample size, or studying a pharmacological treatment are associated with more frequent HTE reporting. The source of funding was not associated with HTE reporting. There is a need for guidelines on how to perform HTE analyses in cohort studies.
Keywords: Cohort studies, Heterogeneity of treatment, Subgroups analysis, Heterogeneity of treatment reporting Background
There are different ways to improve patient care. The first one is to develop innovative health-care interventions and this has been the leading contributor for medical improve-ment so far. The second possibility is to target known, or new, health-care interventions to subgroup of patients where the treatment is more likely to be beneficial. Because patients vary in characteristics such as sex, age, past med-ical history, genetics, disease severity, presence of comor-bidities, concomitant exposures, and other pre-treatment
variables, it can be hypothesized that a treatment that has little effect on an unselected group of patients, becomes extremely effective on a specific subgroup of patients. The use of BRAF (BRAF is a human gene that encodes a pro-tein called B-Raf involved in sending signals inside cells that direct cell growth) kinase inhibitor in patients with BRAF mutated metastatic melanoma is one such recent example [1].
Consequently, when reporting on the effect of a treat-ment, researchers may feel the need to look for sub-group of patients where the effect may differ, either positively or negatively, from that of the other patients. This has been labeled as heterogeneity of treatment
* Correspondence:dahanmeryl@gmail.com
INSERM U1153, ECAMO, METHODS, 27 rue du faubourg Saint-Jacques, Université Paris-Descartes, 75014 Paris 5, France
© The Author(s). 2018 Open Access This article is distributed under the terms of the Creative Commons Attribution 4.0 International License (http://creativecommons.org/licenses/by/4.0/), which permits unrestricted use, distribution, and reproduction in any medium, provided you give appropriate credit to the original author(s) and the source, provide a link to the Creative Commons license, and indicate if changes were made. The Creative Commons Public Domain Dedication waiver (http://creativecommons.org/publicdomain/zero/1.0/) applies to the data made available in this article, unless otherwise stated.
effect, namely nonrandom, explainable variability in the direction or magnitude of treatment effects for individ-uals within a population. Measuring or reporting hetero-geneity of treatment effect is widely performed in the randomized trial literature with almost two-third of car-diovascular trials and about one-third of surgical trials reporting such analyses [2]. However, sub-group analyses (a means of assessing heterogeneity of treatment effect) are problematic because they are associated with infla-tion of type one error, and consequently with reporting of spurious effects, and with poorly controlled type two error, and consequently with a risk for overlooking potential significant heterogeneity [3]. More recently, Sun and colleagues have published an article addressing the issue of measuring and reporting subgroup analyses in randomized controlled trials [4, 5]. They found that almost half randomized trials in a random sample of core clinical journal reported a subgroup analysis with a significant variation in the reporting according to the source of funding, the significance of the main analysis, the sample size, and the impact factor of the journal. Lit-tle is known, however, about the measuring and report-ing of heterogeneity of treatment effect in cohort studies.
Cohort studies are frequently used to measure the association of a treatment and performing subgroup analyses is likely performed as well. The main advantage of experimental cohort studies over randomized trials is that they usually allow the enrollment of patients who present significant comorbidities or are more fragile, physically, psychologically or socially than those in-cluded in randomized designs [6]. Cohort studies have, however, significant drawbacks compared to randomized trials. Mainly, cohort studies are susceptible to selection biases that affect the principal comparison and will also affect any subgroup analyses. This can lead to apparent heterogeneity in treatment effect when there is none or conceal a true difference of effect between categories of patients. Cohort studies are inclined to confounding by indication, therefore subgroups of interest may be identi-fied not because the effect of treatment differs, but be-cause their risk profile differ [7].
Therefore, we decided to perform a review of pro-spective interventional cohort studies to estimate the proportion of studies reporting a measure of the hetero-geneity of treatment effect and identify variables associ-ated with reporting of this heterogeneity.
Methods
Protocol and registration
Eligibility criteria, information sources, data items and methods of the analysis were specified in advance and documented in a protocol. Prisma guidelines were followed [8].
Eligibility criteria
We considered prospective, controlled, cohort studies, measuring the effect of a health care intervention on humans, published in a core clinical journal (as defined by the National Library of Medicine), in the English lan-guage. Pharmacokinetic analyses, letters, reviews/meta-analyses, and studies published before 2000 were not considered eligible. The core clinical journals defined by the National Library of medicine, known as the Abridged Index Medicus, included 119 journals in 2015, covering all specialties of clinical medicine and public health sciences [9]. There were no restrictions of partici-pants based on age, sex, socio-economic status, medical condition, associated comorbidities, or other variables. Interventions considered were pharmacological (any treatment where the effect is expected from a drug), interventional (any treatment where the effect is ex-pected from a mechanical cause; for instance a surgical procedure, a rehabilitation program, an angioplasty) or other (any treatment where the effect is expected neither uniquely from a drug nor from a mechanical cause; for instance a psychological intervention, a blood transfu-sion, a complex intervention encompassing multiple in-terventions such as a resuscitation method). All types of outcome were considered including time to event, binary and continuous outcomes. The primary outcome was considered for all analyses; in case the primary outcome was not clearly indicated, the first outcome reported in the method section was considered.
Information sources, search strategy and study selection
Studies were identified by searching Medline via PubMed by two reviewers starting from March 2016 and moving backwards in time until the predefined number of studies was completed. Journals were stratified into high and low impact groups. The six high impact journals were Annals of Internal Medicine [10], British Medical Journal [11], Journal of the American Medical Association (JAMA) [12], Lancet [13], New England Journal of Medicine [14], and Plos Medicine [15]. The low impact journals were the 113 other core clinical journals from the Abridged Index Medicus. The objective was to obtain a total of 150 stud-ies, with 75 in each group. High impact journal studies were identified by generating a random vector of 75 names among the six possible categories; each of the six journals had the same probability of being selected per draw; in case the year 2000 was reached for a journal, the missing number of studies were distributed among other less populated journals. Low impact journal studies were identified by generating a random list of 75 with each journal having a similar probability of being selected per draw; multiple selections (the fact that one journal may contribute to more than one study) were accepted and
consequently some core clinical journal would not contribute.
Eligible studies were identified with the following search terms on PubMed « Name of the journal[TA] AND « prospective » AND « cohort study ». The term «Name of the journal[TA]» was replaced by the relevant journal name as randomly selected in the previous step. Hits (n = 2019) were reviewed within each journal on title and abstract and then on full text for selection cri-teria until the adequate number of studies was reached.
Data collection process
We developed a data extraction sheet, pilot-tested it on ten randomly-selected included studies, and refined it accordingly. Two reviewers (MD, CS) extracted the rele-vant data from all included studies. Disagreements between the reviewers were resolved by consensus, and if necessary, consultation with an arbitrator (DB). Au-thors were not contacted for further information. Only the materials and methods section, results section, tables and figures were reviewed; the introduction and discus-sion sections were not read through; an exception was made for source of funding (see below).
Reviewers also identified a pair-wise comparison of interest, using the following strategy. If there were only two groups, these groups were considered for the ana-lysis. If there were more than two groups, the compari-son that was clearly and explicitly defined as the primary comparison in the study report was considered only; if the primary comparison was not explicitly defined, we selected the comparison that reported the largest num-ber of HTE analyses for the selected primary outcome.
Data items
Heterogeneity of treatment effect was considered if the effect of treatment was reported for all categories of a variable. For instance, if the effect of treatment was re-ported for men and women separately, or for patients 70 years and older and for those below 70 years old. Heterogeneity of treatment effect was not considered as reported if the effect of treatment was reported for only some of the categories of a variable. For instance, if the effect of treatment was reported for the whole sample under scrutiny, and for men, but not for women. In case an interaction was sought for between a variable and the treatment, and that this interaction was not significant, we considered that heterogeneity of treatment effect was performed even if the effect was not reported among the categories [16].
We extracted information on sample size, length of follow-up, date of publication, funding source, study area, outcome of interest, significance of the effect on the outcome, prespecification of heterogeneity of treat-ment effect, predictive variables studied. We also looked
at whether predictive variables on side effects were reported.
The variable “date of publication” was dichotomized (based on the 0.5 quantile) into studies published be-tween 2000 and 2013 and studies published bebe-tween 2014 and 2016.
The source of funding was based on statements re-ported in the method section, disclosure of conflicts of interest, acknowledgments and funding section of the study report. We categorized the source of funding as private, public, mixed, and none; for presentation, we pooled these categories into private (private and mixed) and other. Study areas considered were pharmacological, interventional, and other as described above. The out-come of interest was categorized into time-to-event, bin-ary, and continuous. Prespecification of heterogeneity of treatment effect was considered if the analysis was re-ported in the method section. Predictive variables were categorized into: age; sex; socioeconomic level (vari-ables referring to income, education, occupation); co-morbidities (variables referring to additional diseases or disorders co-occurring with the disease of interest or a measure of comorbidity); severity of the disease under treatment (variables referring to different levels of ad-vancement of the disease of interest); medical history (variables referring to past medical events, previous dis-eases, or genetic disorders); others; and the form of treatment (variables referring to different doses or differ-ent exposure periods or differdiffer-ent administration form of the same treatment). Measuring the effect of different forms of treatment can be regarded as not heterogeneity in the effect of treatment but as heterogeneity in the treatment per se. Therefore, HTE studies include those where the form of treatment only was looked at; how-ever descriptive findings are also reported excluding these studies.
Different types of analysis of HTE have been consid-ered: subgroup (presentation of univariate estimate of each category of the variables); adjusted (presentation of estimates adjusted for the other variables); propension (adjustment for selection bias with propensity score methods).
Risk of bias in individual studies
The Newcastle Ottawa Scale for assessing the quality of non randomized studies was used to rate study quality (Additional file 1). This scale evaluates the quality of the selection and the representativeness of the exposed and non exposed population cohort (four items), the quality of the comparability of cohorts on the basis of the design (one item) and the quality of the assessment of the pri-mary outcome and the adequacy of follow up (three items). Between 0 and 3 total points it was considered as poor quality, between 4 and 6 total points it was
considered as moderate quality and between 7 and 8 total points it was considered as good quality of the cohort studies.
Data analysis
Continuous variables are reported as median and first to third quartile values. Categorical variables are re-ported as counts and proportion. Descriptive analyses are presented for all studies and for categories of relevant study characteristics such as presence of HTE, journal impact factor, and study area. To exam-ine the association of reporting versus not reporting HTE with study characteristics, we carried out uni-variable and multiuni-variable logistic regression analyses, with reporting HTE as the dependent variable. The following variables were looked at: sample size, length of follow-up, date of publication (<2014 and ≥2014), funding source (private vs other), study area (pharma-cological vs non pharma(pharma-cological), outcome of interest (time-to-event, binary, continuous), significance of the effect on the outcome (yes vs no), journal impact fac-tor (high vs low impact), quality of the study (con-tinuous), analysis of predictive factors on primary outcome (yes vs no) and their prespecification and analysis of predictive factors on side effects (yes vs
no). A multivariable model including predictors with some significance (P < 0.2) was then developed. We used the R software version 3.2.2 for all analyses. All comparisons were two tailed, and P < 0.05 was consid-ered statistically significant. We used the Wilcoxon rank sum test for the analysis of continuous data and the chi-square/Fisher tests for binary data.
Additional analyses
A sensitivity analysis excluding studies only looking at the heterogeneity in the form of the treatment from the HTE group was performed. We also performed another sensi-tivity analysis on looking at the heterogeneity of treatment concerning only the studies considered as good quality of cohort studies, depending on the The Newcastle Ottawa Scale.
Results
Study selection
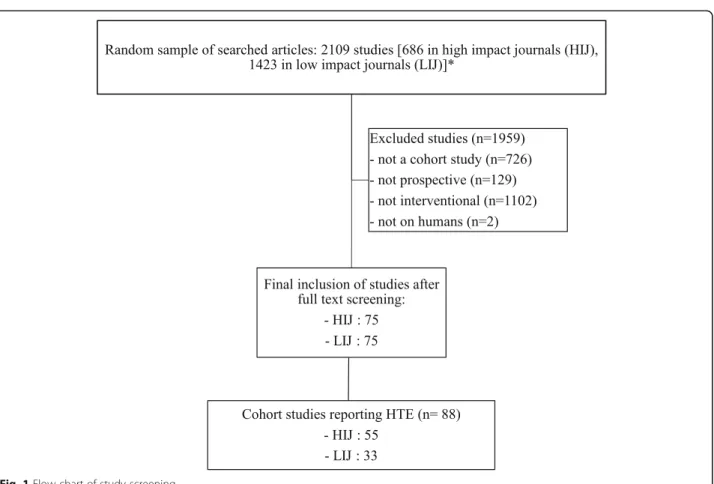
A total of 150 prospective cohort studies, 75 in high im-pact and 75 in low imim-pact journals, were identified for inclusion in the review after screening 2019 citations on PubMed (Fig. 1). The year 2000 was reached for the New England Journal of Medicine after 11 cohort studies were retrieved instead of 15 planned and 8 were added
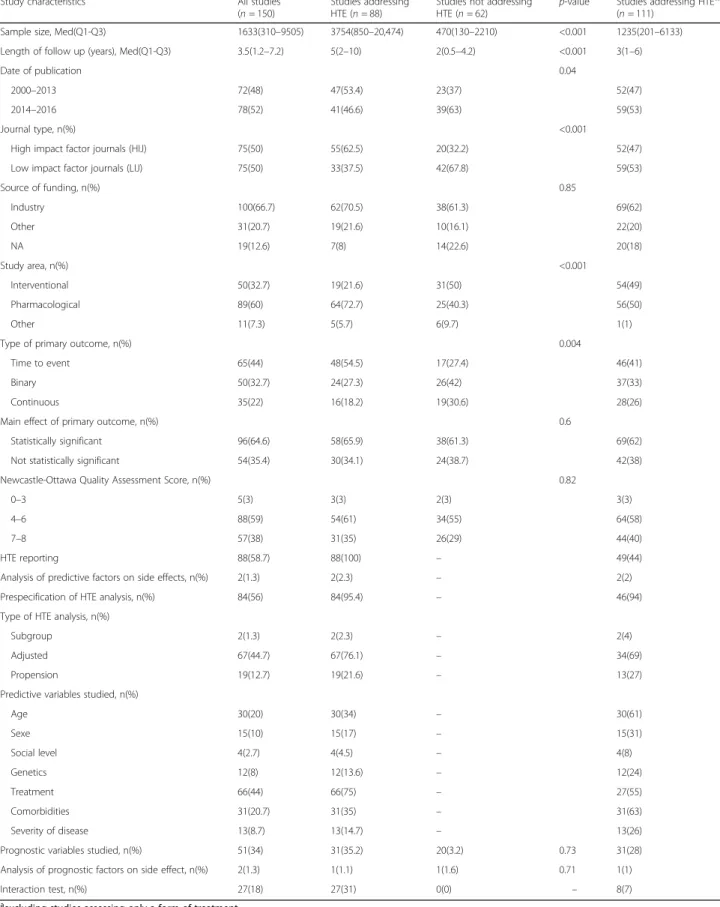
Table 1 Study characteristics in cohort studies reporting and not reporting HTE
Study characteristics All studies (n = 150)
Studies addressing HTE (n = 88)
Studies not addressing HTE (n = 62)
p-value Studies addressing HTEa,* (n = 111)
Sample size, Med(Q1-Q3) 1633(310–9505) 3754(850–20,474) 470(130–2210) <0.001 1235(201–6133) Length of follow up (years), Med(Q1-Q3) 3.5(1.2–7.2) 5(2–10) 2(0.5–4.2) <0.001 3(1–6)
Date of publication 0.04
2000–2013 72(48) 47(53.4) 23(37) 52(47) 2014–2016 78(52) 41(46.6) 39(63) 59(53)
Journal type, n(%) <0.001
High impact factor journals (HIJ) 75(50) 55(62.5) 20(32.2) 52(47) Low impact factor journals (LIJ) 75(50) 33(37.5) 42(67.8) 59(53)
Source of funding, n(%) 0.85 Industry 100(66.7) 62(70.5) 38(61.3) 69(62) Other 31(20.7) 19(21.6) 10(16.1) 22(20) NA 19(12.6) 7(8) 14(22.6) 20(18) Study area, n(%) <0.001 Interventional 50(32.7) 19(21.6) 31(50) 54(49) Pharmacological 89(60) 64(72.7) 25(40.3) 56(50) Other 11(7.3) 5(5.7) 6(9.7) 1(1)
Type of primary outcome, n(%) 0.004
Time to event 65(44) 48(54.5) 17(27.4) 46(41) Binary 50(32.7) 24(27.3) 26(42) 37(33) Continuous 35(22) 16(18.2) 19(30.6) 28(26) Main effect of primary outcome, n(%) 0.6
Statistically significant 96(64.6) 58(65.9) 38(61.3) 69(62) Not statistically significant 54(35.4) 30(34.1) 24(38.7) 42(38) Newcastle-Ottawa Quality Assessment Score, n(%) 0.82
0–3 5(3) 3(3) 2(3) 3(3)
4–6 88(59) 54(61) 34(55) 64(58)
7–8 57(38) 31(35) 26(29) 44(40)
HTE reporting 88(58.7) 88(100) – 49(44) Analysis of predictive factors on side effects, n(%) 2(1.3) 2(2.3) – 2(2) Prespecification of HTE analysis, n(%) 84(56) 84(95.4) – 46(94) Type of HTE analysis, n(%)
Subgroup 2(1.3) 2(2.3) – 2(4)
Adjusted 67(44.7) 67(76.1) – 34(69)
Propension 19(12.7) 19(21.6) – 13(27) Predictive variables studied, n(%)
Age 30(20) 30(34) – 30(61) Sexe 15(10) 15(17) – 15(31) Social level 4(2.7) 4(4.5) – 4(8) Genetics 12(8) 12(13.6) – 12(24) Treatment 66(44) 66(75) – 27(55) Comorbidities 31(20.7) 31(35) – 31(63) Severity of disease 13(8.7) 13(14.7) – 13(26) Prognostic variables studied, n(%) 51(34) 31(35.2) 20(3.2) 0.73 31(28) Analysis of prognostic factors on side effect, n(%) 2(1.3) 1(1.1) 1(1.6) 0.71 1(1) Interaction test, n(%) 27(18) 27(31) 0(0) – 8(7) a
excluding studies assessing only a form of treatment
to Plos Medicine. Eligible cohorts were identified in low impact journals without the need to correct for numbers.
Study characteristics
Overall, the median number of patients included was 1633 (Q1 – Q3: 310–9505), 100 (67%) were funded by the industry, and 89 (60%) reported on the effect of a pharmacological treatment (Table 1). Sixty-five (44%) co-hort studies addressed time-to-event data, and the pri-mary comparison was significant for 96 (65%) studies. Eighty-eight (59%) studies rated moderately on the Newcastle-Ottawa quality assessment score, and 57 (38%) good.
Eighty-eight (59%) studies reported HTE and 62 (41%) did not (Table 1). Studies reporting HTE had a larger sample size (P < 0.001) and length of follow up (P < 0.001), were more likely to be found in high impact jour-nals (P < 0.001), more often assessed a pharmacological treatment (P < 0.001) and addressed time-to-event data (P = 0.004). Among the 88 studies reporting on HTE, 84 (95%) pre-specified the analysis in the method section and the most frequent predictive variables evaluated were age (n = 30, 34%), comorbidities (n = 31, 35%) and treatment (n = 66, 75%). Also among the studies report-ing HTE, 2(2%) used subgroup analyses, 67(76%) ad-justed analysis and 19(22%) propension score methods. An interaction test was performed in 27 studies (18%) [17]. Thirty-nine studies only looked at the heterogeneity of treatment effect in variation of the treatment itself; when excluding these studies from the comparison,
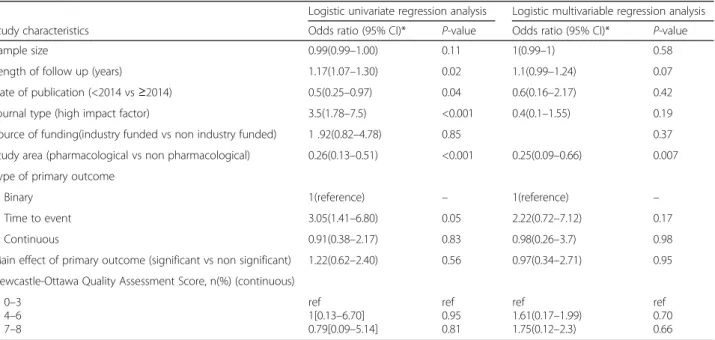
there were no differences in the main analysis (Table 1). On multivariable regression analysis, the most important predictors of reporting HTE analysis in the study was the study area (OR: 0.25, 95% CI: 0.09–0.66; P = 0.007) with studies evaluating a pharmacological treatment more likely to report HTE (Table 2).
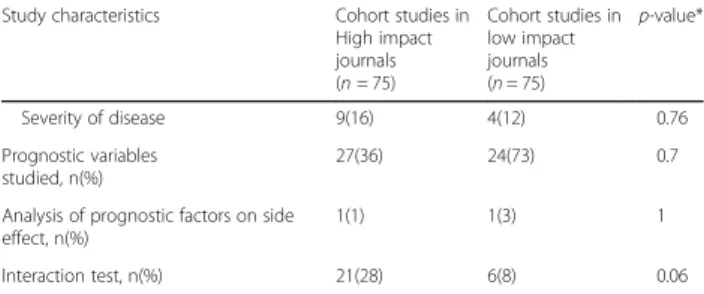
By design, 75 cohort studies were from high impact journals and 75 were from low impact journals. Of the 88 studies reporting HTE, 55 (73%) were reported in high impact journals studies and 33 (27%) in low impact journals; this difference was statistically significant (P < 0.001) (Table 3). High impact journals studies were more likely to have a larger sample size (P < 0.001) and a lon-ger follow up (P = 0.002) (Table 3). Furthermore, time-to-event data were more frequent in high impact jour-nals (P = 0.001) and results more often significant on the primary outcome analysis (P = 0.02). When HTE was re-ported, the pre-specification of HTE analysis in high im-pact journals studies (P = 0.15) and the different type of HTE analysis was similar in both groups; there was no difference in the proportion of variables analyzed for prediction except for medical history (P = 0.03).
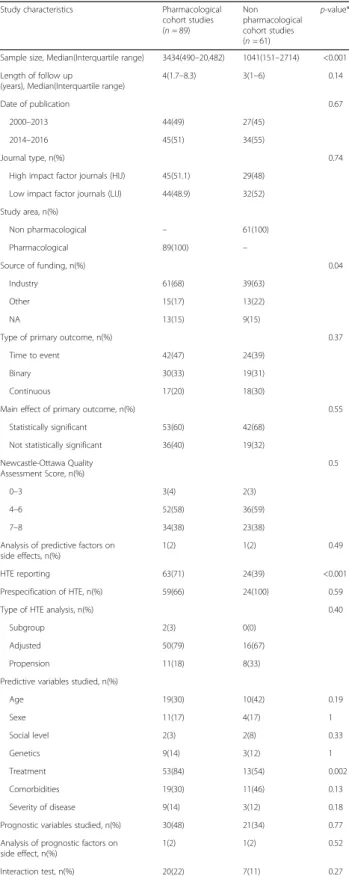
Eighty-nine cohort studies (59%) evaluated a pharmaco-logical treatment and 61 (41%) did not (Table 4). Pharma-cological studies were larger (P < 0.001) and reported the analysis of predictive factors more often (P < 0.001). Also, there was more industry funded studies in pharmaco-logical studies (p = 0.04). The form of treatment was more often analyzed as a predictive variable in pharmacological studies (p = 0.002) (Table 4).
Table 2 Univariate et multivariable regression analysis of factors associated with reporting versus not reporting of HTE analysis
Logistic univariate regression analysis Logistic multivariable regression analysis
Study characteristics Odds ratio (95% CI)* P-value Odds ratio (95% CI)* P-value
Sample size 0.99(0.99–1.00) 0.11 1(0.99–1) 0.58
Length of follow up (years) 1.17(1.07–1.30) 0.02 1.1(0.99–1.24) 0.07
Date of publication (<2014 vs≥2014) 0.5(0.25–0.97) 0.04 0.6(0.16–2.17) 0.42
Journal type (high impact factor) 3.5(1.78–7.5) <0.001 0.4(0.1–1.55) 0.19
Source of funding(industry funded vs non industry funded) 1 .92(0.82–4.78) 0.85 0.37 Study area (pharmacological vs non pharmacological) 0.26(0.13–0.51) <0.001 0.25(0.09–0.66) 0.007 Type of primary outcome
Binary 1(reference) – 1(reference) –
Time to event 3.05(1.41–6.80) 0.05 2.22(0.72–7.12) 0.17
Continuous 0.91(0.38–2.17) 0.83 0.98(0.26–3.7) 0.98
Main effect of primary outcome (significant vs non significant) 1.22(0.62–2.40) 0.56 0.97(0.34–2.71) 0.95 Newcastle-Ottawa Quality Assessment Score, n(%) (continuous)
0–3 4–6 7–8 ref 1[0.13–6.70] 0.79[0.09–5.14] ref 0.95 0.81 ref 1.61(0.17–1.99) 1.75(0.12–2.3) ref 0.70 0.66
*in our model, we adjusted on the following variables: source of funding, study area, journal type, main effect of primary outcome, type of primary outcome, quality of the cohort
Risk of bias within studies
A total of 88 (59%) studies, 54 (61%) in the HTE group and 34 (55%) in the non HTE group, rated good on the New-castle Ottawa Quality Assessment Score with no difference between both groups. However, we found that studies re-ported in high impact journals had a greater quality score than the studies from low impact journals (P = 0.03) (table 3). The quality assessment score was not associated with the likelihood of reporting HTE (P = 0.82).
Additional analysis
A sensitivity analysis excluding studies only looking at the heterogeneity in the form of the treatment from the HTE group revealed no relevant differences from the main analyses. It was the same for the analysis about only the good quality cohort studies (Table 5).
Discussion
Addressing heterogeneity is an interesting method to in-crease treatment efficiency and dein-crease unnecessary side effects and health care costs. Heterogeneity is now rather well documented in randomized controlled trials (RCTs) [18–21]. However, cohort studies present differ-ent methodological issues which warrant caution when measuring and reporting heterogeneity [22]. Because there was no previous information of how heterogeneity is reported in cohort studies we conducted a review of the literature.
Summary of evidence
We found that 59% of cohort studies reported HTE. This is significantly more than previously reported for randomized trials [23]. Sun and colleagues in a review of 469 trials found that 44% reported a sub-group analysis [4]. Two possible reasons explaining this difference are wider inclusion criteria and less standardized method-ology. Cohort studies are known to include patients at the extreme of selection variables. For instance, cohort studies are more likely to include older patients, patients with more comorbidities, and those with more severe diseases [24]. Therefore, given these patients are
Table 3 Study characteristics in cohort studies in high impact journals and in low impact journals
Study characteristics Cohort studies in High impact journals (n = 75) Cohort studies in low impact journals (n = 75) p-value*
Sample size, Median (Interquartile range) 4176(1274– 23,452) 415(138.5–2586) <0.001 Length of follow up (years), Median (Interquartile range) 5(2–10) 2.1(1–5) 0.002 Date of publication <0.001 2000–2013 57(76) 13(17) 2014–2016 17(24) 62(83) Journal type, n(%)
High impact factor journals (HIJ) 75(100) – Low impact factor journals (LIJ) – 75(100)
Study area, n(%) 0.81 Interventional 23(30.7) 27(34) Pharmacological 46(61.3) 43(57) Other 6(8) 5(9) Source of funding, n (%) 0.15 Industry 51(68) 49(65) Other 18(24) 12(16) NA 6(8) 14(19) Type of primary outcome, n (%) 0.001 Time to event 44(58.7) 21(28) Binary 19(25.3) 31(41) Continuous 12(16) 23(31) Main effect of primary outcome,
n (%)
0.02
Statistically significant 55(73) 41(54.7) Not statistically significant 20(27) 34(45.3) Newcastle-Ottawa Quality Assessment
Score, n(%) 0.03 0–3 1(2) 4(5) 4–6 46(61) 42(56) 7–8 28(37) 29(39) HTE reporting 55(73) 33(44) <0.001 Analysis of predictive factors on side
effects, n(%)
2(4) 0(0) 0.53
Prespecification of HTE, n(%) 54(98) 30(91) 0.15 Type of HTE analysis, n(%) 0.44
Subgroup 1(2) 1(3) Adjusted 40(73) 27(82) Propension 14(25) 5(15) Predictive variables studied, n(%) Age 23(42) 7(21) 0.06 Sexe 12(22) 3(9) 0.15 Social level 2(4) 2(6) 0.63 Genetics 2(4) 1(3) 0.03 Treatment 44(80) 22(67) 0.21 Comorbidities 23(42) 8(24) 0.11
Table 3 Study characteristics in cohort studies in high impact journals and in low impact journals (Continued)
Study characteristics Cohort studies in High impact journals (n = 75) Cohort studies in low impact journals (n = 75) p-value* Severity of disease 9(16) 4(12) 0.76 Prognostic variables studied, n(%) 27(36) 24(73) 0.7
Analysis of prognostic factors on side effect, n(%)
1(1) 1(3) 1
Interaction test, n(%) 21(28) 6(8) 0.06 *to determinate p-value we used the Wilcoxon rank sum test for the analysis of continuous data and the chi square/fisher test for binary data
included in the cohort, investigators may feel more pressed to analyze the effect of treatment in these par-ticular subgroups [25]. Age, sex, and comorbidities were the most frequent variables assessed for heterogeneity in our study (Table 1). Secondly, the guidelines to conduct and report cohort studies are more recent than those for randomized trials. The CONSORT statement dates back to 1996 [26] when the STROBE guidelines were first published in 2007 [27]. Interestingly cohort studies pub-lished before 2014 were more likely to report HTE than those published after 2013 (univariable OR = 0.5, 95% CI: 0.25–0.97; P value = 0.04). It could be that re-searchers, with increased awareness of the methodo-logical issues of HTE analyses, are now being more cautious with subgroup analyses. Factors associated with increased reporting of HTE were cohorts published in a high impact factor journal and cohorts reporting on a pharmacological treatment. The reason for increased reporting of HTE in studies published in high impact journal could be that better studies yield more questions among investigators, reviewers and editors. Accordingly, cohort studies published in high impact journals were more frequently likely to pre-specify HTE analyses in the methods than those published in lower impact jour-nals. It has been previously reported that HTE analyses are more frequently reported in pharmacological treat-ments [2]. Some issues were found in the use of HTE: analyses were not prespecified frequently enough; selec-tion bias were not accounted for by adequate methods very often (propensity scores) [28].
Contrary to that reported by Sun and colleagues for randomized studies [4], we did not find an association between the source of funding and the reporting of HTE in the cohort. Because cohort studies are not decisional it could well be that sponsors find little incentive in planning, or in performing in retrospect, subgroup ana-lyses [29, 30].
Furthermore, we found that in high impact journals studies, compared to low impact journals studies, there were more analyses of HTE, with more significant result for the primary outcome. The higher rate of reporting HTE in high impact journals may be a result of the inde-pendent efforts of investigators. Alternatively, editors and reviewers in high impact journals may be more in-clined to request such analyses than those in journals with a lower impact.
Compared to cohorts the main difference lies in the fact that the strength of association between RCTs fund-ing and reportfund-ing of subgroup differed in trials with and without statistically significant primary outcomes [31]. In RCTs without statistically significant results for the primary outcome, industry funded trials were more likely to report subgroup analyses (OR: 2.29, CI (95%):1.30 to 4.72) than non-industry funded trials [4].
Table 4 study characteristics in pharmacological cohort studies and in non pharmacological cohort studies
Study characteristics Pharmacological cohort studies (n = 89) Non pharmacological cohort studies (n = 61) p-value*
Sample size, Median(Interquartile range) 3434(490–20,482) 1041(151–2714) <0.001 Length of follow up
(years), Median(Interquartile range)
4(1.7–8.3) 3(1–6) 0.14
Date of publication 0.67
2000–2013 44(49) 27(45) 2014–2016 45(51) 34(55)
Journal type, n(%) 0.74
High impact factor journals (HIJ) 45(51.1) 29(48) Low impact factor journals (LIJ) 44(48.9) 32(52) Study area, n(%) Non pharmacological – 61(100) Pharmacological 89(100) – Source of funding, n(%) 0.04 Industry 61(68) 39(63) Other 15(17) 13(22) NA 13(15) 9(15)
Type of primary outcome, n(%) 0.37 Time to event 42(47) 24(39)
Binary 30(33) 19(31)
Continuous 17(20) 18(30)
Main effect of primary outcome, n(%) 0.55 Statistically significant 53(60) 42(68)
Not statistically significant 36(40) 19(32) Newcastle-Ottawa Quality Assessment Score, n(%) 0.5 0–3 3(4) 2(3) 4–6 52(58) 36(59) 7–8 34(38) 23(38)
Analysis of predictive factors on side effects, n(%)
1(2) 1(2) 0.49
HTE reporting 63(71) 24(39) <0.001 Prespecification of HTE, n(%) 59(66) 24(100) 0.59 Type of HTE analysis, n(%) 0.40
Subgroup 2(3) 0(0)
Adjusted 50(79) 16(67) Propension 11(18) 8(33) Predictive variables studied, n(%)
Age 19(30) 10(42) 0.19 Sexe 11(17) 4(17) 1 Social level 2(3) 2(8) 0.33 Genetics 9(14) 3(12) 1 Treatment 53(84) 13(54) 0.002 Comorbidities 19(30) 11(46) 0.13 Severity of disease 9(14) 3(12) 0.18 Prognostic variables studied, n(%) 30(48) 21(34) 0.77 Analysis of prognostic factors on
side effect, n(%)
1(2) 1(2) 0.52
Interaction test, n(%) 20(22) 7(11) 0.27 *to determinate p-value we used the Wilcoxon rank sum test for the analysis of continuous data and the chi square or fisher test for binary data
Industry funded trials were associated with less frequent prespecifCIation of subgroup hypotheses (31.3% v 38.0%, adjusted OR: 0.49, CI (95%):0.26 to 0.94), and less use of the interaction test for analyses of subgroup effects
(41.4% v 49.1%, OR:0.52, CI (95%):0.28 to 0.97) than non-industry funded trials [2]. That is not the case for cohort studies. Our results showed that the source of funding and the main effect of primary outcome was not
Table 5 Study characteristics in cohort studies of high quality (7 or 8 on the scale) reporting and not reporting THE
Study characteristics All studies
(n = 57)
Studies addressing HTE (n = 31)
Studies not addressing
HTE (n = 26) p-value*
Sample size, Med(Q1-Q3) 2438(415–19,486) 7484(1259–70,336) 470(166–2453) <0.001
Length of follow up (years), Med(Q1-Q3) 3(1–7) 5(2.2–11.8) 1(0.1–4) 0.002
Date of publication 0.2
2000–2013 28(49) 18(58) 10(38.5)
2014–2016 29(51) 13(42) 16(61.5)
Journal type, n(%) <0.001
High impact factor journals (HIJ) 28(49) 22(71) 6(23)
Low impact factor journals (LIJ) 29(51) 9(29) 20(77)
Source of funding, n(%) 0.68 Industry 36(63) 23(74) 13(19) Other 10(17) 5(16) 5(50) NA 11(20) 3(10) 8(31) Study area, n(%) 0.02 Medical 34(60) 23(74) 11(42) Non medical 23(40) 8(26) 15(58)
Type of primary outcome, n(%) 0.05
Time to event 26(46) 18(58) 8(31)
Binary 16(28) 5(16) 11(42)
Continuous 15(26) 8(26) 7(27)
Main effect of primary outcome, n(%) 1
Statistically significant 36(63) 20(65) 16(62)
Not statistically significant 21(37) 11(35) 10(38)
Analysis of predictive factors on side effects, n(%) 0(0) 0(0) –
Prespecification of HTE analysis, n(%) 30(53) 30(97) –
Type of HTE analysis, n(%)
Subgroup 1(2) 1(3) –
Adjusted 23(40) 23(74) –
Propension 7(12) 7(23) –
Predictive variables studied, n(%)
Age 13(23) 18(58) – Sexe 7(12) 7(23) – Social level 2(3) 2(6) – Genetics 3(5) 3(10) – Treatment 27(47) 27(87) – Comorbidities 8(14) 8(26) – Severity of disease 6(11) 6(19) –
Prognostic variables studied, n(%) 20(35) 10(32) 10() 0.78
Analysis of prognostic factors on side effect, n(%) 0(0) 0(0) 0(0) –
Interaction test, n(%) 6(10) 6(19) 0(0) –
associated with the HTE analysis. These findings further support our hypothesis that RCTs funded by industry are more likely to look for positive subgroup findings when the results are non significant statistically, and suggest that, compared with non-industry funded trials, the quality of carrying out subgroup analyses is more questionable.
Limitations
Our study has several limitations. First the search terms for identifying a prospective controlled cohort study are quiet brief and this could possible over estimate all eligible studies from the particular journals; this point can likely result in selection bias [32]. We did not search all medical journals and therefore our findings may not be applicable to journals outside our sample. We did, however, include all core clinical journals. Then we di-chotomized the journals as high versus low impact and studies as industry funded versus non industry funded. These categorizations ignore both gradients.
One of the limitation is that if journals were randomly selected within their subgroup (low or high impact), studies themselves were identified in a reverse chrono-logical order and constitute a biased sample of all pro-spective cohort studies within each journal. This bias probably favors a better reporting of heterogeneity in our sample.
Only 150 cohort studies were analyzed. This could be a limitation to provide precise estimates. However, the precision of a 50% probability with 150 trials is +/−8% wich is reasonable.
We did not classify HTE analyses into descriptive or confirmatory as reported by Varadhan R. and colleagues [33]. Although this would have been an interesting the-oretical point, it is actually extremely difficult to differ-entiate between both analyses in practice.
Another limitation is that journal impact factor stands for various other variables such as notoriety, expertise area (although these are general medical journals), submission guidelines, reviewing and editor-ial process and quality, etc. By comparing low and high impact journal factors we could not identify pre-cisely which variables have an effect on reporting het-erogeneity of treatment effect.
Conclusions
More than 50% of cohort studies published in core clinical journals report some form of heterogeneity of treatment effect analysis. About 20% of cohort studies have adequate methods to account for selection biases. A test for the sig-nificance of heterogeneity in the treatment effect is per-formed in only 18% of cohort studies. Prospective cohort studies published in high impact journals, with larger sam-ple size and longer follow up, studying pharmacological
effect of a treatment on a time-to-event primary outcome are associated with more frequent HTE reporting. After multivariable adjustment, the most predictive values asso-ciated with reporting HTE were the impact of the journal and the pharmacological study area. Potentially, an im-portant demand will be placed on observational studies to produce evidence to inform decision on some specific subgroup of patients. There is clearly a need for improve-ment and more clarification of reporting HTE and his analysis [34].
Additional file
Additional file 1: The Newcastle-Ottawa Quality Assessment Score [35]. (DOCX 11 kb)
Abbreviations
BMJ:British Medical Journal; BRAF: BRAF is a human gene that encodes a protein called B-Raf involved in sending signals inside cells that direct cell growth; CI: Confident Interval; CONSORT: Consolidated Standards of Reporting Trials; HTE: Heterogeneity of treatment; JAMA: Journal of the American Medical Association; OR: Odds ratio; RCTs: Randomized controlled trials; STROBE: Strengthening the reporting of Observational studies in Epidemiology; VS: Versus
Acknowledgments Not applicable. Funding No funding.
Availability of data and materials
The datasets used and/or analyzed during the current study are available from the corresponding author on reasonable request.
Author’s contributions
Conception and design: DB, MD, RP. Acquisition of data: DB, MD, CS. Analysis and interpretation of data: DB, MD, CS, RP. Involved in drafting the manuscript or revising it critically for important intellectual content: DB, MD, CS, RP. Given final approval of the version to be published. Each author should have participated sufficiently in the work to take public responsibility for appropriate portions of the content: DB, MD, CS, RP. Agreed to be accountable for all aspects of the work in ensuring that questions related to the accuracy or integrity of any part of the work are appropriately investigated and resolved: DB, MD, CS, RP.
Ethics approval and consent to participate Not applicable.
Consent for publication Not applicable. Competing interests
The authors declare that they have no competing interests.
Publisher’s Note
Springer Nature remains neutral with regard to jurisdictional claims in published maps and institutional affiliations.
Received: 14 June 2017 Accepted: 22 December 2017
References
1. Chapman PB, et al. Improved survival with vemurafenib in melanoma with BRAF V600E mutation. N Engl J Med. 2011;
2. Hernandez AV, et al. Subgroup analyses in therapeutic cardiovascular clinical trials: are most of them misleading? Am Heart J. 2006;151:257–64. 3. Guyatt G, Wyer PC, Ioannidis J. When to believe a subgroup analysis. In:
Guyatt G, editor. User’s guide to the medical literature: a manual for evidence-based clinical practice; 2008. p. 571–83.
4. Sun X, et al. The influence of study characteristics on reporting of subgroup analyses in randomized controlled trials: systematic review. BMJ. 2011;342: d1569. https://doi.org/10.1136/bmj. d1569.
5. Sun X, co. Credibility of claims of subgroup effects in randomised controlled trials: systematic review. BMJ. 2012;344:e1553. https://doi.org/10.1136/bmj. e1553.
6. Heiat A, Gross CP, Krumholz HM. Representation of the elderly, women, and minorities in heart failure clinical trials. Arch Intern Med. 2002; 162(15):1682–8.
7. Kyriacou DN, Lewis RJ. Confounding by indication in clinical research. JAMA. 2016 Nov 1;316(17):1818–9.
8. Varadhan R, et al. A framework for the analysis of heterogeneity of treatment effect in patient-centered outcomes research. J Clin Epidemiol. 2013;66(8):818–25. https://doi.org/10.1016/j/jclinepi.2013.02.009. 9. Pocock SJ, Hughes MD, Lee RJ. Statistical problems in the reporting of
clinical trials. A survey of three medical journals. N Engl J Med. 1987;317: 426–32.
10. Annals of Internal Medicine. http://annals.org/
11. The BMJ: leading general medical journal. Research. http://www.bmj.com/ 12. The JAMA Network | Home of JAMA and the Specialty Journals of the
American Medical Association. http://jama.jamanetwork.com/journal.aspx 13. The Lancet journal. http://www.thelancet.com/
14. The New England Journal of Medicine: Research & Review Articles. http:// www.nejm.org/k
15. PLOS Medicine: A Peer-Reviewed Open-Access Journal. http://journals.plos. org/plosmedicine/
16. Assmann SF, et al. Subgroup analysis and other (mis)uses of baseline data in clinical trials. Lancet. 2000;355:1064–9.
17. Rothwell PM. Treating individuals 2. Subgroup analysis in randomised controlled trials: importance, indications, and interpretation. Lancet. 2005; 365(9454):176–86.
18. Wang R, et al. Statistics in medicine reporting of subgroup analyses in clinical trials. N Engl J Med. 2007;357:2189–94.
19. Liberati A, co. The PRISMA statement for reporting systematic reviews and meta-analyses of studies that evaluate health care interventions: explanation and elaboration. J Clin Epidemiol. 2009;62(10):e1–34. https://doi.org/10.1016/ j.jclinepi.2009.06.006.
20. Gabler N, et al. Dealing with heterogeneity of treatment effects: is the literature up to the challenge? Trials. 2009;10:43.
21. Varadhan R. Johns Hopkins. In: Chapter 3. Estimation and reporting of heterogeneity of treatment effects. Developing an observational CER protocol: a user’s guide.
22. Yusuf S, Wittes J, et al. Analysis and interpretation of treatment effects in subgroups of patients in randomized clinical trials. JAMA. 1991;266:93–8. 23. Alatorre CI, et al. A comprehensive review of predictive and prognostic
composite factors implicated in the heterogeneity of treatment response and outcome across disease areas. 2011 Blackwell publishing ltd. Int J Clin Pract. 2011;65(8):831–47.
24. Burke JF, et al. Three simple rules to ensure reasonably credible subgroup analyses. BMJ. 2015;351:h5651. https://doi.org/10.1136/bmj.h5651. 25. Altman DG. Better reporting of randomized controlled trials: the CONSORT
statement. BMJ. 1996;313(7057):570–1.
26. Von Elm E, et al. The strengthening the reporting of observational studies in epidemiology (STROBE) statement: guidelines for reporting observational studies. PLoS Med. 2007;4(10):e296. Review
27. Rassen JA, et al. Applying propensity scores estimated in a full cohort to adjust for confounding in subgroup analyses. Pharmacoepidemiol Drug Saf. 2012;21(7):697–709. https://doi.org/10.1002/pds.2256. Epub 2011 Dec 8 28. Perlis RH, et al. Industry sponsorship and financial conflict of interest in the
reporting of clinical trials in psychiatry. Am J Psychiatry. 2005;162:1957–60. 29. National Library of Medicine. Abridged index medicus (aim or“core clinical”)
journal titles. 2015. www.nlm.nih.gov/bsd/aim.html.
30. Boutron I, et al. Reporting and interpretation of randomized controlled trials with statistically nonsignificant results for primary outcomes. JAMA. 2010; 303:2058–64.
31. Rothman KJ, Greenland S, Walker AM. Concepts of interaction. Am J Epidemiol. 1980;112:467–70.
32. Sox HC, Helfand M, Grimshaw J, Dickersin K. PLoS medicine editors, Tovey D, Knottnerus JA, Tugwell P. Comparative effectiveness research: challenges for medical journals. Am J Manag Care. 2010;16(5):e131–3.
33. Brookes ST, et al. Subgroup analyses in randomized trials: risks of subgroup-specific analyses; power and sample size for the interaction test. J Clin Epidemiol. 2004;57:229–36.
34. Rubin DB. For objective causal inference, design trumps analysis. Ann Appl Stat. 2008;2(3):808–40.
35. GA Wells, B Shea, D O'Connell, J Peterson, V Welch, M Losos, P Tugwell. The Newcastle-Ottawa scale (NOS) for assessing the quality of nonrandomised studies in meta-analyses. http://www.ohri.ca/programs/clinical_ epidemiology/oxford.asp.
• We accept pre-submission inquiries
• Our selector tool helps you to find the most relevant journal
• We provide round the clock customer support
• Convenient online submission
• Thorough peer review
• Inclusion in PubMed and all major indexing services
• Maximum visibility for your research Submit your manuscript at
www.biomedcentral.com/submit