HAL Id: hal-00300982
https://hal.archives-ouvertes.fr/hal-00300982
Submitted on 10 Feb 2006HAL is a multi-disciplinary open access
archive for the deposit and dissemination of sci-entific research documents, whether they are pub-lished or not. The documents may come from teaching and research institutions in France or abroad, or from public or private research centers.
L’archive ouverte pluridisciplinaire HAL, est destinée au dépôt et à la diffusion de documents scientifiques de niveau recherche, publiés ou non, émanant des établissements d’enseignement et de recherche français ou étrangers, des laboratoires publics ou privés.
Switching cloud cover and dynamical regimes from open
to closed Benard cells in response to the suppression of
precipitation by aerosols
D. Rosenfeld, Y. J. Kaufman, I. Koren
To cite this version:
D. Rosenfeld, Y. J. Kaufman, I. Koren. Switching cloud cover and dynamical regimes from open to closed Benard cells in response to the suppression of precipitation by aerosols. Atmospheric Chemistry and Physics Discussions, European Geosciences Union, 2006, 6 (1), pp.1179-1198. �hal-00300982�
ACPD
6, 1179–1198, 2006Aerosols closing open Benard cells
D. Rosenfeld et al. Title Page Abstract Introduction Conclusions References Tables Figures J I J I Back Close
Full Screen / Esc
Print Version Interactive Discussion
EGU
Atmos. Chem. Phys. Discuss., 6, 1179–1198, 2006 www.atmos-chem-phys.org/acpd/6/1179/
SRef-ID: 1680-7375/acpd/2006-6-1179 European Geosciences Union
Atmospheric Chemistry and Physics Discussions
Switching cloud cover and dynamical
regimes from open to closed Benard cells
in response to the suppression of
precipitation by aerosols
D. Rosenfeld1, Y. J. Kaufman2, and I. Koren3 1
Institute of Earth Sciences, The Hebrew University, Jerusalem 91904, Israel
2
NASA/Goddard Space Flight Center, Greenbelt, MD 20771, USA
3
Department of Environmental Sciences, Weizmann Institute, Rehovot 76100, Israel
Received: 7 November 2005 – Accepted: 13 December 2005 – Published: 10 February 2006 Correspondence to: D. Rosenfeld (daniel.rosenfeld@huji.ac.il)
ACPD
6, 1179–1198, 2006Aerosols closing open Benard cells
D. Rosenfeld et al. Title Page Abstract Introduction Conclusions References Tables Figures J I J I Back Close
Full Screen / Esc
Print Version Interactive Discussion
EGU Abstract
The dynamic structure of the atmospheric marine boundary layer (MBL) supports two distinct states of cloud cover: closed and open Benard cellular convection. Closed cells are nearly fully cloud covered, while the open cells have <40% cloud cover. Here we show that aerosols have a greater than expected impact on the cloud cover by
5
changing the mode of cellular convection. By suppressing precipitation aerosols can reverse the direction of the airflow, converting the cloud structure from open to closed cells and doubling the cloud cover. The two states possess positive feedbacks for self maintenance, so that small changes of the conditions can lead to bifurcation of the MBL cloud regime. The transition occurs at near pristine background level of aerosols,
10
creating a large sensitivity of cloud radiative forcing to very small changes in aerosols at the MBL. This can have a major impact on global temperatures.
1. Brief review of the effects of aerosols on the cover of marine stratocumulus clouds
Until recently most of the attention in the area of cloud-aerosol interactions has been
15
focused on the effects of aerosols producing greater concentrations of smaller drops for a given vertically integrated cloud liquid water path (LWP). This increases cloud albedo, resulting in more incoming radiation being reflected back to space, producing a cooling effect that balances some of the global warming induced by greenhouse gases (Twomey, 1977). Other effects related to the impacts of aerosols on precipitation were
20
also recognized. As early as 1957 it was suggested by Gunn and Phillips (1957), based on cloud chamber experiments, that “the presence of large numbers of contaminating
particles in the lower atmosphere acts to generate clouds that do not precipitate but persist in the atmosphere until they re-evaporate. Thus, cloudiness rather than rainfall is characteristic of saturated and highly polluted air masses”. Indeed, recent
satel-25
ACPD
6, 1179–1198, 2006Aerosols closing open Benard cells
D. Rosenfeld et al. Title Page Abstract Introduction Conclusions References Tables Figures J I J I Back Close
Full Screen / Esc
Print Version Interactive Discussion
EGU
2003; Kaufman et al., 2005) have revealed that the radiative forcing at the top of the atmosphere due to increased cloud fractional cover (CF) and increased LWP produce much more cooling than the Twomey effect (Twomey, 1977). Therefore, it was expected that there would be a monotonic relationship of increasing N (aerosols concentration) with increasing LWP and CF. Although the first studies of ship tracks (Coakley et al.,
5
1987) confirmed these relationships, more recent and extensive satellite observations showed little relation between N and LWP of the clouds in the ship tracks and adjacent undisturbed clouds (Platnick et al., 2000; Coakley, 2002).
The apparent complex relations between N, CF and LWP can be appreciated based on the following brief review of the marine stratocumulus cloud processes. Marine
stra-10
tocumulus are maintained by radiative cooling at their tops, which causes an inverse convection of the cooled air parcels near cloud tops. The evaporation of cloud water into the descending air parcels allows them to descend following a moist adiabat and penetrate deep into the MBL. The apparent lack of dependence of CF and LWP on N in these clouds can be explained by a mechanism in which the loss of cloud water to
15
drizzle would be balanced to some extent by the fact that reduced cloud water allows weaker moist inverse convection and hence less drying due to entrainment of air from the free troposphere (FT) above the cloud tops. Conversely, additional cloud water en-hances entrainment by additional evaporative cooling of the moist inverse convection that is driven by the radiative cooling at the top of the cloud covered marine boundary
20
layer (Randall, 1980a; Ackerman et al., 2004). This balance between cloud water and the amount of entrainment can work only up to the point where drizzle is strong enough to actually reach the surface at a greater rate than surface evaporation, drying the MBL even more than the lack of drizzle would dry the MBL through enhanced mixing with the dry FT above (Randall, 1980a; Ackerman et al., 2004).
25
The onset of intense drizzle occurs when the air becomes sufficiently clean, or when the clouds become sufficiently deep (Gerber, 1996; VanZanten et al., 2005). Ackerman et al. (1993) and later Hegg (1999), using a 1-D model, calculated that if the rain-out of CCN via collision-coalescence is sufficiently rapid to exceed the source strength of
ACPD
6, 1179–1198, 2006Aerosols closing open Benard cells
D. Rosenfeld et al. Title Page Abstract Introduction Conclusions References Tables Figures J I J I Back Close
Full Screen / Esc
Print Version Interactive Discussion
EGU
CCN in the boundary layer, the cleansing of the air will eventually lead to a dissipation of a stratocumulus layer by its raining out. In fact, this is a runaway process with a positive feedback, because for fewer CCN the coalescence and rainout become more efficient and rapid. In their simulations the cloud droplet number concentration (N) decreased very slowly until reaching 30–40 cm−3, and then dropped sharply to about
5
4 cm−3. The point of sharp decrease is the point where cloud drops are depleted to the point where they grow diffusionally to the threshold of drizzle size, in agreement with the criteria of Gerber (1996). The onset of this runaway cleansing and clearing occurs after 1 to 5 days, depending on the model initial values (Ackerman et al., 1993). This runaway effect is a basis for a situation of bistability (Baker and Charlson 1990;
10
Gerber, 1996), where once the atmosphere has reached a very clean situation the highly efficient rainout mechanisms will keep it clean until it will be overwhelmed by a strong source such as smoke from ship stacks or anthropogenic emissions over land. In addition, there is a positive feedback mechanism that prevents replenishing the CCN in the cleansed MBL from the FT. Most of the mixing with the FT takes place by the
15
mechanism of inverse moist convection into the clouds, which is stronger with larger CF and greater LWP. Therefore, the decreased LWP, CCN and cloud cover reduce the entrainment of FT air into the MBL (Randall, 1980b; Stevens et al., 2005), and with that also reduce the replenishment of CCN from above (Jiang et al., 2002). This further reinforces a bistability of two cloud cover regimes, one with high CCN and suppressed
20
precipitation and large CF, and the other with drizzle, which cleans the MBL and leads to a positive feedback producing further scavenging of the CCN, enhanced drizzle and ultimately little cloud cover.
Cloud simulations of Baker and Charlson (1990) suggested that this bistability of cloud cover is coupled with CCN concentrations. However, Ackerman et al. (1994),
25
using more advanced cloud simulations, showed that there is a more gradual transition from the low cloud cover and CCN regime to the high cloud cover and CCN regime. Apparently the bistability of cloud cover and CCN does occur in nature, as evidenced by the sharp transitions between the two cloud cover and drizzle regimes (Stevens,
ACPD
6, 1179–1198, 2006Aerosols closing open Benard cells
D. Rosenfeld et al. Title Page Abstract Introduction Conclusions References Tables Figures J I J I Back Close
Full Screen / Esc
Print Version Interactive Discussion
EGU
2005). This means that the onset of heavy drizzle and scavenging of CCN that were considered by Baker and Charlson (1990) and Ackerman et al. (1994) needs to be complemented by some other not yet identified processes to explain the bistability. This was recognized by Wood and Hartmann (2006), who documented a climatological average CF of open and closed Benard cells of 0.5 and 0.9, respectively. They wrote
5
that “lack of sensitivity of the cellular convection type (open or closed) to the large
scale meteorology suggest that a mechanism internal to the MBL may be important in determining the cellular convection type, by a mechanism yet to be determined ”. We
suggest in Sect. 3 that the missing mechanism is a dynamic response of the MBL to the aerosol impacts on cloud microstructure, precipitation and vertical energy fluxes.
10
2. Hitherto unexplained sensitivities of the cloud cover
In this paper we consolidate the accumulated knowledge above with new observations and analyses (Fig. 1) to point to a new paradigm (Fig. 2) of the aerosol effect on ma-rine stratocumulus CF that affects the transition between the closed and open Benard cellular convective regimes.
15
Kaufman et al. (2005) used the MODIS (MODerate resolution Imaging Spectrora-diometer) data on the Terra satellite to measure the daily aerosol column concentration and its correlation to the local stratiform and trade cumulus cloud cover and properties. MODIS observes detailed aerosol and cloud properties with resolution of 0.5–1 km. Kaufman et al. (2005) summarized the data for all of June–August 2002 into a daily
20
1◦×1◦latitude and longitude grid. Simultaneous observations of aerosols in cloud-free regions of a 1◦×1◦grid box and observations of cloud properties in the cloudy regions within the same grid box are possible. These simultaneous observations of aerosols and cloud properties were related to each other at Fig. 1. The CF and cloud droplet effective radius, DER, are sorted with AOD (aerosol optical depth) and averaged in
25
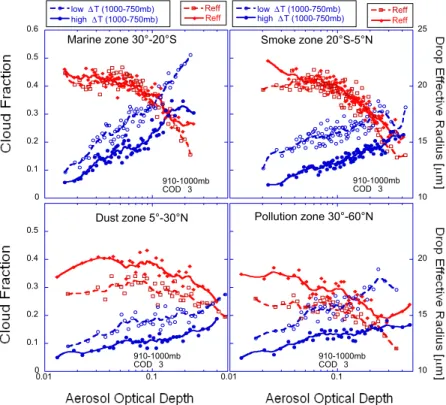
groups of 50 points of 1×1◦, similar to Kaufman et al. (2005). Figure 1 shows that CF increases with AOD while DER decreases with increasing AOD. This provides
ob-ACPD
6, 1179–1198, 2006Aerosols closing open Benard cells
D. Rosenfeld et al. Title Page Abstract Introduction Conclusions References Tables Figures J I J I Back Close
Full Screen / Esc
Print Version Interactive Discussion
EGU
servational support for the aerosols enhancing CF by reducing DER and suppressing precipitation.
In addition, the respective roles of thermodynamics and aerosols were investigated. The meteorological fields were obtained from the NCEP (National Center for Environ-mental Prediction) data. The difference in air temperature between 1000 and 750 mb
5
(∆T) was found to be the best correlated parameter with the shallow (up to tops of 910 mb) cloud fraction (r=−0.35), because lower ∆T indicates a stronger temperature inversion, which caps more extensive marine stratocumulus cloud cover.
The data in Fig. 1 were separated for the lowest and highest 1/3 of∆T, so that the fig-ure shows the sensitivity of shallow cloud CF to AOD as a function of the atmospheric
10
instability (∆T). This analysis shows the remarkable observation that CF depends on AOD to an equal or greater extent than on the lower tropospheric instability, in agree-ment with the stateagree-ment of Wood and Hartmann (2006) that is quoted here at the ending of Sect. 1. Figure 1 also supports the suggestion of a runaway cleansing ef-fect of CCN, as manifested by the strong decrease of CF that is associated with AOD
15
decreasing from 0.10 to 0.02. The decreasing of DER with increasing AOD supports the physical link between CF and AOD. The repeated observations in the very different dynamic and aerosol regimes, as indicated in the four panels of Fig. 1, indicate that the strong decrease of CF with decreases in AOD is an inherent process that manifests itself in a wide range of meteorological and aerosol regimes.
20
3. Aerosols closing open Benard cells
Boundary layer clouds in a weakly sheared environment occur in two main modes: open and closed cellular convection. Open cellular convection occurs when the con-vection is driven mainly by surface heating that causes the air to rise in the cell walls and have a compensating sinking in the middle of the cells. Closed Benard cells occur
25
when instead of surface heating the main driver of the convection is radiative cooling at the cloud tops and gravitational sinking of the cooled air along the walls of the cells,
ACPD
6, 1179–1198, 2006Aerosols closing open Benard cells
D. Rosenfeld et al. Title Page Abstract Introduction Conclusions References Tables Figures J I J I Back Close
Full Screen / Esc
Print Version Interactive Discussion
EGU
compensated by rising air in the middle of the cells (Agee et al., 1973). Closed Benard cells can be maintained because most of the area is occupied by clouds formed by the slow compensating rising motion, and these clouds provide the radiative cooling from the top that is necessary for maintaining the circulation of closed Benard cells. This closed cellular convection is the typical regime for the lightly or non-drizzling,
5
radiatively-cooled, driven boundary layer clouds (Fig. 2a). The development of drizzle can, in addition to depleting the water from the cloud layer, cool the lower layers, en-hance the heat flux from the sea surface into the bottom of the MBL and stabilize the cloudy layer above (Paluch and Lenschow, 1991). This leads to decoupling the upper cloud deck from the lower MBL and hence from replenishing moisture from the sea
10
surface, so that entrainment and drizzling can lead eventually to loss of cloud water and breakup (Fig. 2b). Under sufficiently low CCN conditions the clouds would lose water and clear to the extent that radiative cooling would no longer be strongest at the top of the MBL, but rather come mainly from the water vapor deeper in the MBL, so that radiative cooling would come from deeper in the MBL. This radiative cooling
15
of the lower MBL, along with the evaporative cooling from the drizzle that caused the decoupling in the first place, enhance the MBL sensible and latent heating from the sea surface below at the expense of the radiative cooling flux at the top of the MBL (Ran-dall, 1980b) (Fig. 2c). Eventually the reversal of the direction that drives the convection results in respective reversal of the convection from a regime of closed to open Benard
20
cells (Fig. 2d), so that small convective clouds replace the previous full stratiform cloud cover. The updrafts in the convective elements of the open cells are likely greater than in the stratiform clouds of the closed cells. This leads to stronger drizzle for the same CCN concentrations, because the drizzle drops remain in the updrafts longer and col-lect a greater number of other cloud drops (Feingold et al., 1996). This is a mechanism
25
by which reduction of CCN below a certain threshold can lead to a regime change from closed to open Benard cells with a dramatic decrease in the modal cloud cover fraction from near unity to about 0.25 in the example in Figs. 2–4. This mechanism is supported by observations showing that the transition from closed to open cells is
ACPD
6, 1179–1198, 2006Aerosols closing open Benard cells
D. Rosenfeld et al. Title Page Abstract Introduction Conclusions References Tables Figures J I J I Back Close
Full Screen / Esc
Print Version Interactive Discussion
EGU
associated with the onset of heavy drizzle and the depletion of the aerosols (Stevens et al., 2005). Furthermore, the runaway effect of the depletion of CCN can lead to the near complete clearing of the clouds, as shown in Fig. 2e. Such areas where clouds fail to form due to lack of sufficient CCN can be recognized by the occurrence of con-spicuously visible ship tracks in otherwise cloud free areas. Simulations have shown
5
that more strongly drizzling clouds become shallower (Pincus and Baker, 1994), but the observations suggest that this continues until the clouds are nearly eliminated alto-gether with the runaway effect of scavenging of the CCN to concentrations of few cm−3, as proposed by Ackerman et al. (1993).
The role of aerosols in the regime transitions from closed to open cells and then to
10
a complete runaway rainout effect is evident in Figs. 3 and 4, where old ship tracks occur at the regime of closed Benard cells with small cloud drops extending into areas of open Benard cells in clouds having large effective droplet radii, and then continuing into the cloud-free areas.
The drier atmosphere above the MBL likely sharpens the bistability. Entrainment of
15
drier air from above the MBL reduces the cloud water and so suppresses drizzle and lowers the droplet concentration threshold below which heavy drizzle can occur and deplete the cloud water (Ackerman et al., 2004). Once the cloud cover is broken, drier air aloft will lead to stronger radiative cooling of the MBL by thermal emission from the water vapor and hence a faster reversal into open cellular convection. The clouds
20
are already drizzling quite heavily due to the lower concentrations of cloud droplets required for the transition from closed to open cells with drier air above the MBL. This will lead to a faster runaway super-clean state, which is maintained by the suppressed convection and hence minimal entrainment of CCN from the FT.
The mechanism proposed here dictates that the natural progression of events would
25
be from closed to open cells, unless heavy doses of aerosols are injected into the MBL, as occurs in the case of ship tracks. In agreement with this, Wood and Hartman (2006) stated that “qualitative examination of geostationary satellite imagery suggests that a
ACPD
6, 1179–1198, 2006Aerosols closing open Benard cells
D. Rosenfeld et al. Title Page Abstract Introduction Conclusions References Tables Figures J I J I Back Close
Full Screen / Esc
Print Version Interactive Discussion
EGU
often takes the form of small pockets of open cells forming over a few hours within regions of extensive closed cells, which then grow to become extensive areas of open mesoscale cellular convection.”
The simulation of the conversion from closed to open Benard cells remains yet an unsolved challenge. However, Mechem and Kogan (2003) were able to simulate the
5
transition between continuous layer clouds into a broken cloud field when allowing drizzle to form in their simulated clouds. In their model, the unbroken stratocumulus, driven energetically by strong cloud-top cooling and to a lesser extent, surface fluxes, is kept well mixed within the MBL, with thermodynamic quantities remaining nearly well mixed. In the drizzling experiment, on the other hand, drizzle evaporating in the
sub-10
cloud layer changes the character of the boundary layer sufficiently to allow a slight pooling of high static stability air just above the surface. The instability associated with this slight CAPE within the MBL is subsequently realized through resolved updrafts, which are associated with the strongest drizzle production. Compensating downdrafts seem to be able to trigger new upward vertical motion on their periphery, resulting in
15
the initiation of cumulus ensembles in adjacent regions. This transition occurs within 6 h in the model. The presence of drizzle is vital for this transition to occur.
The self maintenance nature of the open cells is evident upon tracking their time evolution. Figure 5 shows nearly one week long hourly evolution of the features of marine stratocumulus over the southeast Atlantic, using the multispectral capabilities
20
of the METOSAT-8 geostationary satellite.
4. Possible aerosol role of converting marine stratocumulus to trade wind cu-mulus
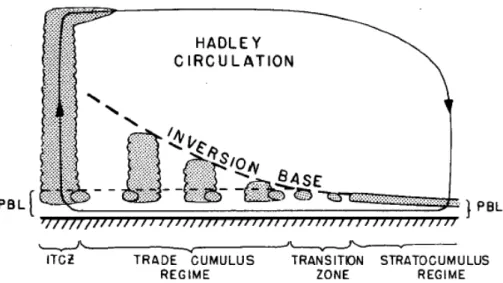
The precipitation induced regime change can explain the breaking of marine Sc into the trade winds Cu. The subtropical inversion gradually rises and the MBL thickens
25
westward and towards the ITCZ, and the layer clouds break at some point into the trade wind cumulus clouds (Fig. 6). This breaking can occur due to movement of the
ACPD
6, 1179–1198, 2006Aerosols closing open Benard cells
D. Rosenfeld et al. Title Page Abstract Introduction Conclusions References Tables Figures J I J I Back Close
Full Screen / Esc
Print Version Interactive Discussion
EGU
air mass over warmer waters and dominance of the low level warming of the MBL on the cloud top radiative cooling. It can also happen due to the greater tendency of the MBL clouds to increase their precipitation intensity as they grow deeper (Fig. 7). It is expected that at some point in the deepening the cloud drop coalescence would reach a point where the precipitation rate would be sufficient to cause the transition change
5
from closed to open convection, if it was not broken already due to other causes such as wind shear, warming of the sea surface temperature, or enhanced dry entrainment from above. However, such entrainment is not likely to break the layer clouds, as suggested by Gerber et al. (1996).
The further enhancement of the precipitation with the deepening of the convective
10
clouds as the MBL thickens towards the ITCZ is associated with further decreasing of the cloud fraction down to 0.3 at a MBL depth = 2000 m, and remains at that value of CF for greater depths (Fig. 18 of Wood and Hartmann, 2006). This is the height at which most of the small convective clouds over ocean start precipitating at intensities detectable by weather radar, i.e., >1 mm/h (Battan and Braham, 1956; Johnson et
15
al., 1999). Interestingly, this is the height at which clouds over the ocean would start raining even if they are polluted, due to the effect of sea spray aerosols that restore the precipitation processes in such clouds, as shown by Rosenfeld et al. (2002).
5. Discussion and summary
We have shown here that there are two basic states of the structure of the MBL, which
20
are manifestations of the dynamic response of the marine Sc to the aerosol induced effects on precipitation. These states have internal positive feedbacks for self mainte-nance and sharp differentiation into these two distinct states, as demonstrated by the sharp demarcation between the two regimes in the figures even where ship tracks are absent. The ship tracks serve to demonstrate the role of the dearth of aerosols in
main-25
taining the dynamic structure of the MBL mediated by the cloud-aerosol-precipitation processes. This situation provides a huge sensitivity to very small differences in aerosol
ACPD
6, 1179–1198, 2006Aerosols closing open Benard cells
D. Rosenfeld et al. Title Page Abstract Introduction Conclusions References Tables Figures J I J I Back Close
Full Screen / Esc
Print Version Interactive Discussion
EGU
amounts that can lead to a bifurcation of the state of the MBL and the respective cloud radiative forcing. The values in which the transition occur are within AOD<0.1, centered at the pristine background of AOD=∼0.06 (Smirnov et al., 2002).
This huge sensitivity provides a mechanism for large response of Earth global tem-perature to very small changes in the aerosols in the MBL. Such changes can be
an-5
thropogenic or oceanic biogenic such as due to fertilization of the ocean with nutrients that causes greater production of aerosols from the enhanced gaseous biogenic emis-sions (Wingenter et al., 2004). This great sensitivity opens the possibility that even the few CCN generated by cosmic rays might make a climatic significant difference in the cloud cover of the pristine MBL, and so modulate the global temperature as suggested
10
by Carlslaw et al. (2002).
Acknowledgements. The paper was partially supported by the Israeli Ministry of Science and
the Israeli Science Foundation.
References
Ackerman, A. S., Kirkpatrick, M. P., Stevense, D. A., and Toon, O. B.: The impact of humidity
15
above stratiform clouds on indirect aerosol climate forcing, Nature, 432, 1014–1017, 2004. Ackerman, A. S., Toon, O. B., and Hobbs, P. V.: Dissipation of marine stratiform clouds and
collapse of the marine boundary layer due to the depletion of cloud condensation nuclei by clouds, Science, 262, 226–229, 1993.
Ackerman, A. S., Toon, O. B., and Hobbs, P. V.: Reassessing the dependence of cloud
conden-20
sation nucleus concentration on formation rate, Nature, 367, 445–447, 1994.
Agee, E. M., Chen, T. S., and Dowell, K. E.: A review of mesoscale cellular convection, Bull. Amer. Meteorol. Soc., 54, 1004–1012, 1973.
Baker, M. B. and Charlson, R. J.: Bistability of CCN concentrations and thermodynamics in the cloud-topped boundary layer, Nature, 345, 142–145, 1990.
25
Battan, L. J. and Braham Jr., R. R.: A study of convective precipitation based on cloud and radar observations, J. Meteor., 13, 587–591, 1956.
ACPD
6, 1179–1198, 2006Aerosols closing open Benard cells
D. Rosenfeld et al. Title Page Abstract Introduction Conclusions References Tables Figures J I J I Back Close
Full Screen / Esc
Print Version Interactive Discussion
EGU
Carlslaw, K. S., Harrison, R. G., and Kirkby, J.: Cosmic rays, clouds, and climate, Science, 298, 1732–1737, 2002.
Coakley, J. A., Bernstein, R. L., and Durkee, P. A.: Effect of ship-stack effluents on cloud reflectivity, Science, 237, 1020–1022, 1987.
Coakley Jr., J. A. and Walsh, C. D.: Limits to the aerosol indirect radiative effect derived from
5
observations of ship tracks, J. Atmos. Sci., 59, 668–680, 2002.
Feingold, G. F., Stevens, B., Cotton, W. R., and Frish, A. S.: The relationship between drop in-cloud residence time and drizzle production in numerically simulated stratocumulus in-clouds, J. Atmos. Sci., 53, 1108–1122, 1996.
Gerber, H.: Microphysics of marine stratocumulus clouds with two drizzle modes, J. Atmos.
10
Sci., 53, 1649–1662, 1996.
Gunn, R. and Phillips, B. B.: An experimental investigation of the effect of air pollution on the initiation of rain, J. Meteorol., 14, 272–280, 1957.
Hegg, D. A.: Dependence of marine stratocumulus formation on aerosols, Geophys. Res. Lett., 26(10), 1429–1432, 1999.
15
Jiang, H., Feingold, G., and Cotton, W. R.: A modeling study of entrainment of cloud condensa-tion nuclei into the marine boundary layer during ASTEX, J. Geophys. Res., 107(D24), 4813, doi:10.1029/2001JD001502, 2002.
Johnson, R. H., Rickenbach, T. M., Rutledge, S. A., Ciesielski, P. E., and Schubert, W. H.: Trimodal characteristics of tropical convection, J. Clim., 12, 2397–2418, 1999.
20
Kaufman, Y. J., Koren, I., Remer, L. A., Rosenfeld, D., and Rudich, Y.: Smoke, Dust and Pollution Aerosol Clouding the Atlantic Atmosphere, Proceedings of the National Academy of Sciences, 102, 11 207–11 212, 2005.
Mechem, D. B. and Kogan, Y. L.: Simulating the transition from drizzling marine stratocumu-lus to boundary layer cumustratocumu-lus with a mesoscale model, Mon. Wea. Rev., 131, 2342–2360,
25
2003.
Paluch, I. R. and Lenschow, D. H.: Stratiform cloud fraction in the marine boundary layer, J. Atmos. Sci., 48, 2141–2158, 1991.
Pincus, R. and Baker, M. B.: Effect of precipitation on the albedo susceptibility of clouds in the marine boundary-layer, Nature, 372, 250–252, 1994.
30
Platnick, S. P., Durkee, A., Nielsen, K., Taylor, J. P., Tsay, S.-C., King, M. D., Ferek, R. J., Hobbs, P. V., and Rottman, J. W.: The role of background cloud microphysics in the radiative formation of ship tracks, J. Atmos. Sci., 57, 2607–2624, 2000.
ACPD
6, 1179–1198, 2006Aerosols closing open Benard cells
D. Rosenfeld et al. Title Page Abstract Introduction Conclusions References Tables Figures J I J I Back Close
Full Screen / Esc
Print Version Interactive Discussion
EGU
Randall, D. A.: Conditional instability of the first kind upside-down, J. Atmos. Sci., 37, 125–130, 1980a.
Randall, D. A.: Conditional Entrainment into a stratocumulus layer with distributed radiative cooling, J. Atmos. Sci., 37, 148–159, 1980b.
Rosenfeld, D., Lahav, R., Khain, A. P., and Pinsky, M.: The role of sea-spray in cleansing air
5
pollution over ocean via cloud processes, Science, 297, 1667–1670, 2002.
Sekiguchi, M., Nakajima, T., Suzuki, K., Kawamoto, K., Higurashi, A., Rosenfeld, D., Sano, I., and Mukai, S.: A study of the direct and indirect effects of aerosols using global satellite datasets of aerosol and cloud parameters, J. Geophys. Res., 108(D22), 4699, doi:10.1029/2002JD003359, 2003.
10
Smirnov, A., Holben, B. N., Kaufman, Y. J., Dubovik, O., Eck, T. F., Slutsker, I., Pietras, C., and Halthore, R. N.: Optical Properties of Atmospheric Aerosol in Maritime Environments, J. Atmos. Sci., 59, 501–523, 2002.
Stevens, B., Vali, G., Comstock, K., vanZanten, M. C., Austin, P. H., Bretherton, C. S., and Lenschow, D. H.: Pockets of Open Cells (POCs) and Drizzle in Marine Stratocumulus, Bull.
15
Amer. Meteorol. Soc., 86, 51–57, 2005.
Twomey, S.: The influence of pollution on the shortwave albedo of clouds, J. Atmos. Sci., 34, 1149–1154, 1977.
Wingenter, O. W., Haase, K. B., Strutton, P., Friederich, G., Meinardi, S., Blake, D. R., and Rowland, F. S.: Changing concentrations of CO, CH4, C5H8, CH3Br, CH3I, and dimethyl
20
sulfide during the Southern Ocean Iron Enrichment Experiments, PNAS, 101(23), 8537– 8541, 2004.
Wood, R. and Hartmann, D. L.: Spatial variability of liquid water path in marine low cloud: The importance of mesoscale cellular convection, J. Clim., in press, 2006.
VanZanten, M. C., Stevens, B., Vali, G., and Lenschow, D. H.: Observations in nocturnal marine
25
ACPD
6, 1179–1198, 2006Aerosols closing open Benard cells
D. Rosenfeld et al. Title Page Abstract Introduction Conclusions References Tables Figures J I J I Back Close
Full Screen / Esc
Print Version Interactive Discussion EGU FIGURES 0 0.1 0.2 0.3 0.4 0.5 0.01 0.1 cloud f ract ion AOT 910-1000mb COD 3 Dust zone 5°-30°N 10 15 20 25 low ∆T (1000-750mb)
high ∆T (1000-750mb) ReffReff
Ref f 910-1000mb COD 3 Smoke zone 20°S-5°N 0 0.1 0.2 0.3 0.4 0.5 0.6 low ∆T (1000-750mb) high ∆T (1000-750mb) Reff Reff cloud f ract ion 910-1000mb COD 3 Marine zone 30°-20°S 10 15 20 0.01 0.1 Ref f AOT 910-1000mb COD 3 Pollution zone 30°-60°N
Figure 1: Cloud cover fraction (CF, solid lines) and drop effective radius (DER, broken lines) of shallow clouds as a function of aerosol optical depth (AOD) for 4 zones over the Atlantic Ocean during August 2002, as defined by Kaufman et al. (2005). The clouds were separated based on stability. Greater stability, which is indicated by smaller ∆T(1000-750mb), promotes greater shallow cloud cover. Greater instability also produces shallower clouds with smaller DER for the same AOD. Remarkably, the CF increases with AOD as much as with instability. Note that the DER increases and the CF decreases as the AOD decreases, most clearly in the pristine subtropical latitudes of the south Atlantic, supporting the runaway rainout effect of clouds and aerosols.
Fig. 1. Cloud cover fraction (CF, blue lines with circles) and drop effective radius (DER, denoted
as Reff, red lines with rhombs) of shallow clouds as a function of aerosol optical depth (AOD) for 4 zones over the Atlantic Ocean during August 2002, as defined by Kaufman et al. (2005). The clouds were separated based on stability. Greater stability, which is indicated by smaller∆T (1000–750 mb) and denoted by the broken lines, promotes greater shallow cloud cover. Greater stability also produces shallower clouds with smaller DER for the same AOD. Remarkably, the CF increases with AOD as much as with instability. Note that the DER increases and the CF decreases as the AOD decreases, most clearly in the pristine subtropical latitudes of the south Atlantic, supporting the runaway rainout effect of clouds and aerosols.
ACPD
6, 1179–1198, 2006Aerosols closing open Benard cells
D. Rosenfeld et al. Title Page Abstract Introduction Conclusions References Tables Figures J I J I Back Close
Full Screen / Esc
Print Version Interactive Discussion EGU Closed Benard Cells Open Benard Cells Collapsed Boundary Layer Transition
A
B
C
D
E
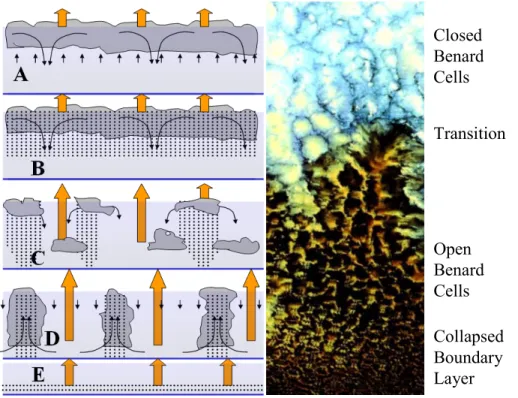
Figure 2: A schematic illustration of the transition from non precipitating closed Benard cells to precipitating open cells and onward to nearly complete rainout and elimination of the clouds. In the closed Benard cells (A) the convection is propelled by radiative cooling from the tops of the extensive deck of clouds with small drops. The onset of drizzle breaks the cloud cover (B, C). The propulsion of the convection undergoes transition from radiative cooling at the top of the fully cloudy MBL (orange arrows in B) to surface heating at the bottom of the partly cloudy MBL (orange arrows at D) causes a reversal of the convection from closed to open Benard cells (D). The process can continue to a runaway effect of cleansing by the CCN and direct condensation into drizzle that directly precipitates and prevents the cloud formation altogether (E). The satellite strip is a 300 km long excerpt from the box in Figure 3.
Fig. 2. A schematic illustration of the transition from non precipitating closed Benard cells to
precipitating open cells and onward to nearly complete rainout and elimination of the clouds. In the closed Benard cells(A) the convection is propelled by radiative cooling from the tops of
the extensive deck of clouds with small drops. The onset of drizzle breaks the cloud cover(B, C). The propulsion of the convection undergoes transition from radiative cooling at the top of
the fully cloudy MBL (orange arrows in B) to surface heating at the bottom of the partly cloudy MBL (orange arrows atD) causes a reversal of the convection from closed to open Benard
cells (D). The process can continue to a runaway effect of cleansing by the CCN and direct condensation into drizzle that directly precipitates and prevents the cloud formation altogether
(E). The satellite strip is a 300 km long excerpt from the box in Fig. 3.
ACPD
6, 1179–1198, 2006Aerosols closing open Benard cells
D. Rosenfeld et al. Title Page Abstract Introduction Conclusions References Tables Figures J I J I Back Close
Full Screen / Esc
Print Version Interactive Discussion
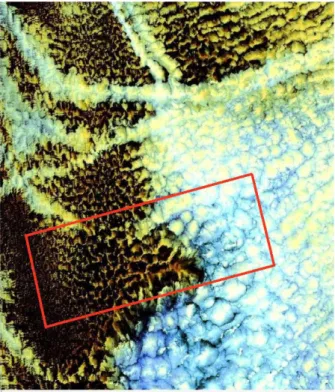
EGU Figure 3: MODIS image of the relation between microstructure and dynamics of marine
stratocumulus in an area of about 400x400 km to the west of the coast of California on 26 June
2003 19:40 UT. The MODIS image is of 500 m resolution, with color composite of red, green
and blue modulating 469, 1640 and 2130 nm channels, respectively, with Gamma enhancement of 0.2. In this color combination small drops appear bluish, and become red when they become larger. Note the transition from closed to open Benard cells with the increase of drop size, as indicated by changing cloud color to orange and red. The box delimits the area shown in Figure 2. The drops in ship tracks remain small, and reside in the regime of closed cells. It is clearly seen that the clouds with small drops are brighter and with much greater fractional area coverage than the clouds composed of the larger drops.
Fig. 3. MODIS image of the relation between microstructure and dynamics of marine
stratocu-mulus in an area of about 400×400 km to the west of the coast of California on 26 June 2003 19:40 UT. The MODIS image is of 500 m resolution, with color composite of red, green and blue modulating 469, 1640 and 2130 nm channels, respectively, with Gamma enhancement of 0.2. In this color combination small drops appear bluish, and become red when they become larger. Note the transition from closed to open Benard cells with the increase of drop size, as indicated by changing cloud color to orange and red. The box delimits the area shown in Fig. 2. The drops in ship tracks remain small, and reside in the regime of closed cells. It is clearly seen that the clouds with small drops are brighter and with much greater fractional area coverage than the clouds composed of the larger drops.
ACPD
6, 1179–1198, 2006Aerosols closing open Benard cells
D. Rosenfeld et al. Title Page Abstract Introduction Conclusions References Tables Figures J I J I Back Close
Full Screen / Esc
Print Version Interactive Discussion
EGU
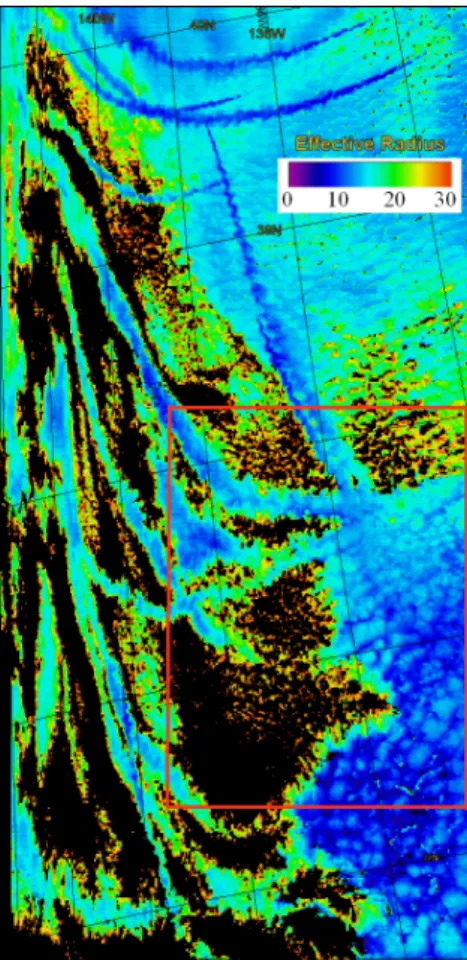
Figure 4: Same MODIS image as in Figure 3, but for the MODIS product of effective radius at 1-km resolution over a larger domain. The area of Figure 3 is bounded by the center right rectangle. Note that the transition from small to large re occurs between the solid and broken clouds. Note that ship tracks are maintained in the cloud free areas where runaway rainout and cleansing of the CCN probably occurred.
Fig. 4. Same MODIS image as in Fig. 3, but for the MODIS product of effective radius at 1-km
resolution over a larger domain. The area of Fig. 3 is bounded by the center right rectangle. Note that the transition from small to large cloud drop effective radius occurs between the solid and broken clouds. Note that ship tracks are maintained in the cloud free areas where runaway rainout and cleansing of the CCN probably occurred.
ACPD
6, 1179–1198, 2006Aerosols closing open Benard cells
D. Rosenfeld et al. Title Page Abstract Introduction Conclusions References Tables Figures J I J I Back Close
Full Screen / Esc
Print Version Interactive Discussion
EGU
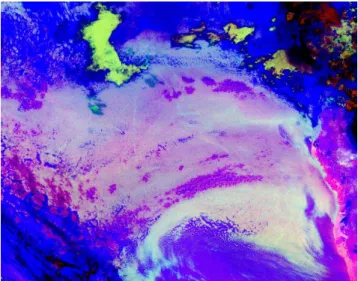
Figure 5: Pockets of open cells (purple areas) in a deck of marine stratocumulus in the southeast Atlantic, as seen by the geostationary satellite METEOSAT-8, on 27 Nov 2005, 04:00 UT. The image is at the satellite projection and covers ~ 4S-32S and 18W-18E. Namibia coast is seen at the lower right. A six-day and night animation of such hourly images is available here, for 24 Nov 04:00 – 30 Nov 00:00. The images are Red Green Blue composites where during night-time the red is modulated by 12.0 -10.8 μm brightness temperature (BT) difference, Green is 10.8 - 3.9 μm BT difference, and blue is 10.8 μm BT. During daytime Red is visible reflectance, green is 3.9 μm solar reflectance, and blue is 10.8 μm BT. Certain features of open cells can be tracked for four days, where the self maintained dynamics and their interactions with the ship tracks are evident. The self maintenance of the open cells is further evident by the observation that the marine stratus undergoes considerable diurnal change of maximum cover during early morning and minimal cover late in the day, while the structure the open appears to respond much less to the diurnal cycle. The transitions between day and night are evident by the poor quality of the dusk images. The open cells eventually disappear upon confluence with what appears to be polluted north hemispheric air, as evident by the bright color of these clouds which reflects their small droplet size.
Fig. 5. Pockets of open cells (purple areas) in a deck of marine stratocumulus in the southeast
Atlantic, as seen by the geostationary satellite METEOSAT-8, on 27 November 2005, 04:00 UT. The image is at the satellite projection and covers ∼4◦S–32◦S and 18◦W–18◦E. Namibia coast is seen at the lower right. A six-day and night animation of such hourly images is available here, for 24 November 04:00–30 November 00:00 (http://www.atmos-chem-phys.org/acpd/6/ 1179/acpd-6-1179-sp.zip). The images are Red Green Blue composites where during night-time the red is modulated by 12.0–10.8 µm brightness temperature (BT) difference, Green is 10.8–3.9 µm BT difference, and blue is 10.8 µm BT. During daytime Red is visible reflectance, green is 3.9 µm solar reflectance, and blue is 10.8 µm BT. Certain features of open cells can be tracked for four days, where the self maintained dynamics and their interactions with the ship tracks are evident. The self maintenance of the open cells is further evident by the observation that the marine stratus undergoes considerable diurnal change of maximum cover during early morning and minimal cover late in the day, while the structure of the open cells appears to respond much less to the diurnal cycle. The transitions between day and night are evident by the poor quality of the dusk images. The open cells eventually disappear upon confluence with what appears to be polluted north hemispheric air, as evident by the bright color of these clouds which reflects their small droplet size.
ACPD
6, 1179–1198, 2006Aerosols closing open Benard cells
D. Rosenfeld et al. Title Page Abstract Introduction Conclusions References Tables Figures J I J I Back Close
Full Screen / Esc
Print Version Interactive Discussion
EGU Figure 5: Transition to trade Cu: The breaking of marine stratocumulus into the trade wind
cumulus with the deepening of the MBL (from Randall, 1980a): Does it occur when the clouds become sufficiently deep for precipiitation? If so, aerosols would affect the transition front.
Fig. 6. Transition to trade Cu: The breaking of marine stratocumulus into the trade wind
cu-mulus with the deepening of the MBL (from Randall, 1980a): Does it occur when the clouds become sufficiently deep for precipitation? If so, aerosols would affect the transition front.
ACPD
6, 1179–1198, 2006Aerosols closing open Benard cells
D. Rosenfeld et al. Title Page Abstract Introduction Conclusions References Tables Figures J I J I Back Close
Full Screen / Esc
Print Version Interactive Discussion EGU 0 100 200 300 400 500 600 10 100
Cl
ou
d t
h
ickn
e
ss
[m
]
Cloud drop concentration [cm
-3]
0.05 0.04 1.6 0.18 0.76 1.9 0.38
Heavy
Drizzle
Light
Drizzle
No Drizzle
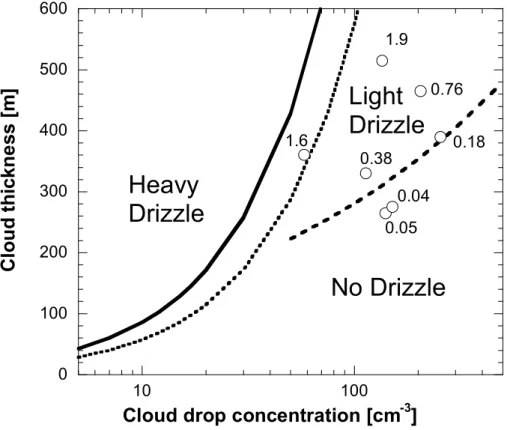
Figure 6: Partition of the drop number concentration and cloud thickness parameter space for separating heavy drizzling marine stratocumulus where most water resides in the drizzle drops, lightly drizzling were most water resides in the cloud drops, and non drizzling clouds. The thick
line occurs at cloud drop effective radius re =16 µm, which was calculated after Gerber (1996) to
be the minimal size for the heavy drizzle regime. The dotted line shows the location of re =14 µm.
The separator between no drizzle and light drizzle of R > 0.2 mm day-1 is provided by the broken
line based on DYCOMS-II observations (vanZanten et al., 2005). The individual points and their R values are posted (from Table 3 of vanZanten et al., 2005).
Fig. 7. Partition of the drop number concentration and cloud thickness parameter space for
separating heavy drizzling marine stratocumulus where most water resides in the drizzle drops, lightly drizzling were most water resides in the cloud drops, and non drizzling clouds. The thick line occurs at cloud drop effective radius re=16 µm, which was calculated after Gerber (1996)
to be the minimal size for the heavy drizzle regime. The dotted line shows the location of re=14 µm. The separator between no drizzle and light drizzle of R>0.2 mm day
−1
is provided by the broken line based on DYCOMS-II observations (vanZanten et al., 2005). The individual points and their R values are posted (from Table 3 of vanZanten et al., 2005).