HAL Id: inserm-00843193
https://www.hal.inserm.fr/inserm-00843193
Submitted on 10 Jul 2013
HAL is a multi-disciplinary open access
archive for the deposit and dissemination of
sci-entific research documents, whether they are
pub-lished or not. The documents may come from
teaching and research institutions in France or
abroad, or from public or private research centers.
L’archive ouverte pluridisciplinaire HAL, est
destinée au dépôt et à la diffusion de documents
scientifiques de niveau recherche, publiés ou non,
émanant des établissements d’enseignement et de
recherche français ou étrangers, des laboratoires
publics ou privés.
2011
Matthias Zingg, Christoph Rüst, Romuald Lepers, Thomas Rosemann, Beat
Knechtle
To cite this version:
Matthias Zingg, Christoph Rüst, Romuald Lepers, Thomas Rosemann, Beat Knechtle. Master runners
dominate 24-h ultramarathons worldwide–a retrospective data analysis from 1998 to 2011. Extreme
Physiology & Medicine, 2013, 2 (1), pp.21. �inserm-00843193�
R E S E A R C H
Open Access
Master runners dominate 24-h ultramarathons
worldwide—a retrospective data analysis from
1998 to 2011
Matthias Zingg
1, Christoph Alexander Rüst
1, Romuald Lepers
3, Thomas Rosemann
1and Beat Knechtle
1,2*Abstract
Background: The aims of the present study were to examine (a) participation and performance trends and (b) the age of peak running performance in master athletes competing in 24-h ultra-marathons held worldwide between 1998 and 2011.
Methods: Changes in both running speed and the age of peak running speed in 24-h master ultra-marathoners (39,664 finishers, including 8,013 women and 31,651 men) were analyzed.
Results: The number of 24-h ultra-marathoners increased for both women and men across years (P < 0.01). The age of the annual fastest woman decreased from 48 years in 1998 to 35 years in 2011. The age of peaking running speed remained unchanged across time at 42.5 ± 5.2 years for the annual fastest men (P > 0.05). The age of the annual top ten women decreased from 42.6 ± 5.9 years (1998) to 40.1 ± 7.0 years (2011) (P < 0.01). For the annual top ten men, the age of peak running speed remained unchanged at 42 ± 2 years (P > 0.05). Running speed remained unchanged over time at 11.4 ± 0.4 km h−1for the annual fastest men and 10.0 ± 0.2 km/h for the annual
fastest women, respectively (P > 0.05). For the annual ten fastest women, running speed increased over time by 3.2% from 9.3 ± 0.3 to 9.6 ± 0.3 km/h (P < 0.01). Running speed of the annual top ten men remained unchanged at 10.8 ± 0.3 km/h (P > 0.05). Women in age groups 25–29 (r2= 0.61, P < 0.01), 30–34 (r2= 0.48, P < 0.01), 35–39 (r2= 0.42, P = 0.01), 40–44 (r2= 0.46, P < 0.01), 55–59 (r2= 0.41, P = 0.03), and 60–64 (r2= 0.57, P < 0.01) improved running speed; while women in age groups 45–49 and 50–54 maintained running speed (P > 0.05). Men improved running speed in age groups 25–29 (r2= 0.48, P = 0.02), 45–49 (r2= 0.34, P = 0.03), 50–54 (r2= 0.50, P < 0.01), 55–59 (r2= 0.70, P < 0.01), and 60–64 (r2= 0.44, P = 0.03); while runners in age groups 30–34, 35–39, and 40–44 maintained running speed (P > 0.05).
Conclusions: Female and male age group runners improved running speed. Runners aged >40 years achieved the fastest running speeds. By definition, runners aged >35 are master runners. The definition of master runners aged >35 years needs to be questioned for ultra-marathoners competing in 24-h ultra-marathons.
Keywords: Age of peak performance, Running speed, Gender difference
* Correspondence:beat.knechtle@hispeed.ch
1Institute of General Practice and for Health Services Research, University of
Zurich, Zurich, Switzerland
2Gesundheitszentrum St. Gallen, Vadianstrasse 26, St. Gallen 9001, Switzerland
Full list of author information is available at the end of the article
© 2013 Zingg et al.; licensee BioMed Central Ltd. This is an Open Access article distributed under the terms of the Creative Commons Attribution License (http://creativecommons.org/licenses/by/2.0), which permits unrestricted use, distribution, and reproduction in any medium, provided the original work is properly cited.
Background
In running, a master athlete is defined as an athlete typ-ically older than 35 years of age and systemattyp-ically train-ing for, and compettrain-ing in, organized forms of sport specifically designed for older adults [1]. Master runners participate in endurance events all around the world [2-5] and accomplish top results up to approximately 50 years of age [2,4,5]. Especially in ultra-endurance events, where a variety of anthropometric [1,6,7], psychological [8], and environmental factors such as heat [9,10] may affect running performance, master runners have the chance to reach top rankings [11,12] and compensate age-related deficits such as the decrease in cardiovascu-lar capacity [13].
The popularity of endurance and ultra-endurance run-ning events such as the ‘New York City Marathon’ [2] or the ‘Western States 100-Mile Endurance Run’ [14] in-creased over the past years. Even if the annual number of athletes worldwide is by far smaller in ultra-marathons [15] than in marathons [16], thousands of runners com-plete each year marathons such as 24-hour ultra-marathons [17]. The increase in the number of athletes in both marathons [2,18] and ultra-marathons [11,19] is mainly due to an increase in the number of master run-ners and women [2,11,18,19]. An age-related decline in endurance performance has been shown for different run-ning distances such as the marathon distance [18] and other types of running competitions [20-22] such as the 10-km run. Running speed in elite master runners showed a curvilinear decrease from the age of approximately 35 years until the age of approximately 60–70 years with an exponential decrease thereafter [23-25]. Peak running speed appeared to be maintained until the age of approxi-mately 35 years [26,27].
However, in addition to the age-related performance decline, the age of peak endurance performance might also be of higher interest for athletes. The age of peak running speed was investigated in different running dis-tances and in types of competitions such as marathons [28,29] and ultra-marathons [11,19]. For both women and men, the age of peak marathon performance has been reported to be at around 30 years [28], while in ultra-marathon events there seemed to be an increase in the age of peak performance across years into higher ages. For example, Eichenberger et al. [11] found in a 78-km mountain ultra-marathon, the ‘Swiss Alpine Marathon’ in Switzerland, an increase in the age of the annual top ten finishers from 33 years in 1998 to 37 years in 2011. Knechtle et al. [19] reported that the fastest 100-km running times were performed by men aged between 30 and 49 years and women aged between 30 and 54 years. Hoffman and Wegelin [14] showed that the fastest running times in a 161-km ultra-marathon were achieved by athletes aged between 35 and 40 years.
Running speed beyond the age of 55 years seemed to de-crease in both genders in studies investigating peak run-ning performance for races with determined distances [13,29], but not for races with a time limit such as a 24-h ultra-marathon. To the best of our knowledge, no study investigated the age of peak running performance in 24-h ultra-marathons.
There might be differences in both the age-related formance decline and the age of peak endurance per-formance between women and men due to gender differences in performance. For running, the gender dif-ferences have been investigated for elite [28,30,31] and recreational runners [11,12]. Medic et al. [32] reported gender differences in performance in different sports such as swimming and track or field running and found them to be quite constant. Lepers and Cattagni [2] showed a relative stability of gender differences in mara-thon running times across the different age groups for the last decade in the New York City Marathon from 1980–2009 of about 11%. Cheuvront et al. [33] reported a gender difference of 8%–14% for running distances from 1,500 m to 42 km whereas the gender difference in running speed was approximately 11% in other competi-tions such as marathons [28,34]. A few studies investi-gated the gender difference in ultra-marathons [11,19] since it was hypothesized that women could outrun men in ultra-marathon distances or in a variety of other types of competitions [35,36].
Most studies investigated both the age-related decline in performance and the age of peak performance for a single race or a race series held within a country [2,4,5,11,14,19]. However, no study investigated the asso-ciation of age and performance for an ultra-marathon race series held worldwide. The aims of the present study were to examine, first, the worldwide participation and performance trends of 24-h ultra-marathoners from 1998 to 2011, and second, to determine the age of peak running performance of these ultra-endurance runners. We hypothesized, first, that the participation would in-crease and the performance of master runners would improve over the 14-year period and, second, the age of peak 24-h running performance would be at around 40 years for both women and men with an increase in the age of peak performance across years.
Methods
The present study was approved by the Institutional Re-view Board of St. Gallen, Switzerland, with a waiver of the requirement for informed consent given that the study involved the analysis of publicly available data. Performance and age of all men and women who ever participated in a 24-h ultra-marathon held worldwide between 1998 and 2011 were analyzed. The data set for this study was obtained from the race website
www.ultra-marathon.org [17]. This data base collects all race results in ultra-marathon races held worldwide. Data before 1998 were not complete and were there-fore seemed not reliable for data analysis.
Data analysis
In order to facilitate reading and increase the compar-ability with similar analysis of races from different dis-tances, race distances (km) were transformed to running speed (km/h) prior to analysis. Running speed (km/h) was calculated using the equation (running speed in km/ h = race distance achieved in km)/24 h. To get the re-sults as exact as possible, converting and further calcula-tions were performed and are corrected to ten decimal places. To analyze the performance achieved in age groups, all athletes were divided into five-year age groups up to the age of 94 years prior to the analysis, starting with age group 18–24 years. To calculate the performance ratio and the gender difference, the annual top ten (e.g., annual ten fastest running speeds) women and men were determined from each age group, where all age groups were considered, providing at least ten athletes in both genders in more than ten out of the 14 analyzed years. The age groups 18–24 years and all age groups above 60–64 years had to be excluded from these analyses due to an insufficient number of athletes. Add-itionally, in the age group 25–29 years the results of the years 1998, 1999, and 2001, in the age group 55–59 years the results of the years 1998 and 1999, and in the age group 60–64 years the results of the years 1998, 1999, and 2002 had to be excluded from data analysis due to an insufficient number of athletes. Afterwards, the performance ratio for both genders and the gender difference in performance were calculated for each age group and year and analyzed regarding its change over time. Performance ratio was calculated using the equa-tion (running speed of the top ten athletes in an age group / running speed of the overall top ten athletes) × 100. The performance ratio expresses the performance of the top ten athletes of an age group as a percentage of the performance of the overall top ten athletes. In order to compare the top ten athletes of an age group with the overall top ten athletes, the annual ten fastest times of each gender were collected. In order to deter-mine the percentage of master athletes in the annual top ten, the top ten ranks from each year and both genders were collected. For the 14 years, 14 × ten top ten ranks were gathered for both genders, i.e., 140 top ten ranks for each gender. The gender difference in performance was calculated using the equation (running speed in women – running speed in men) / (running speed in men) × 100, where the gender difference was calculated for every couple of equally ranked athletes (e.g., between female and male winners, between women and men
second place, etc.) before calculating mean value and standard deviation of all the pairings. In order to facili-tate reading, all gender differences were transformed to absolute values prior to analyses. To analyze the age-related decline in running performance, the overall top ten women and men of all age groups comprised be-tween 18–24 years and 75–79 years were determined and analyzed in the age period where the fastest per-formance was achieved.
Statistical analysis
In order to increase the reliability of the data analyses, each set of data was tested for normal distribution and for homogeneity of variances prior to statistical analyses. Normal distribution was tested using a D'Agostino and Pearson omnibus normality test, and homogeneity of variances was tested using a Levene's. To find significant changes of a variable across years, linear regression was used. To find significant differences between multiple groups, a one-way analysis of variance (ANOVA) with sub-sequent Tukey-Kramer post-hoc analysis was performed. To determine the interaction between age and gender on running speed, a two-way ANOVA (age groups × gender) was used. Statistical analyses were performed using IBM SPSS Statistics (Version 19, IBM SPSS, Chicago, IL, USA) and GraphPad Prism (Version 5, GraphPad Software, La Jolla, CA, USA). Significance was accepted at P < 0.05 (two-sided for t tests). Data in the text are given as mean ± standard deviation (SD).
Results
Data were available from 43,551 ultra-marathoners, in-cluding 8,767 women and 34,784 men. A total of 751 women and 3,125 men had to be excluded from data analysis due to missing information about age and eight more men and three women due to missing information about performance. Finally, data from 39,664 ultra-marathoners, including 8,013 women (20.2%) and 31,651 men (79.8%), could be included into data analysis.
Participation trends
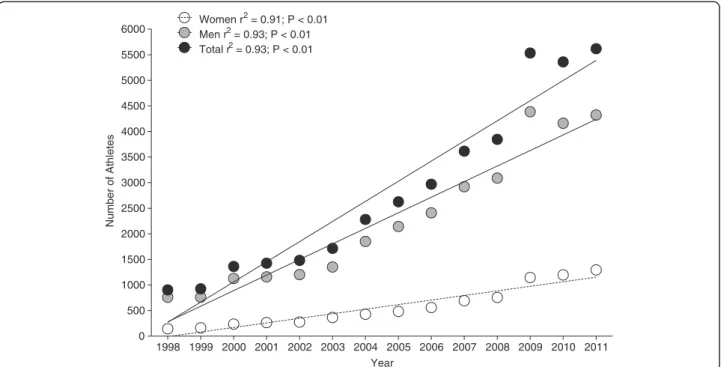
The numbers of finishers increased for both women and men over the 14-year period (Figure 1). The largest age group was athletes in the age group 45–49 years for both women and men (Figure 2). Among the 39,664 athletes, 86.0% were older than 35 years. Master runners aged >35 years achieved 120 (85.7%) of the 140 annuals top ten results in men and 129 (92.1%) of the 140 annuals top ten results in women. Master athletes from both genders achieved 27 out of the 28 fastest annual running speeds in 14 years. Women accounted on average for 20.2% of the field. The percentage of female participa-tion increased from 16.0% in 1998 to 23.1% in 2011.
Performance of the fastest 24-h runners
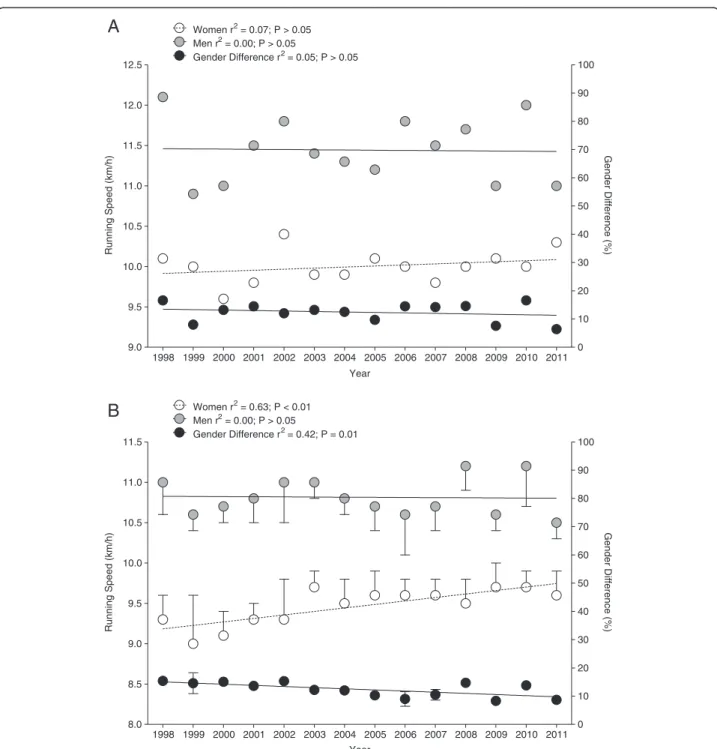
Running speed for the annual fastest 24-h ultra-marathoners remained unchanged across years in both women and men (Figure 3A). Mean running speed
was 11.4 ± 0.4 km h−1 for the annual fastest men and
10.0 ± 0.2 km h−1 for the annual fastest women. The
corresponding gender difference remained unchanged at
12.4% ± 3.3%. For the annual ten fastest female ultra-marathoners, running speed increased by 3.2% over the years (Figure 3B). In 1998 running speed for the annual
top ten women was 9.3 ± 0.3 km h−1, and it increased
to 9.6 ± 0.3 km h−1in 2011. Running speed of the
an-nual top ten men remained unchanged across years at
10.8 ± 0.3 km h−1(P > 0.05). The difference in running
1998 1999 2000 2001 2002 2003 2004 2005 2006 2007 2008 2009 2010 2011 0 500 1000 1500 2000 2500 3000 3500 4000 4500 5000 5500 6000 Women r 2 = 0.91; P < 0.01 Men r2 = 0.93; P < 0.01 Total r2 = 0.93; P < 0.01 Year Number of Athletes
Figure 1Changes in number of female and male athletes in 24-h ultra-marathons held worldwide from 1998 to 2011.
18-24 25-29 30-34 35-39 40-44 45-49 50-54 55-59 60-64 65-69 70-74 75-79 80-84 85-89 90-94 0 500 1000 1500 2000 2500 3000 3500 4000 4500 5000 5500 6000 6500 WomenMen
Age Groups (Years)
Number of Athletes
speed between the annual top ten women and the an-nual top ten men decreased from 15.4% ± 0.5% (1998) to 8.7% ± 1% (2011).
Age of the fastest 24-h runners
The age of peak running speed for the annual fastest 24-h ultra-marathoners was stable over the 14 years for men (P > 0.05), while it decreased for women (Figure 4A). The age of the annual fastest woman decreased from 48
years (1998) to 35 years (2011). The age of the annual fastest men (42.5 ± 5.2 years) showed no change over the 14 years (P > 0.05). For the annual top ten women and men, the age of peak running speed was unchanged for men (P > 0.05), while it decreased for women (Figure 4B). The age of the annual top ten women runners decreased from 42.6 ± 5.9 years (1998) to 40.1 ± 7.0 years (2011). The age of peak running speed of the annual top ten men remained unchanged at 42 ± 2 years (P > 0.05).
1998 1999 2000 2001 2002 2003 2004 2005 2006 2007 2008 2009 2010 2011 9.0 9.5 10.0 10.5 11.0 11.5 12.0 12.5 0 10 20 30 40 50 60 70 80 90 100 Women r2 = 0.07; P > 0.05 Men r2 = 0.00; P > 0.05 Gender Difference r2= 0.05; P > 0.05
A
Year Running Speed (km/h) Gender Difference (%) 1998 1999 2000 2001 2002 2003 2004 2005 2006 2007 2008 2009 2010 2011 8.0 8.5 9.0 9.5 10.0 10.5 11.0 11.5 0 10 20 30 40 50 60 70 80 90 100 Women r2 = 0.63; P < 0.01 Men r2 = 0.00; P > 0.05 Gender Difference r2= 0.42; P = 0.01B
Year Running Speed (km/h) Gender Difference (%)Figure 3Change in running speed in 24-hour ultra-marathons worldwide from 1998 to 2011. (A) The annual fastest ultra-marathoners. (B) The annual ten fastest ultra-marathoners.
Age-related change in performance
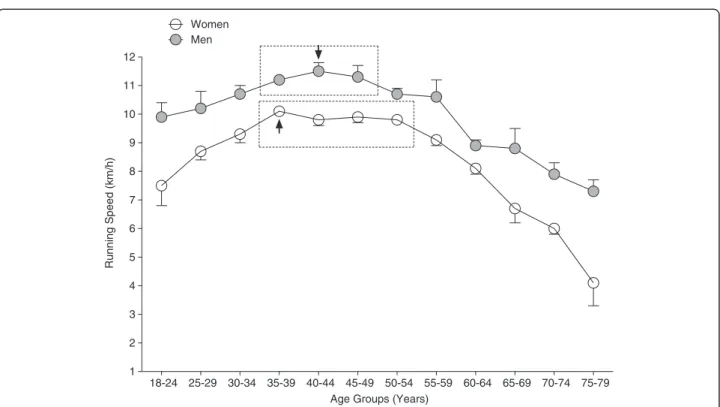
The age-related changes in performance over time are shown in Figure 5. Running speed decreased in a curvi-linear manner with advancing age. There was a signifi-cant (P < 0.0001) age effect for both women (F = 234.4) and men (F = 103.8). No significant difference in running
speed was observed for the three age groups between 35–39 and 45–49 years for men and the four age groups between 35–39 and 50–54 years for women (P > 0.05). In men, running speed was significantly (P < 0.0001) lower for the age groups 30–34 years and younger and 50–54 years and older compared with the age groups
1998 1999 2000 2001 2002 2003 2004 2005 2006 2007 2008 2009 2010 2011 20 25 30 35 40 45 50 55 Women r 2 = 0.36; P = 0.02 Men r2 = 0.04; P > 0.05
A
YearAge of peak running speed (years)
1998 1999 2000 2001 2002 2003 2004 2005 2006 2007 2008 2009 2010 2011 20 25 30 35 40 45 50 55 Women r 2 = 0.41; P = 0.01 Men r2 = 0.17; P > 0.05
B
YearAge of peak running speed (years)
Figure 4Age of the fastest 24-h runners. Change in the age of the annual fastest 24-hour ultra-marathoners (A) and the annual ten fastest 24-hour ultra-marathoners (B) from 1998 to 2011.
between 35–39 and 45–49 years. In women, running speed was significantly (P < 0.0001) lower for athletes in age groups 30–34 years and younger and 55–59 years and older compared with athletes in age groups between 35–39 and 50–54 years. Interaction analysis showed a significant age effect on running speed for both women
and men (F = 13.64, P < 0.0001) where age accounted for 71.5% of the variance (F = 310.5, P < 0.0001) and gender for 20.8% (F = 992.5, P < 0.0001).
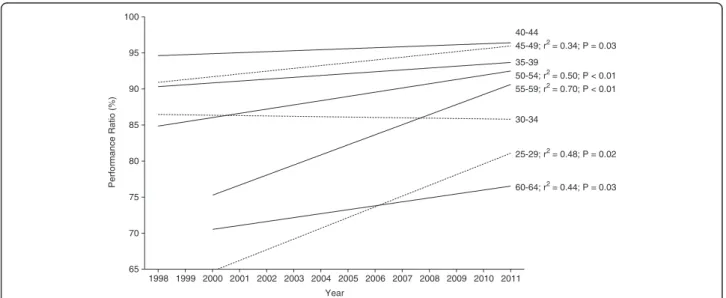
Figure 6 shows the trends in performance ratio across years for the annual top ten runners subdivided into differ-ent age groups for women. Women in age groups 25–29
18-24 25-29 30-34 35-39 40-44 45-49 50-54 55-59 60-64 65-69 70-74 75-79 1 2 3 4 5 6 7 8 9 10 11 12 Women Men
Age Groups (Years)
Running Speed (km/h)
Figure 5Age-related change in 24-h ultra-marathon running speed of the overall top ten women and overall top ten men per age group (pooled data from 1998 to 2011). An arrow indicates the age group with the fastest running speed. A dotted line indicates age groups which were not significantly different from the fastest one.
1998 1999 2000 2001 2002 2003 2004 2005 2006 2007 2008 2009 2010 2011 35 40 45 50 55 60 65 70 75 80 85 90 95 100 40-44; r2 = 0.46; P < 0.01 35-39; r2= 0.42; P = 0.01 45-49 50-54 30-34; r2= 0.48; P < 0.01 55-59; r2= 0.41; P = 0.03 25-29; r2= 0.61; P < 0.01 60-64; r2= 0.57; P < 0.01 Year Performance Ratio (%)
Figure 6Change in performance ratio for the different age groups for women from 1998 to 2011. Performance ratio is expressed as percentage of the performance of the overall top ten athletes in the respective year. r2and P values are inserted in case of a significant change
years (r2 = 0.61, P < 0.01), 30–34 years (r2 = 0.48,
P < 0.01), 35–39 years (r2 = 0.42, P = 0.01), 40–44
years (r2 = 0.46, P < 0.01), 55–59 years (r2 = 0.41,
P = 0.03) and 60–64 years (r2 = 0.57, P < 0.01)
im-proved running speed over the 1998–2011 period, while women in age groups 45–49 years and 50–54 years maintained their running speed. The age group with the annual ten fastest women was the 40–44 years with an average of 92.7% ± 3.6% of the run-ning speed of the overall top ten women. There was no decrease in the performance ratio.
Figure 7 presents the trends in performance ratio across years for the annual top ten male runners subdivided into different age groups. Men improved
running speed in age groups 25–29 years (r2 = 0.48,
P = 0.02), 45–49 years (r2= 0.34, P = 0.03), 50–54 years
(r2= 0.50, P < 0.01), 55–59 years (r2= 0.70, P < 0.01), and
60–64 years (r2 = 0.44, P = 0.03); while runners in age
groups 30–34, 35–39, and 40–44 years maintained run-ning speed. The fastest average runrun-ning speed was accom-plished by the top ten men in the age group 35–39 years with 96.1% ± 1.9% of the running speed of the overall top ten men. Also for men, there was no decrease in the per-formance ratio.
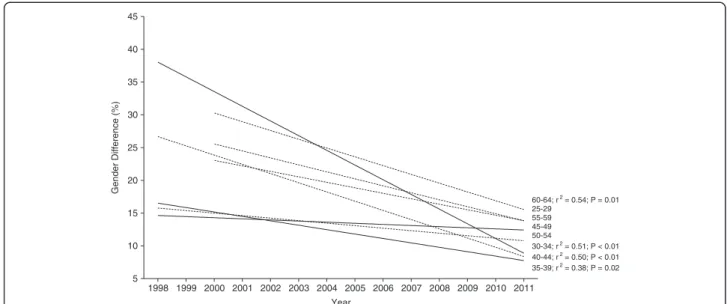
Figure 8 presents the difference in time between the first and the tenth place for the annual top ten female and male runners. The gender difference in running speed decreased across years in age groups 30–44 and 60–64 years. The smallest gender difference in running speed was found in athletes aged 35–39 years with an average difference of 11.3% ± 4.6%, and the largest one in athletes aged 60–64 years with 23.2% ± 6.6%.
Discussion
The aims of the study were to examine, first, participa-tion and performance trends in 24-h ultra-marathons held worldwide between 1998 and 2011 and, second, the age of peak 24-h running performance. The main find-ings were, first, the number of finishers increased for both genders, second, the annual top ten women im-proved running speed, but not men, and, third, the age of peak running speed decreased for the annual top ten women, but not for men.
Increase in participation in 24-h ultra-marathons
The number of finishers increased over years for both women and men. Running events are of high popularity with increasing numbers of participants [15-17]. The number of 24-h ultra-marathoners increased in both genders. Eichenberger et al. [11] reported similar find-ings for mountain ultra-marathoners competing in the 78-km Swiss Alpine Marathon held in Switzerland. The number of women increased between 2000 and 2011 but the number of men remained unchanged. Burfoot [3] reported an increase in the numbers of athletes in major marathons around the world such as New York City Marathon or ‘Boston Marathon’. These findings showed that master runners continue with an increased participa-tion in both marathons and ultra-marathons worldwide.
Female participation was at 20.2% during this period and increased from 16.0% (1998) to 23.1% (2011). Simi-lar findings were reported for 161-km ultra-marathoners competing in the Western States 100-Mile Endurance Run between 1974 and 2007 [14]. Women accounted for 10%–12% of the field in 1986–1988 and for 20%–22% of
1998 1999 2000 2001 2002 2003 2004 2005 2006 2007 2008 2009 2010 2011 65 70 75 80 85 90 95 100 30-34 40-44 45-49; r2= 0.34; P = 0.03 35-39 50-54; r2= 0.50; P < 0.01 55-59; r2= 0.70; P < 0.01 25-29; r2= 0.48; P = 0.02 60-64; r2= 0.44; P = 0.03 Year Performance Ratio (%)
Figure 7Change in performance ratio for the different age groups for men from 1998 to 2011. Performance ratio is expressed as percentage of the performance of the overall top ten athletes in the respective year. r2and P values are inserted in case of a significant change
the field since 2001. Generally, men are over-represented in arts, sciences, and sports [37]. In distance running, more men than women run relatively fast [38] which is partly attributed to the greater training motivation in men [37]. Although female participation increased in US road races, the sex difference in performance remained stable [38]. A greater training motivation and a faster performance in men might be explained by the facts that most popular modern male sports re-quire the skills needed for success in male-male phys-ical competition, male champion athletes obtain a high status, and men pay closer attention than women to male sports [39].
Runners over 35 years old achieved the best performances
Master runners aged >35 years achieved 120 (85.7%) of 140 annuals top ten results in men and 129 (92.1%) of 140 in women. Therefore, runners aged >35 years domi-nated 24-h ultra-marathons, while only a few runners younger than 35 years were able to keep up with the elite master athletes. The average age of the 140 top ten rankings was 43.4 years in women and 42.1 years in men, respectively. The age of peak running speed in a 24-h ultra-marathon was considerably higher than reported for marathons of around 30 years [28], of 33–37 years in 78-km mountain ultra-marathoners [11], and of 35–40 years for 161-km ultra-marathoners [14]. The definition of a ‘master athlete’ [1] needs to be revised in the near future since there seemed to be no difference in the running speed between the annual top athletes and master athletes.
The gender difference in 24-h running speed
The gender difference in running speed in 24-h ultra-marathoners aged between 30 and 44 years decreased. Men maintained running speed in age groups between 30 and 44 years, whereas women increased their running speed in the age groups of 30–44 years across years. Younger athletes aged 25–29 years improved peak run-ning speed in both genders which was quite unexpected. For example, Lepers and Cattagni [2] reported an im-provement in running performance especially for master marathoners, but not for younger athletes. On the other site, older master athletes in the age group 55–64 years improved running speed in both genders, which is consist-ent with the findings of Lepers and Cattagni [2] for mara-thoners. Lepers and Cattagni [2] reported that running speed of male master marathoners within the 40–64 years age range have plateaued, while men older than 64 years and women older than 44 years improved running speed from 1980 to 2009. Since women increased and men only maintained running speed, the gender difference in per-formance decreased. Similar findings have been reported for marathoners. Lepers and Cattagni [2] showed that the gender differences in running times for marathoners de-creased over the last three decades but remained relatively stable across the ages during the last decade.
Physiological differences between genders in maximal
aerobic capacity (VO2max), skeletal muscle mass,
vel-ocity at lactate threshold, blood volume, maximum heart rate (HRmax), or stroke volume seemed to influence the
gender difference [40-43]. For example, VO2max was
found to be an important contributor to endurance
per-formance in master runners [40], while VO2max was
reported to differ among genders [41]. Since differences
1998 1999 2000 2001 2002 2003 2004 2005 2006 2007 2008 2009 2010 2011 5 10 15 20 25 30 35 40 45 60-64; r2= 0.54; P = 0.01 25-29 55-59 45-49 50-54 30-34; r2= 0.51; P < 0.01 40-44; r2= 0.50; P < 0.01 35-39; r2= 0.38; P = 0.02 Year Gender Difference (%)
Figure 8Change in gender difference in 24-hour ultra-marathon running performance for each age group from 1998 to 2011. R2and
seemed to be quite constant between genders, VO2max
seemed to be of biological origin [42]. Reaburn and
Dascombe [1] reported VO2max to be the main reason
for the decline in endurance performance; while other physiological variables such as HRmax, running velocity at lactate threshold, blood volume, or muscle mass
seemed to be of lesser importance than VO2max.
A further important aspect of gender difference of running performance may lie in social aspects. The mo-tivation in female runners differs from male runners [1,37-39,44], which could be an important reason for the differences in participation rates [2,37,38] and running performance [2,15-17]. Hodge et al. [8] found in master athletes enjoyment of their participation, a high commit-ment, high perceptions of ability and belonging, and an intrinsic motivation. These findings may explain the fact why master runners tend to participate in competitions not attracting much public attention and therefore re-quire mostly intrinsic motivation.
The age of peak running speed
Another important finding was that the age of the an-nual top ten men showed no change during the 14-year period whereas the annual top ten women became younger. Additionally, the age of the annual fastest men showed no change during the 14-year period, whereas the annual fastest women became younger. Generally, the fastest 24-h female ultra-marathoners became younger. Additionally, the beginning of the age range of peak running speed in life was equal for both women and men.
However, a difference can be found in the length of the time span where women and men could maintain their peak running speed. Women could maintain peak running speed longer in life up to 54 years. The top ten women could keep up peak running speed for a time span of 20 years (34–54 years), while the top ten male runners could maintain peak running speed only for 15 years (34–49 years). Knechtle et al. [19] found similar re-sults for 100-km ultra-marathoners. They showed that female ultra-marathoners had a later decline in peak running speed at about 54 years of age than men at around 49 years. Tanaka and Seals [43] described peak endurance performance to be maintained until approxi-mately 35 years of age, followed by a modest decrease until 50–60 years of age. Leyk et al. [4] similarly demon-strated that running speed showed no changes before the age of 50 years in marathoners and half-marathoners. An important limitation in investigating gender difference was the low number of female athletes especially in the earlier years.
The finding that the age of the annual top ten women decreased and the running speed of the annual top ten women improved is a new and unexpected finding.
Different findings were reported for 161-km ultra-marathoners. Hoffman and Wegelin found in the Western States 100-Mile Endurance Run an increase in the age of the overall top five women and men be-tween 1974 and 2007 where men showed no change in finish times but women have improved race times [14]. An improvement in female performance in the 24-h ultra-marathons might be explained with the increased fe-male participation across the years. Some fefe-male finishers might have participated in several races for several years and gained experience and improved performance. Recent studies showed that previous experience such as personal best time was a strong predictor variable [45-48] in ultra-endurance performance.
A further important finding was the significant change in the gender difference in running speed across time. The annual fastest woman was on average about 13.2% slower than the fastest annual man, while the gender dif-ference in running speed for the fastest annual athletes remained unchanged. The gender difference of the an-nual top ten athletes was 12.9% and therefore seemed to be in line with earlier reports. Cheuvront et al. [33] found the gender difference to be constant at 8%–14% in running races ranging from 1,500 to 42,195 m. In lon-ger distances, Coast et al. [49] found over distances ran-ging from 100 m to 200 km a mean gender difference of 12.4%. Although it was speculated in the past that perfor-mances in both genders would eventually intersect and women could outrun men, these results show a difference in performance between genders. Krouse et al. [44] in-vestigated motivation, goal orientation, and coaching in female ultra-marathoners. They reported that female ultra-marathoners were highly in task oriented and only little ego oriented. These intrinsic motivational factors may as well influence a relative constant gender differ-ence in running speed.
Why do master runners dominate ultra-marathon running?
The present findings showed that female and male mas-ter runners improved performance. Potential explana-tions for these findings could be motivational and social aspects [44,50], improvements in training [5], an in-crease in previous experience [1,45-48], and an inin-creased longevity in the general population [51,52]. Knechtle et al. [53] reported that the personal best marathon run-ning performance, but neither anthropometric nor train-ing characteristics, were associated with performance in a 24-hour ultra-marathon. Therefore, all physiological parameters discussed earlier would not impact running performance in ultra-marathon distances as suggested by other authors [1,40-43]. Leyk et al. [54] found per-formance losses in middle age mainly to be due to a sedentary lifestyle, rather than biological aging. They
showed that decline in performance was not related to age until the age of 55 years.
The aging society could provide another reason why the performance in master runners increased. For ex-ample, Robine and Paccaud [55] found an increase in the number of nonagenarians and centenarians in Switzerland as a result of a decreased mortality after the age of 80 years. But why do people get older in the general population? As the share of older people in-creased over the years [51,52], more master runners had the chance to participate in running competitions. Van Gool et al. [56] investigated between 1990 and 2007 in the Netherlands whether an increase in life ex-pectancy was associated with a decrease in physical ac-tivity limitations. They reported that even though life expectancy increased, limitations of physical activity showed no decrease. Therefore, the gain of more years in life does influence the number of potential master runners but does not influence the level of their phys-ical activity. Physphys-ical activities are known to differ be-tween people living in a city or in the country [57,58]. Van Cauwenberg et al. [59] found in Belgium signifi-cant differences of habits of physical habits between rural and city citizens as they differed in type and quan-tity of physical exercise. Another important factor in aging and physical activity seemed to be nutrition [57]. Wagner et al. [57] showed that nutrition such as vita-min intake especially in seniors directly influenced their physical mobility. Healthy habits seemed to have an impact on life expectancy as earlier reported [59]. Among others, nutrition, non-smoking, and increased physical activity influenced mortality [59]. Master run-ners seemed not generally too old to accomplish aston-ishing feats in ultra-endurance running. Healthy habits such as continuous physical activities throughout life combined with training effort and commitment can compensate much of the age-related decrease in run-ning performance.
Limitations and implications for future research
This study is limited since variables such as physiological parameters [60], anthropometric characteristics [61,62], training data [63,64], previous experience [45-48,53,65] nutrition [66,67], fluid intake [68], environmental condi-tions [69-71], and motivational [37-39,44] factors were not considered. These variables may have had an influ-ence on the race outcome. An athlete might have com-peted in several races a year and in the same race for several consecutive years. This might potentially have af-fected the analyses. Future studies need to investigate master runners in longer time-limited ultra-marathons such as 6 days and 10 days runs in case there would be enough runners aged 50 years or older.
Conclusions
To summarize, the annuals fastest woman and the an-nual top ten women improved running speed over time while men only maintained running speed. The age of peak running speed of the annual fastest athletes was at approximately 38 years for women and at approximately 41 years for men. The annual top ten male athletes were approximately 41 years and the annual top ten female athletes 43 years of age. Therefore, the annual top run-ners were master runrun-ners by definition. The definition of master athletes >35 years needs to be questioned for ultra-marathoners. Future studies need to investigate longer time-limited competitions such as 48 h, 72 h, 6 days, and 10 days to investigate whether the age of peak running speed is even higher in longer races and in-creases with increasing length of the distance. The find-ings that the annual ten fastest women became faster and younger needs further investigation in other ultra-running distances.
Abbreviations
HRmax:Maximum heart rate; VO2max: Maximal aerobic capacity.
Competing interests
The authors report no conflicts of interest in this work. Authors’ contributions
MZ wrote the manuscript, CAR performed the statistical analyses, RL and TR helped in the statistical analyses, and BK collected the data. All authors read and approved the final manuscript.
Acknowledgments
The authors thank Matthias Knechtle and Mary Miller for their help in translation.
Author details
1Institute of General Practice and for Health Services Research, University of
Zurich, Zurich, Switzerland.2Gesundheitszentrum St. Gallen, Vadianstrasse 26, St. Gallen 9001, Switzerland.3INSERM U1093, Faculty of Sport Sciences,
University of Burgundy, Dijon, France.
Received: 11 November 2012 Accepted: 15 March 2013 Published: 1 July 2013
References
1. Reaburn P, Dascombe B: Endurance performance in masters athletes. Eur Rev Aging Phys Activ 2008, 5:31–42.
2. Lepers R, Cattagni T: Do older athletes reach limits in their performance during marathon running? Age (Dordr) 2011, 34:773–781.
3. Burfoot A: The history of the marathon: 1976-present. Sports Med 2007, 37:284–287.
4. Leyk D, Erley O, Ridder D, Leurs M, Rüther T, Wunderlich M, Sievert A, Baum K, Essfeld D: Age-related changes in marathon and half-marathon performances. Int J Sports Med 2007, 28:513–517.
5. Leyk D, Erley O, Gorges W, Ridder D, Rüther T, Wunderlich M, Sievert A, Essfeld D, Piekarski C, Erren T: Performance, training and lifestyle parameters of marathon runners aged 20–80 years: results of the PACE-study. Int J Sports Med 2009, 30:360–365.
6. Buskirk ER, Hodgson JL: Age and aerobic power: the rate of change in men and women. Fed Proc 1987, 46:1824–1829.
7. Faulkner JA, Larkin LM, Claflin DR, Brooks SV: Age-related changes in the structure and function of skeletal muscles. Clin Exp Pharmacol Physiol 2010, 34:1091–1096.
8. Hodge K, Allen JB, Smellie L: Motivation in masters sport: achievement and social goals. Psychol Sport Exerc 2008, 9:157–176.
9. Parise CA, Hoffman MD: Influence of temperature and performance level on pacing a 161 km trail ultramarathon. Int J Sports Physiol Perform 2011, 6:243–251.
10. De Paula VJ, Amorim FT, Alves MN, Passos RL, Meyer F: Run performance of middle-aged and young adult runners in the heat. Int J Sports Med 2012, 33:211–217.
11. Eichenberger E, Knechtle B, Knechtle P, Rüst CA, Rosemann T, Lepers R, Senn O: Age and sex interactions in mountain ultramarathon running– the Swiss Alpine Marathon. Open Access J Sports Med 2012, 3:145–152. 12. Zingg MA, Knechtle B, Rüst CA, Rosemann T, Lepers R. Analysis of
participation and performance in athletes by age group in ultramarathons of more than 200 km in length. Int J Gen Med 2013, 6:209-220.
13. Trappe S: Marathon runners: how do they age? Sports Med 2007, 37:302–305.
14. Hoffman MD, Wegelin JA: The Western States 100-Mile Endurance Run: participation and performance trends. Med Sci Sports Exerc 2009, 41:2191–2198.
15. Ultra-Marathon Running Resource. [http://www.ultramarathonrunning. com/]
16. Marathon Guide. [http://www.marathonguide.com/]
17. Deutsche Ultramarathon Vereinigung. [http://www.ultra-marathon.org/] 18. Jokl P, Sethi PM, Cooper AJ: Master's performance in the New York City
Marathon 1983–1999. Br J Sports Med 2004, 38:408–412.
19. Knechtle B, Rüst CA, Rosemann T, Lepers R: Age-related changes in 100-km ultra-marathon running performance. Age (Dordr) 2012, 34:1033–1045. 20. Bird SR, Theakston SC, Owen A, Nevill AM: Characteristics associated with
10-km running performance among a group of highly trained male endurance runners aged 21–63 years. J Aging Phys Act 2003, 11:333–350. 21. Rittweger J, di Prampero PE, Maffulli N, Narici MV: Sprint and endurance
power and ageing: an analysis of master athletic world records. Proc Biol Sci 2009, 276:683–689.
22. Wiswell RA, Jaque SV, Marcell TJ, Hawkins SA, Tarpenning KM, Constantino N, Hyslop DM: Maximal aerobic power, lactate threshold, and running performance in master athletes. Med Sci Sports Exerc 2000, 32:1165–1170. 23. Balmer J, Bird S, Davison R: Indoor 16.1-km time-trial performance in
cyclists aged 25–63 years. J Sports Sci 2008, 26:57–62.
24. Donato AJ, Tench K, Glueck DH, Seals DR, Eskurza I, Tanaka H: Declines in physiological functional capacity with age: a longitudinal study in peak swimming performance. J Appl Physiol 2003, 94:764–769.
25. Wright VJ, Perricelli BC: Age-related rates of decline in performance among elite senior athletes. Am J Sports Med 2008, 36:443–450. 26. Baker AB, Tang YQ, Turner MJ: Percentage decline in masters superathlete
track and field performance with aging 2003. Exp Aging Res 2003, 29:47–65.
27. Tanaka H, Seals DR: Invited review: dynamic exercise performance in masters athletes: insight into the effects of primary human aging on physiological functional capacity. J Appl Physiol 2003, 95:2152–2162. 28. Hunter SK, Stevens AA, Magennis K, Skelton KW, Fauth M: Is there a sex
difference in the age of elite marathon runners? Med Sci Sports Exerc 2011, 43:656–664.
29. Schulz R, Curnow C: Peak performance and age among superathletes: track and field, swimming, baseball, tennis, and golf. J Gerontol 1988, 43:113–120.
30. Baker AB, Tang YQ: Aging performance for masters records in athletics, swimming, rowing, cycling, triathlon, and weightlifting. Exp Aging Res 2010, 36:453–477.
31. Pate RR, O'Neill JR: American women in the marathon. Sports Med 2007, 37:294–298.
32. Medic N, Young BW, Starkes JL, Weir PL, Grove JR: Gender, age, and sport differences in relative age effects among US Masters swimming and track and field athletes. J Sports Sci 2009, 27:1535–1544.
33. Cheuvront SN, Carter R, Deruisseau KC, Moffatt RJ: Running performance differences between men and women: an update. Sports Med 2006, 35:1017–1024.
34. Thibault V, Guillaume M, Berthelot G, El Helou N, Schaal K, Quinquis L, Nassif H, Tafflet M, Escolano S, Hermine O, Toussaint JF: Women and men in sport performance: the gender gap has not evolved since 1983. J Sports Sci Med 2010, 9:214–223.
35. Bam J, Noakes TD, Juritz J, Dennis SC: Could women outrun men in ultramarathon races? Med Sci Sports Exerc 1997, 29:244–247.
36. Whipp BJ, Ward SA: Will women soon outrun men? Nature 1992, 355:25.
37. Deaner RO: Distance running as an ideal domain for showing a sex difference in competitiveness. Arch Sex Behav 2013, 42:413–428. 38. Deaner RO, Mitchell D: More men run relatively fast in U.S. road races,
1981–2006: a stable sex difference in non-elite runners. Evol Psychol 2011, 9:600–621.
39. Lombardo MP: On the evolution of sport. Evol Psychol 2012, 10:1–28. 40. Tanaka K, Takeshima N, Kato T, Niihata S, Ueda K: Critical determinants of
endurance performance in middle-aged and elderly endurance runners with heterogeneous training habits. Eur J Appl Physiol 1990, 59:443–449. 41. Weiss EP, Spina RJ, Holloszy JO, Ehsani AA: Gender differences in the
decline in aerobic capacity and its physiological determinants during the later decades of life. J Appl Physiol 2006, 101:938–944.
42. Sparling PB, Cureton KJ: Biological determinants of the sex difference in 12-min run performance. Med Sci Sports Exerc 1983, 15:218–223. 43. Tanaka H, Seals DR: Endurance exercise performance in Masters athletes:
age-associated changes and underlying physiological mechanisms. J Physiol 2008, 586:55–63.
44. Krouse RZ, Ransdell LB, Lucas SM, Pritchard ME: Motivation, goal orientation, coaching, and training habits of women ultrarunners. J Strength Cond Res 2011, 25:2835–2842.
45. Knechtle B, Knechtle P, Rosemann T, Senn O: Personal best time and training volume, not anthropometry, is related to race performance in the ‘Swiss Bike Masters’ mountain bike ultramarathon. J Strength Cond Res 2011, 25:1312–1317.
46. Knechtle B, Knechtle P, Rosemann T, Senn O: Personal best time, not anthropometry or training volume, is associated with total race time in a triple iron triathlon. J Strength Cond Res 2011, 25:1142–1150.
47. Knechtle B, Wirth A, Baumann B, Knechtle P, Rosemann T: Personal best time, percent body fat, and training are differently associated with race time for male and female ironman triathletes. Res Q Exerc Sport 2010, 81:62–68.
48. Herbst L, Knechtle B, Lopez CL, Andonie JL, Fraire OS, Kohler G, Rüst CA, Rosemann T: Pacing strategy and change in body composition during a Deca Iron Triathlon. Chin J Physiol 2011, 54:255–263.
49. Coast JR, Blevins JS, Wilson BA: Do gender differences in running performance disappear with distance? Can J Appl Physiol 2004, 29:139–145.
50. Hoffman MD, Fogard K: Demographic characteristics of 161-km ultramarathon runners. Res Sports Med 2012, 20:59–69. 51. Wanner P: Mortality of 1880–1980 generations in Switzerland: a
rereading of evolution of mortality based on longitudinal data. Soz Praventivmed 2002, 47:399–407.
52. Savidan A, Junker C, Cerny T, Ess S: Premature deaths in Switzerland from 1995–2006: causes and trends. Swiss Med Wkly 2010, 140:w13077. 53. Knechtle B, Knechtle P, Rosemann T, Senn O: What is associated with race
performance in male 100-km ultra-marathoners–anthropometry, training or marathon best time? J Sports Sci 2011, 29:571–577.
54. Leyk D, Rüther T, Wunderlich M, Sievert A, Essfeld D, Witzki A, Erley O, Küchmeister G, Piekarski C, Löllgen H: Physical performance in middle age and old age: good news for our sedentary and aging society. Dtsch Arztebl Int 2010, 107:809–916.
55. Robine JM, Paccaud F: Nonagenarians and centenarians in Switzerland, 1860–2001: a demographic analysis. J Epidemiol Community Health 2005, 59:31–37.
56. Van Gool CH, Picavet HS, Deeg DJ, de Klerk MM, Nusselder WJ, van Boxtel MP, Wong A, Hoeymans N: Trends in activity limitations: the Dutch older population between 1990 and 2007. Int J Epidemiol 2011, 40:1056–1067. 57. Wagner KH, Haber P, Elmadfa I: Thanks to body exercise, getting mobile
and being less dependent. Ann Nutr Metab 2008, 52:38–42. 58. Chakravarty EF, Hubert HB, Krishnan E, Bruce BB, Lingala VB, Fries JF:
Lifestyle risk factors predict disability and death in healthy aging adults. Am J Med 2012, 125:190–197.
59. Van Cauwenberg J, Clarys P, De Bourdeaudhuij I, Van Holle V, Verté D, De Witte N, De Donder L, Buffel T, Dury S, Deforche B: Physical environmental factors related to walking and cycling in older adults: the Belgian aging studies. BMC Publ Health 2012, 12:142.
60. Billat VL, Demarle A, Slawinski J, Paiva M, Koralsztein JP: Physical and training characteristics of top-class marathon runners. Med Sci Sports Exerc 2010, 33:2089–2097.
61. Knechtle B, Duff B, Welzel U, Kohler G: Body mass and circumference of upper arm are associated with race performance in ultraendurance
runners in a multistage race—the Isarrun 2006. Res Q Exerc Sport 2009, 80:262–268.
62. Knechtle B, Knechtle P, Rosemann T: Race performance in male mountain ultra-marathoners: anthropometry or training? Percept Mot Skills 2010, 110:721–735.
63. Hagan RD, Smith MG, Gettman LR: Marathon performance in relation to maximal aerobic power and training indices. Med Sci Sports Exerc 1981, 13:185–189.
64. Hagan RD, Upton SJ, Duncan JJ, Gettman LR: Marathon performance in relation to maximal aerobic power and training indices in female distance runners. Br J Sports Med 1987, 21:3–7.
65. March DS, Vanderburgh PM, Titlebaum PJ, Hoops ML: Age, sex, and finish time as determinants of pacing in the marathon. J Strength Cond Res 2011, 25:386–391.
66. Maughan RJ, Shirreffs SM: Nutrition for sports performance: issues and opportunities. Proc Nutr Soc 2011, 17:1–8.
67. Rodriguez NR, Di Marco NM, Langley S: American College of Sports Medicine position stand. Nutrition and athletic performance. Med Sci Sports Exerc 2009, 41:709–731.
68. Williams J, Tzortziou Brown V, Malliaras P, Perry M, Kipps C: Hydration strategies of runners in the London Marathon. Clin J Sport Med 2012, 22:152–156.
69. Ely MR, Cheuvront SN, Roberts WO, Montain SJ: Impact of weather on marathon-running performance. Med Sci Sports Exerc 2007, 39:487–493. 70. Trapasso LM, Cooper JD: Record performances at the Boston Marathon:
biometeorological factors. Int J Biometeorol 1989, 33:233–237. 71. Vihma T: Effects of weather on the performance of marathon runners.
Int J Biometeorol 2010, 54:297–306.
doi:10.1186/2046-7648-2-21
Cite this article as: Zingg et al.: Master runners dominate 24-h ultramarathons worldwide—a retrospective data analysis from 1998 to 2011. Extreme Physiology & Medicine 2013 2:21.
Submit your next manuscript to BioMed Central and take full advantage of:
• Convenient online submission
• Thorough peer review
• No space constraints or color figure charges
• Immediate publication on acceptance
• Inclusion in PubMed, CAS, Scopus and Google Scholar
• Research which is freely available for redistribution
Submit your manuscript at www.biomedcentral.com/submit