HAL Id: tel-02335463
https://tel.archives-ouvertes.fr/tel-02335463
Submitted on 28 Oct 2019
HAL is a multi-disciplinary open access archive for the deposit and dissemination of sci-entific research documents, whether they are pub-lished or not. The documents may come from teaching and research institutions in France or abroad, or from public or private research centers.
L’archive ouverte pluridisciplinaire HAL, est destinée au dépôt et à la diffusion de documents scientifiques de niveau recherche, publiés ou non, émanant des établissements d’enseignement et de recherche français ou étrangers, des laboratoires publics ou privés.
expérimentales de la génomique fonctionnelle
Natalia Rubanova
To cite this version:
Natalia Rubanova. MasterPATH : l’analyse de réseau des données expérimentales de la génomique fonctionnelle. Molecular biology. Université Sorbonne Paris Cité, 2018. English. �NNT : 2018US-PCC109�. �tel-02335463�
Thèse de doctorat
de l’Université Sorbonne Paris Cité
Préparée à l’Université Paris Diderot
Ecole doctorale Frontières Du Vivant ED 474
Laboratoire "Epigénétique et Cancer" CNRS UMR9198/FRE3377
MasterPATH: network analysis of functional
genomics screening data
Par Natalia Rubanova
Thèse de doctorat de Biologie
Dirigée par Nadya Morozova
Présentée et soutenue publiquement à l'IHÉS le 22/02/2018
Président du jury : Soulé, Christophe / Dr. / CNRS, IHÉS
Rapporteurs : Campalans, Anna / Dr. / CEA, Université Paris Diderot van Baalen, Minus / Dr. / CNRS, Institut Biologie de l'ENS Examinateurs : Zinovyev, Andrei / Dr. / Institut Curie, Université PSL
Ginestier, Christophe / Dr. / INSERM, Université d'Aix-Marseille Polesskaya, Anna / Dr. / CNRS, Ecole Polytechnique
Directeur de thèse : Morozova, Nadya / Dr. / CNRS, Université Paris Sud, CEA Saclay Membre invités : Harel-Bellan, Annick / Dr. / IHÉS
1 Titre : MasterPATH : l'analyse de réseau des données expérimentales de la génomique
fonctionnelle.
Résumé : Les technologies « omics » et notamment les technologies de la génomique fonctionnelle utilisent des approches expérimentales à haut débit dont le but est déterminer des composants biologiques (des gènes, l’acide ribonucléique messager, l’acide ribonucléique micro, des
protéines…) relevant de ce phénotype. La perte de fonction de l’étude basée au mécanisme ARN-interférence ou CRISPR/Cas9 et le profilage du transcriptome (en utilisant des puces d l'ADN ou des méthodes RNA-seq) sont les technologies « omics » les plus répandues de nos jours. Telles études génèrent de grands volumes des données qui sont représenté d'habitude par une liste rangée des composants biologiques d’où on peut obtenir une soi-disant « hit-liste » en utilisant des méthodes statistiques convenantes. Bien qu'il suffit pour définir les composants biologiques principaux qui sont importants pour ce phénotype, les méthodes de rangement ne peuvent pas aider à
déterminer la figure du système biologique étudié la plus détaillée.
Depuis 15 ans on a élaboré une grande quantité des méthodes calculatoires pour l'interprétation des données « omics » et la définition des mécanismes moléculaires qui sont la base de ce phénotype. On peut diviser ces méthodes en deux catégories : (1) les méthodes de l'analyse des voies moléculaires définissant les voies moléculaires canoniques ou les listes annotées des composants biologiques qui sont sur- ou sous-représenté dans la liste rangée (ou dans la « hit-liste »); (2) les méthodes de l’analyse de réseau qui utilisent les réseaux des interactions moléculaires comme l'information supplémentaire. La plupart des méthodes de l’analyse de réseau publiées définissent un sous-réseau qui est considérablement enrichi par les composants biologiques de la liste rangée (ou la « hit-liste »). Telle sous-réseau peut aider à définir des
relations importantes entre les composants biologiques dans le contexte de ce système biologique.
Dans ce travail nous avons élaboré une nouvelle méthode de l'analyse de réseau à définir des membres possibles des voies moléculaires qui sont important pour ce phénotype en utilisant la « hit-liste » des expériences « omics » qui travaille dans le réseau intégré (le réseau comprend des interactions protéine-protéine, de transcription, l’acide ribonucléique micro-l’acide ribonucléique messager et celles métaboliques). La méthode tire des sous-réseaux qui sont construit des voies de quatre types les plus courtes (qui ne se composent des interactions protéine-protéine, ayant au minimum une interaction de transcription, ayant au minimum une interaction l’acide
ribonucléique micro-l’acide ribonucléique messager, ayant au minimum une interaction métabolique) entre des hit –gènes et des soi-disant « exécuteurs terminaux » - les composants biologiques qui participent à la réalisation du phénotype finale (s’ils sont connus) ou entre les hit-gènes (si « des exécuteurs terminaux » sont inconnus). La méthode calcule la valeur de la centralité de chaque point culminant et de chaque voie dans le sous-réseau comme la quantité des voies les plus courtes trouvées sur la route précédente et passant à travers le point culminant et la voie. L'importance statistique des valeurs de la centralité est estimée en comparaison avec des valeurs de la centralité dans les sous-réseaux construit des voies les plus courtes pour les hit-listes choisi occasionnellement. Il est supposé que les points culminant et les voies avec les valeurs de la centralité statistiquement signifiantes peuvent être examinés comme les membres possibles des voies moléculaires menant à ce phénotype. S’il y a des valeurs expérimentales et la P-valeur pour un grand nombre des points culminant dans le réseau, la méthode fait possible de calculer les valeurs expérimentales pour les voies (comme le moyen des valeurs expérimentales des points culminant sur la route) et les P-valeurs expérimentales (en utilisant la méthode de Fischer et des transpositions multiples).
2 A l'aide de la méthode masterPATH on a analysé les données de la perte de fonction сriblage de l’acide ribonucléique micro et l'analyse de transcription de la différenciation terminal musculaire et les données de la perte de fonction сriblage du procès de la réparation de l'ADN. On peut trouver le code initial de la méthode si l’on suit le lien https://github.com/daggoo/masterPATH.
Mots clefs : Analyse des réseaux, perte de fonction сriblage, profilage du transcriptome, CRISPR/Cas9, voies moléculaires.
3 Title : MasterPATH: network analysis of functional genomics screening data.
Abstract : “Omics” and in particular functional genomics technologies rely on high-throughput experimental approaches aiming at identifying a set of biological components (genes, mRNA, miRNA, proteins…) relevant to a given phenotype. RNAi- or CRISPR/Cas9-based loss-of-function screenings and transcriptomic profiling (using microarrays or RNA-seq methods) are nowadays among the most widespread “omics” technologies. Although different in nature, such studies commonly generate large datasets, usually presented in the form of a ranked list of biological components, from which a so-called ‘hit list’ can be retrieved by applying an appropriate statistical threshold. While this is usually sufficient to identify key biological components relevant to a given phenotype, ranking methods fail to provide a broader picture of the biological system under study.
Numerous computational methods to interpret “omics” datasets and infer molecular machinery underlying a given phenotype have been developed in the past 15 years. They can be grouped into two categories: (1) pathway analysis methods, relying on the identification of canonical pathways or annotated biological components that are over- or underrepresented in a ranked dataset (or a hit list). (2) network analysis methods, using molecular interaction networks to provide
complementary information. Most of the published network analysis methods aim at identifying a subnetwork significantly enriched with the biological components from a ranked dataset (or a hit list). The subnetwork can thus facilitate the identification of important relationships between the biological components, in the context of a specific biological system.
In this work we developed a new exploratory network analysis method, that works on an integrated network (the network consists of protein-protein, transcriptional, miRNA-mRNA, metabolic interactions) and aims at uncovering potential members of molecular pathways important for a given phenotype using hit list dataset from “omics” experiments. The method extracts subnetwork built from the shortest paths of 4 different types (with only protein-protein interactions, with at least one transcription interaction, with at least one miRNA-mRNA
interaction, with at least one metabolic interaction) between hit genes and so called “final
implementers” – biological components that are involved in molecular events responsible for final phenotypical realization (if known) or between hit genes (if “final implementers” are not known). The method calculates centrality score for each node and each path in the subnetwork as a number of the shortest paths found in the previous step that pass through the node and the path. Then, the statistical significance of each centrality score is assessed by comparing it with centrality scores in subnetworks built from the shortest paths for randomly sampled hit lists. It is
hypothesized that the nodes and the paths with statistically significant centrality score can be considered as putative members of molecular pathways leading to the studied phenotype. In case experimental scores and p-values are available for a large number of nodes in the network, the method can also calculate paths’ experiment-based scores (as an average of the experimental scores of the nodes in the path) and experiment-based p-values (by aggregating p-values of the nodes in the path using Fisher’s combined probability test and permutation approach).
The method is illustrated by analyzing the results of miRNA loss-of-function screening and transcriptomic profiling of terminal muscle differentiation and of ‘druggable’ loss-of-function screening of the DNA repair process. The Java source code is available on GitHub page
https://github.com/daggoo/masterPATH.
Keywords : Network analysis, loss-of-function screening, RNA interference, transcriptome profiling, CRISPR/Cas9, molecular pathway
4
5
Table of Contents
ACKNOWLEDGEMENTS ... 6 LIST OF FIGURES ... 7 LIST OF TABLES ... 8 1 BACKGROUND ... 9FUNCTIONAL GENOMICS TECHNOLOGIES ... 9
RNAI-BASED LOSS-OF-FUNCTION SCREENING ... 9
CRISPR/CAS9-BASED LOSS-OF-FUNCTION SCREENING ... 17
TRANSCRIPTOME PROFILING ... 24
COMPUTATIONAL ANALYSIS OF FUNCTIONAL GENOMICS DATA ... 27
2 NETWORK ANALYSIS OF FUNCTIONAL GENOMICS SCREENING DATA ... 34
MASTERPATH ALGORITHM ... 35
DATABASES ... 37
SOFTWARE IMPLEMENTATION ... 39
THE STUDY OF THE SHORTEST PATH APPROACH ... 41
TOPOLOGICAL PROPERTIES OF THE PPI AND THE INTEGRATED NETWORKS ... 56
APPLICATION: HUMAN MUSCLE DIFFERENTIATION MIRNA LOSS-OF-FUNCTION SCREENING AND TRANSCRIPTOME PROFILING ... 57
APPLICATION: HUMAN DNA REPAIR PROCESS RNAI LOSS-OF-FUNCTION SCREENING ... 76
3 DISCUSSION ... 81
4 CONCLUSION ... 83
REFERENCES ... 84
APPENDIX 1 APPLICATION: ARP2/3 RNAI LOSS-OF-FUNCTION SCREENING ... 105
6
Acknowledgements
I would like to thank my supervisors Dr. Annick Harel-Bellan and Dr. Nadya Morozova; my Thesis Advisory Committee members Dr. Anna Campalans and Dr. Andrey Zinoviev; Dr. Guillaume Pinna and Dr. Anna Poleskaya for participating in the analysis of the experimental data and providing valuable comments on the text.
7
List of Figures
FIGURE 1-1. DSRNA AND MIRNA INTERFERENCE PATHWAY. ... 12
FIGURE 1-2. THREE STAGES OF CRISPR-CAS IMMUNITY MECHANISM. ... 19
FIGURE 2-1. OVERVIEW OF MASTERPATH. ... 35
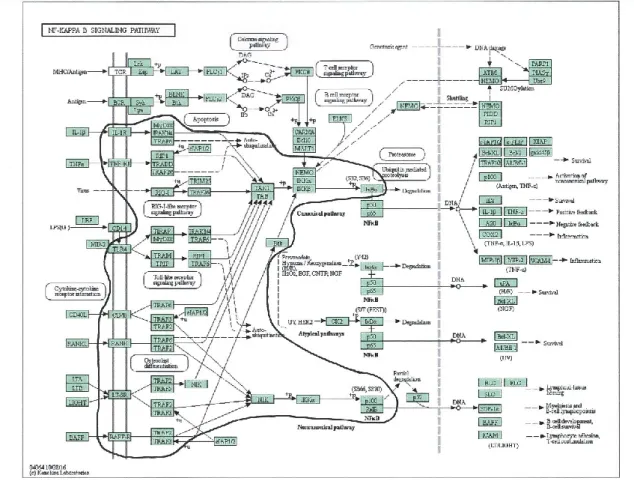
FIGURE 2-2. NF-ΚB SIGNAL TRANSDUCTION PATHWAY. ... 42
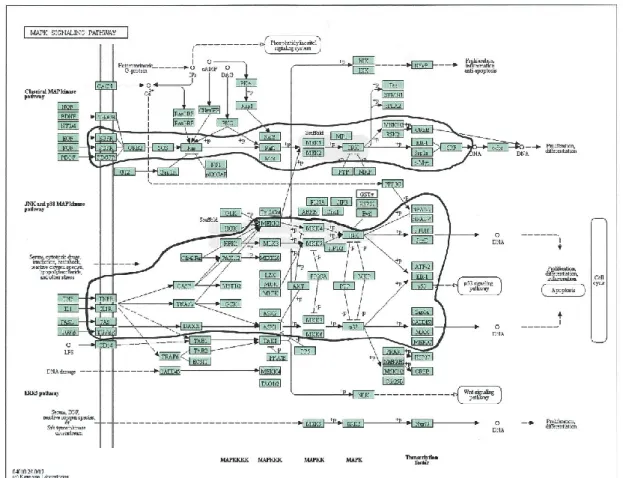
FIGURE 2-3. MAPK SIGNAL TRANSDUCTION PATHWAY. ... 43
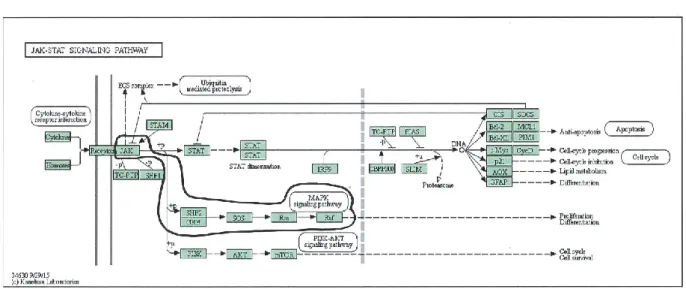
FIGURE 2-4. JAK/STAT SIGNAL TRANSDUCTION PATHWAY. ... 44
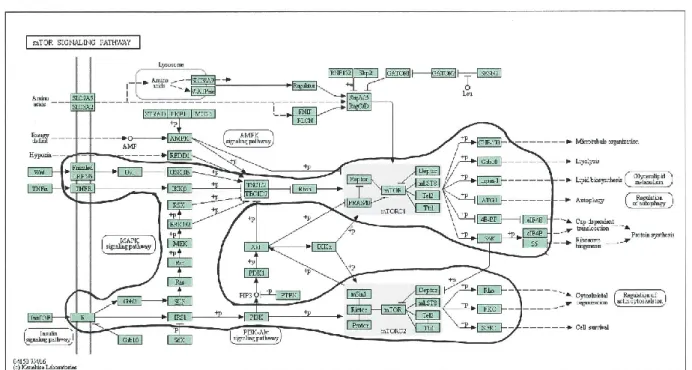
FIGURE 2-5 MTOR SIGNAL TRANSDUCTION PATHWAY. ... 45
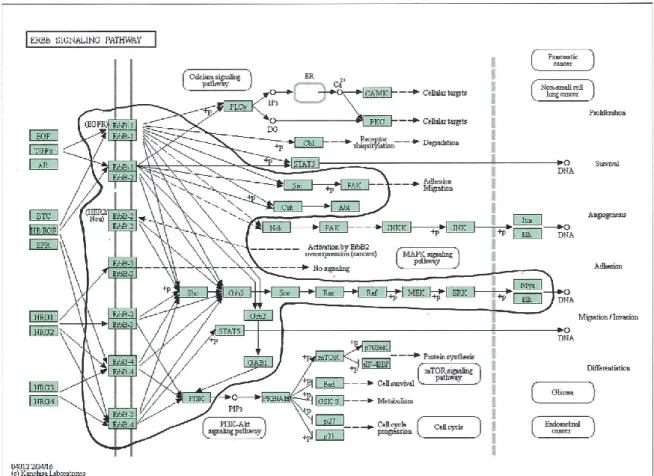
FIGURE 2-6 ERBB SIGNAL TRANSDUCTION PATHWAY. ... 46
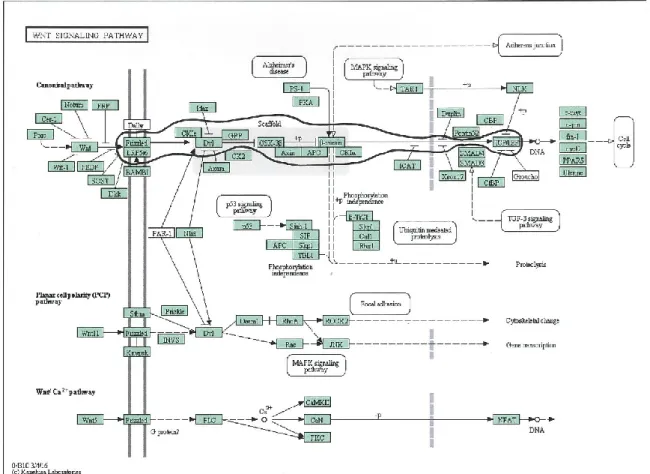
FIGURE 2-7. WNT SIGNAL TRANSDUCTION PATHWAY. ... 47
FIGURE 2-8. TGF-BETA SIGNAL TRANSDUCTION PATHWAY. ... 48
FIGURE 2-9. APOPTOTIC PATHWAY... 49
FIGURE 2-10. AVERAGE LENGTH IN NUMBER OF INTERACTIONS OF THE SHORTEST PATHS. ... 53
FIGURE 2-11. RELATIVE NUMBER OF CANONICAL PATHS FOR WHICH THE SET OF THE SHORTEST PATHS CONTAINS THE CANONICAL COUNTERPART. ... 54
FIGURE 2-12. RELATIVE NUMBER OF THE CANONICAL PATHS FOR WHICH AT LEAST ONE NODE WITH CENTRALITY SCORE ≥ 2 IN THE SHORTEST PATHS SUBNETWORK BELONG TO THE CANONICAL PATH. ... 55
FIGURE 2-13. RELATIVE NUMBER OF CANONICAL PATHS FOR WHICH AT LEAST ONE PATH WITH CENTRALITY SCORE ≥ 2 IN THE SHORTEST PATHS SUBNETWORK BELONG TO THE CANONICAL PATH. ... 55
FIGURE 2-14. TRANSCRIPTOME PROFILING: MAX - AP2M1 - EHD2 PATH. ... 65
FIGURE 2-15. CDKN1A-MDM2-TCAP-MSTN PATH. ... 71
FIGURE 2-16. THREE PATHS FOR MUSCLE DIFFERENTIATION PROCESS. ... 74
8
List of Tables
TABLE 2-1. DESCRIPTION OF THE DATABASES. ... 38
TABLE 2-2. 46 SIMPLE LINEAR PROTEIN-PROTEIN PATHS OF LENGTH 2-5 INTERACTIONS FOUND FOR 8 CANONICAL PATHWAYS ... 50
TABLE 2-3. TOPOLOGICAL PROPERTIES OF THE PPI AND THE INTEGRATED NETWORKS. ... 56
TABLE 2-4. MIRNA LOSS-OF-FUNCTION SCREENING: HIT LIST. ... 57
TABLE 2-5. TRANSCRIPTOME PROFILING: HIT LIST. ... 59
TABLE 2-6. MIRNA LOSS-OF-FUNCTION SCREENING: TOP 50 NODES WITH THE HIGHEST CENTRALITY SCORES... 62
TABLE 2-7. MIRNA LOSS-OF-FUNCTION SCREENING: TOP 50 PATHS WITH THE HIGHEST CENTRALITY SCORES... 63
TABLE 2-8. TRANSCRIPTOME PROFILING: TOP 50 NODES WITH THE HIGHEST CENTRALITY SCORES AND MIRNAS. ... 66
TABLE 2-9. TRANSCRIPTOME PROFILING: TOP 50 PATHS WITH THE HIGHEST CENTRALITY SCORES. .. 67
TABLE 2-10. COMMON NODES FOR MIRNA LOSS-OF-FUNCTION SCREENING AND TRANSCRIPTOME PROFILING. ... 70
TABLE 2-11. COMMON PATHS FOR LOSS-OF-FUNCTION SCREENING AND TRANSCRIPTOME PROFILING. ... 70
TABLE 2-12. TRANSCRIPTOME PROFILING PATHS THAT PASS THROUGH MIRNA HITS. ... 72
TABLE 2-13. COMPARISON: TOP 50 MIRNA LOSS-OF-FUNCTION SCREENING PATHS THAT PASS THROUGH TRANSCRIPTOME PROFILING HITS. ... 73
TABLE 2-14. DNA REPAIR LOSS-OF-FUNCTION SCREENING: HIT LIST. ... 76
TABLE 2-15. DNA REPAIR LOSS-OF-FUNCTION SCREENING: NODES WITH THE HIGHEST CENTRALITY SCORES... 78
TABLE 2-16. DNA REPAIR LOSS-OF-FUNCTION SCREENING: TOP 50 PATHS WITH THE HIGHEST CENTRALITY SCORES. ... 79
9
1 Background
Functional genomics technologies
Three the most widespread functional genomics technologies are described below.
RNAi-based loss-of-function screening
This section is influenced by Bertil Daneholt’s paper on RNA interference (Daneholt, 2006).
The biological mechanism for repression of gene expression by causing the degradation of mRNA is exploited in the RNA interference(RNAi) based loss-of-function screening.
RNA interference (RNAi) was first detected at least in early 1980s although it was known by other names and the different findings were considered as unrelated processes. First, it was discovered that about 100 nucleotides RNA molecules can bind to a complementary mRNA sequence and inhibit translation in Escherichia coli in 1984 and 1994. Also, a phenomenon called gene (or RNA) silencing was shown in plants around 1990 in the works of (Matzke et al., 1989) and (Wassenegger et al., 1994). It was shown that the gene activity can be induced, stimulated and the expression of homologous sequences can be inhibited in transgenic plants with an incorporated transgene into the genome. The latter was called homology-dependent gene silencing. The inhibition of gene activity was reported at the transcriptional level (transcriptional gene silencing, TGS) (Matzke et al., 1989; Wassenegger et al., 1994) and at the posttranscriptional level (posttranscriptional gene silencing, PTGS) (Napoli, 1990; van der Krol, 1990). A process similar to PTGS called quelling was also
observed in the fungus Neurospora crassa (Romano et al., 1992). Also, two groups reported about regulation of translation by antisense RNA in the nematode worm Caenorhabditis
elegansin 1993 (Rosalind C. Lee et al., 1993; Wightman et al., 1993). A second example of a small regulatory RNA - the 21-nucleotide let-7 RNA was found in Caenorhabditis elegans (Reinhart et al., 2000)which was also present in other species was reported in 2000.
10
The immense potential of all these finding became evident after Andrew Fire and Craig Mello published their break-through study in 1998 (Fire et al., 1998) and a large number of small RNA molecules, called microRNAs (miRNAs), were revealed in 2001 (Lagos-Quintana et al., 2001; Lau et al., 2001; R C Lee et al., 2001).
Andrew Fire and Craig Mello studied the phenotypic effect of sense, antisense and annealed sense/antisense RNA introduced into the nematode worm Caenorhabditis elegans in their paper. They showed that only introduction of the annealed sense/antisense RNA could cause the predicted phenotype and led to an efficient degradation of the target mRNA. The main results of the paper can be summarized as follows (cited from (Daneholt, 2006):
First, silencing was triggered efficiently by injected double-stranded RNA (dsRNA), but weakly or not at all by sense or antisense single-stranded RNAs. Second, silencing was specific for an mRNA homologous to the dsRNA; other mRNAs were unaffected. Third, the dsRNA had to correspond to the mature mRNA sequence; neither intron nor promoter sequences triggered a response. This indicated a posttranscriptional, presumably cytoplasmic mechanism. Fourth, the targeted mRNA disappeared suggesting that it was degraded. Fifth, only a few dsRNA molecules per cell were sufficient to accomplish full silencing. This indicated that the dsRNA was amplified and/or acted catalytically rather than stoichiometrically. Sixth, the dsRNA effect could spread between tissues and even to the progeny, suggesting a transmission of the effect between cells. Furthermore, Fire and Mello made the remark that RNAi could provide an explanation for a phenomenon studied in plants for several years: posttranscriptional gene silencing (PTGS). Finally, they ended their paper by speculating about the possibility that "dsRNA could be used by the organism for physiological gene silencing".
Moreover, Fire provided evidences that dsRNAs target mRNA before translation and suggested that the RNAi mechanism could be a form of defense system to viral particles in lower organisms in his next paper published also in 1998 (Montgomery et al., 1998).
11
The presence of the RNAi mechanism was shown in other organisms, including fruit flies, trypanosomes, plants, planaria, hydra and zebrafish (Tuschl et al., 1999) very rapidly after these publications. However, specific dsRNA-mediated mRNA degradation by RNAi was not detected in commonly used mammalian cell cultures first. But later it was archived by introducing very short 21-nucleotide dsRNAs (Elbashir, Harborth, et al., 2001).
Next, it was shown that dsRNA is cleaved into 21-23 nucleotide long siRNAs (small interfering RNA) and it was proposed that these siRNAs work as guide to cleave mRNA (Zamore et al., 2000). The process was detected in vivo in Caenorhabditis elegans in 2000: it was observed that dsRNAs are cleaved into about 25-nucleotide RNAs and that antisense RNAs trigger specific dsRNA-mediated mRNA degradation via base-pairing to mRNA (Parrish et al., 2000).
Later it was demonstrated in Drosophila cells that a large protein complex called RISC (RNA-induced silencing complex) is guided to the mRNA by a short antisense RNA and after that mRNA is cleaved and degraded (Hammond et al., 2000). The protein complex RISC contained at least one member of the argonaute protein family and it was suggested that it acted as an endonuclease. It was also shown that a ribonuclease III-like nuclease, called Dicer, trimmed dsRNA to form short RNAs (Bernstein et al., 2001)(Summarized in figure 1-1).
Meanwhile RNAi pathway for miRNAs was also studied. It was found that in contrary to exogenous nature of siRNAs, most miRNA are transcribed from independent transcription units (Lagos-Quintana et al., 2001; Lau et al., 2001; R C Lee et al., 2001) or from the introns of pre-mRNAs (about a quarter of the human miRNA genes). miRNAs are transcribed into pri-miRNAs (Y. Lee et al., 2002), that are cleaved by a protein complex called Drosha/Pasha into miRNA precursor molecules called pre-miRNAs (Y. Lee et al., 2002; Zeng et al., 2003). pre-miRNAs as shRNAs are transported into the cytoplasm by a mechanism involving Ran-GTP protein and the export receptor Exportin-5 (Lund et al., 2004; Yi et al., 2003). pre-miRNAs as shRNAs are processed by the enzyme Dicer (Y. Lee et al., 2003) which cleaves shRNAs into mature siRNAs and pre-miRNAs into miRNAs. siRNA and miRNA single strands are incorporated into RISC complexes and guide the complex to target mRNAs (Elbashir, Lendeckel, et al., 2001; Elbashir, Martinez, et al., 2001; Hammond et al., 2000; Martinez et al., 2002). The fate of the targeted mRNA depends on the extent of sequence pairing and it
12
can be cleaved, destroyed or translation can be inhibited (Bartel, 2004) (Summarized in figure 1-1).
Figure 1-1. dsRNA and miRNA interference pathway. Reprinted with permission from (Sigoillot et al., 2011).
The importance of RNAi discovery is difficult to overestimate. One of the most significant consequences of the discovery was that the sequence specific action of RNAi immediately
13
suggested that it can be used to suppress specific genes and study the resulting phenotype. Initially it was used to silence individual genes of interest but the development of libraries for several organisms that contain synthesized sequence specific dsRNAs targeting most of the genes in the genome allowed to perform genome wide loss of function screening.
Different types of dsRNAs such as siRNAs, endoribonuclease-prepared siRNAs (esiRNAs) or siRNA precursors (such as short hairpin RNAs (shRNAs) or long double-stranded RNAs (dsRNAs) are used to perform screening. Typically, small interfering siRNAs or shRNA are used for mammalian cells (S. E. Mohr et al., 2014). Targeting non-coding RNA became also possible with development of libraries of reagents that inhibit or mimic microRNAs (S. E. Mohr et al., 2014).
The way RNAi reagents are introduced into the cells differ for different cell types and reagents: siRNAs or esiRNAs can be transfected into cells; shRNAs can be virally transduced into cells; dsRNAs in solution can be applied to D. melanogaster cells; dsRNAs (fruit fly or
Caenorhabditis elegans) or shRNAs (fruit fly or mice) can be expressed from transgenic
constructs; dsRNAs can be microinjected (Caenorhabditis elegans, fruit fly and some non-model insects); E. coli expressing dsRNAs can be fed to non-model organisms (Caenorhabditis
elegans or planaria) (S. E. Mohr et al., 2014).
Typical components of a genome wide RNAi loss of function screening are (as described by (Boutros et al., 2008):
Developing readout assay (primary screening assay) – this step includes designing a readout assay specific for the biological process of interest, choosing positive and negative controls “to achieve high signal with the positive controls and low noise with the negative controls” and developing scoring strategy which can be either qualitative or quantitative. The readout assay for genome wide screening is often a compromise between specificity and feasibility. As examples of readout assay, one could mention simple visual assays of morphological changes, changes in the expression of GFP reporters, or imaging assays for cell culture-based screens which capture an image of each well and then each individual cell is scored with several phenotypic descriptors.
14 The pilot screening – this step includes a small-scale screening of a few hundred random genes, positive and negative controls. The pilot screen is needed to adjust RNAi reagents doses, incubation times, other experimental variables; to optimize readout assay responses to negative and positive control reagents; to assess the feasibility to perform the screen on a large scale (Sharma et al., 2009).
The genome-wide screening – this step includes genome-wide screening which is usually conducted in duplicates or more with several non-overlapping RNAi reagents per gene. This helps to avoid false positives caused by off-target effects and to increase confidence in true positives.
A cell-culture based RNAi screening is typically performed in either arrayed or pooled format. The library is randomly introduced into cells in the pooled format screening such that any given cell will contain approximately one gene-specific RNAi reagent. A library containing viral-encoded shRNAs is typically used for mammalian cells. Then the cells can be selected for presenting a certain feature (e.g. resistance to some treatment, being positive in the assay). The polymerase chain reaction (PCR) is used to amplify RNAi reagent present in the selected cells and sequencing is used to determine the RNAi reagents. The presence of the RNAi reagent after selection suggests the corresponding gene is a hit (S. Mohr et al., 2010).
Another option to perform selection is to use several subsets of cells or even different cell types that can be treated differently to create a “reference set” and one or more
“experimental sets” (S. Mohr et al., 2010). It can be done before or after introducing RNAi library into the cells depending in the readout assay. PCR amplification and microarray analysis or sequencing are used then to detect which RNAi reagents are present in each set (e.g. using molecular “barcode”). This gives the information about which RNAi reagents are present and which quantities in the experimental and reference sets (S. Mohr et al., 2010).
In contrary to the pooled format, each gene is targeted separately by RNAi reagents in individual wells of a microtiter plate (that contain e.g. 96 or 384 wells) in arrayed format. The readout assays are usually use colorimetric, fluorescence, or luminescent measurements
15
at the well level or fluorescent measurements at the cellular or subcellular level using imaging (S. Mohr et al., 2010). Genome scale RNAi arrayed screenings use automated equipment for liquid handling and readout assays.
Secondary validation – this step includes secondary screening which validates positives from the genome-wide screening. This can be archived by using multiple RNAi reagents distinct from the genome-wide screening, improving specificity of the readout assay, developing a readout assay for testing for nonspecificity, using different biological system or using RNAi independent techniques.
Data analysis – this step includes raw data analysis from the genome-wide screening and secondary validation. The pipeline is specific to the screening and readout assay
technologies, but typically includes data preprocessing, quality control, removal of spatial biases per plate and normalization between plates for arrayed format, microarray or sequencing analysis for pooled format, creating a ranked list of genes with experimental measurements and detection of statistically significant hits. Software packages such as cellHTS (Boutros et al., 2006), RNAither (Rieber et al., 2009), CARD (Dutta et al., 2016), shALIGN and shRNAseq (Sims et al., 2011), edgeR (Y. Chen et al., 2015) which implement the pipeline are available.
One important point should be mentioned about RNAi loss-of-function screening. Soon after completion of the first wide RNAi screenings, it became evident that many genome-wide RNAi screenings hits were false positives due to off-target effects (OTEs) (Birmingham et al., 2006; Jackson et al., 2003; S. Mohr et al., 2010). These OTEs can be grouped into two main categories: sequence-independent off-target effects and sequence-specific off-target effects (Sigoillot et al., 2011). The main causes sequence-independent off-target effects are (1) shRNAs can interfere with processing mechanism for microRNAs (Grimm et al., 2006); (2) siRNAs can displace microRNAs from RISC complex (Khan et al., 2009); (3) non-specific immune response can be induced after introduction of synthetic RNAi reagents (Bridge et al., 2003; Sledz et al., 2003); (4) high concentration of siRNAs can induce cell-stress response (Persengiev et al., 2004; Semizarov et al., 2003). The main cause of sequence-specific off-target effects is the potential of each individual RNAi reagent to act like a miRNA and to
16
downregulate the expression of several genes, when besides inducing the cleavage of the target mRNA with perfect base-pairing, the RNAi reagent can act as miRNA by interacting with target mRNA with incomplete base-pairing inside a short seed region (Carthew, Richard W. and Sontheimer, 2009; Doench et al., 2003). Several computational and experimental approaches were developed to address this issue, including computational prediction of potential OTEs using seed sequence alignments (e.g. Genome-wide Enrichment of Seed Sequence matches (GESS) (Sigoillot et al., 2012); designing RNAi reagents that will result in fewer OTEs (e.g. using as control altered RNAi reagent sequence to prevent perfect
complementarity (Buehler et al., 2012); using multiple RNAi reagents with different sequence per gene (Bassik et al., 2009; S. E. Mohr et al., 2014).
17 CRISPR/Cas9-based loss-of-function screening
CRISPR/Cas system is bacteria and archaea adaptive immunity mechanism (Jinek et al., 2012). The first description of repeat structures that would later be called CRISPR was published in 1987 by a group of Japanese scientists from Osaka university who cloned by accident iap gene from the E. Coli genome with a part of CRISPR locus. These repeats
consisted of a series of 29-nucleotide repeated sequence separated by unique 32-nucleotide ‘spacer’ sequences (Ishino et al., 1987), however its function was not known at that time. A group from Netherlands published two papers about similar repeat clusters in
Mycobacterium tuberculosis genome in 1993 (Groenen et al., 1993; Van Soolingen et al.,
1993). A cluster of interrupted direct repeats (DR) was found and the diversity of the DR-intervening spacers was studied in different strains of Mycobacterium tuberculosis in these
papers. At the same time in 1993, similar repeated structures were observed by researchers from Spain in archaeal microbe Haloferax mediterranei (F. J.M. Mojica et al., 1993) and first hypotheses for the function of these structures were proposed (it was proposed that these repeats could have a role in partitioning of the replicated DNA) (F. J M Mojica et al., 1995).
Similar repeat clusters were recognized using bioinformatics methods in many genomes of Archaea and Bacteria in 2000 and 2002 and were named clustered regularly interspaced palindromic repeats (CRISPR) (Jansen et al., 2002; F. J M Mojica et al., 2000). It was also reported that CRISPR was accompanied by a set of homologous genes that were called cas genes (CRISPR-associated systems) (Jansen et al., 2002). Helicase and nuclease motifs were
identified in the Cas proteins what suggested that these proteins might be involved into organizing the structure of the CRISPR loci (Jansen et al., 2002). Three independent groups showed that some CRISPR spacers matched phage and extrachromosomal DNA in 2005 (Bolotin et al., 2005; F. J M Mojica et al., 2005; Pourcel et al., 2005) which suggested that CRISPR loci encoded an adaptive immune system mechanism to protect bacteria and archaea. The first experimental evidence that proofed this suggestion was published in 2007 (Barrangou et al., 2007). It was shown that the CRISPR loci of the phage resistance strains of Streptococcus thermophilus contained phage-derived sequences. The number of acquired spacers correlated with the increased resistance. It was also shown that bacteria
18
needed Cas7 protein to gain phage resistance suggesting that Cas7 was important for spacer acquisition. On the other hand, Cas9 protein was necessary for preventing phage infection.
Later, it was observed that a complex of Cas proteins cleaved CRISPR RNA that is transcribed from the CRISPR locus into spacer-containing RNA molecules (crRNA) (Brouns et al., 2008). In the same year, it was also observed that CRISPR targeted DNA rather than RNA to prevent conjugation in Staphylococcus epidermidis (Marraffini et al., 2008) which was confirmed two years later by a study that gave direct experimental evidences that CRISPR-Cas system cleaves both strands of plasmid DNA in S. thermophiles (Garneau et al., 2010). The latter study also showed that the Cas9 nuclease cuts DNA at sequence specific positions encoded by crRNAs. Two more years later, Jinek et al. (Jinek et al., 2012) reported that the core CRISPR/Cas mechanism in S. pyogenes is based on a dual-RNA structure that consists of trans-activating crRNA (tracrRNA) and precursor crRNA hybridized together. This hybrid guides Cas9 endonuclease to introduce sequence specific double-stranded breaks in target DNA.
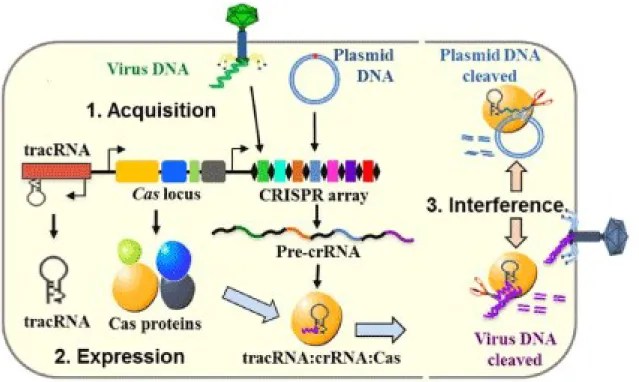
Nowadays the CRISPR defense system mechanism is divided into three stages (Makarova et al., 2011) (Figure 1-2):
1) Acquisition/adaptation stage – during this stage viral DNA is captured and is inserted into the CRISPR locus in a form of spacers. Two Cas proteins, Cas1 and Cas2, are observed in most of types of CRISPR-Cas systems (classification of CRISPR-Cas systems see below) and responsible for spacer acquisition.
2) Expression/processing stage – during this stage CRISPR is transcribed into long precursor CRISPR RNA (pre-crRNA) which is then processed into mature crRNA with the help of Cas proteins and other factors depending on the type of CRISPR-Cas system.
3) Interference stage – during this stage Cas protein(s) guided by crRNA destroy target nucleic acid.
19
Figure 1-2. Three stages of CRISPR-Cas immunity mechanism. Adapted from (Yongmin Yan, 2013).
It is known that ~40% of sequenced bacterial genomes and ~90% of sequenced archaeal genomes contain at least one CRISPR locus encoding CRISPR/Cas system (Grissa et al., 2007). The current formal classification (Makarova et al., 2015) distinguishes two classes – Class I and Class II mostly defined by different sets of cas genes present in CRISPR locus. Class I comprises types I, III and IV systems. Class II comprises types II, V systems. Several types of CRISPR/Cas system can be present in a genome.
Class 1 CRISPR–Cas systems are defined by the presence of a multiprotein crRNA effector complex. The class includes type I, type III and type IV CRISPR–Cas systems.
Type I and type III CRISPR-Cas systems are distinguished by the presence of the signature genes cas3 and cas10 respectively. The multiprotein crRNA effector complexes mediate the processing and interference stages of the CRISPR defense system (Makarova et al., 2015). In
20
type I systems, this complex is known as the CRISPR-associated complex for antiviral defense (Cascade) complex. In type III-A and type III-B systems the complexes are known as Csm and Cmr complexes respectively (Makarova et al., 2015). Type IV systems are rare and lack proteins responsible for adaptation stage.
Class 2 CRISPR–Cas systems are defined by the presence of a single subunit crRNA effector complex. This class includes type II and V CRISPR–Cas systems.
Type II CRISPR-Cas system is distinguished by the presence of cas9 gene which combines the functions of the crRNA–effector complex and is the only protein that is required to perform DNA cleavage. Cas9 protein is also takes part in spacer adaptation and in processing of pre-crRNA. Besides pre-crRNA, another RNA known as tracrRNA is transcribed from the repeat region of CRISPR locus.tracrRNA forms dsRNA with pre-crRNA in the repeat region via base-pairing. The dsRNA is targeted by the housekeeping dsRNA- specific ribonuclease RNase III but not Cas protein in the presence of the Cas9 protein to produce crRNAs (Hale et al., 2009).
Type V CRISPR-Cas system is distinguished by the presence of cas12 gene which combines the functions of the crRNA–effector complex. This type did not require the additional tracrRNA for target cleavage unlike type II (Koonin et al., 2017).
After Marraffini and Sontheimer’s 2008 paper that showed that CRISPR targeted and cut DNA in crRNA guided manner, big work devoted to adaptation of the mechanism to cutting, and as result, editing specific genomic loci had started, at the same time with continuation of investigation of basic biology of CRISPR-Cas defense system mechanism.
Two molecular techniques were mainly in use to edit eukaryotic DNA in a sequence specific manner within the cell at that time: zinc finger nucleases (ZFNs) and transcription activator– like effector nucleases (TALENs) by 2008. Zinc finger nuclease is an artificial fusion of DNA-binding domain of eukaryotic transcription factors (zinc finger proteins, which consist of several zinc finger motifs each recognizing approximately 3 bp of DNA) with a DNA-cleavage domain of the FokI restriction enzyme (Urnov et al., 2010). Transcription
21
activator-like effectors (TALE) proteins (these proteins contain nearly identical 34-amino-acid repeats with only two variable amino 34-amino-acids per repeat, each repeat recognize a single base pair in target DNA) (Boch, 2011) from the pathogenic bacterium Xanthomonaswith a DNA-cleavage domain of the FokI restriction enzyme.
These sequence-specific nucleases introduce double stranded breaks in the DNA and promotes primarily either homology-directed repair (HDR) pathway in the presence of a template DNA that contain the mutation of interest, thereby archiving site specific
mutagenesis, ornon-homologous end-joining (NHEJ) pathway without a template DNA to disrupt a target gene. The latter pathway is an error-prone repair mechanism that can introduce short indel mutations at repair sites which cause a coding frameshift, resulting in a premature stop codon, as well as an early frameshift mutation or large indels resulting in a non-functional protein (Shalem et al., 2015).
Both approaches require engineering of new proteins for each target sequence which is hardly feasible for large scale experiments. On the other hand, type II CRISPR/Cas system required only short crRNA: tracrRNA hybrid and Cas9 protein to introduce sequence-specific double stranded breaks and it would provide a versatile tool for cutting/editing of DNA if it could be made to work in mammalian cells. It took several years to make it work. The first papers reporting that CRISPR/Cas9 system from Streptococcus pyogenes engineered in zebrafish embryos, human and mouse cells can induce targeted genetic modifications via NHEJ or HDR-mediated pathways appeared in 2013 (Cong et al., 2013; Hwang et al., 2013; Mali et al., 2013). Since these initials studies, many laboratories used CRISPR/Cas9 system for genome editing applications including developing and construction of targeting reagents for functional screenings.
The field of functional screenings using CRISPR/Cas9 reagents is rapidly developing. According to literature, the screening methodology consists of several steps (Miles et al., 2016; Shalem et al., 2015):
22
CRISPR knockout libraries are the most common libraries for CRISPR/Cas9 functional screenings. They are available as pooled plasmid libraries (see screening format section below), containing either two separate plasmids for cas9 and sgRNA or a single plasmid with both cas9 and sgRNA. Genome-wide knockout libraries contained sgRNAs targeting over 18 000 genes and about 1000 miRNAs by 2016.
CRISPR-based interference (CRISPRi) libraries contain sgRNAs with catalytically dead Cas9 (dCas9) protein that does not cause permanent DNA modification but repress transcription via blocking RNA polymerase or via effector domain if fused with repressive effector domain like Kruppel-associated box (KRAB).
CRISPR gene activation (CRISPRa) libraries also contain sgRNAs with dCas9, but this time dCas9 is fused with activation domain proteins (Maeder et al., 2014; Perez-Pinera et al., 2013), causing an increase in gene expression level.
Choosing cell line
The main considerations for choosing a cell line for CRISPR/Cas9 functional screening are ploidy (or more precisely gene copy number) and state of the DNA repair pathways. The first one is important because complete gene knockout is easier to archive when there are few gene copies in the genome. The latter is important because if both HDR and NHEJ pathways are active in the cell line, the DSB can be repaired via HDR using sister chromatid as a template, so the probability of a complete gene knockout is lower than for cell lines with defective HDR.
Choosing screening format
In general, both arrayed and pooled screening formats can be used for CRISPR/Cas9 functional screening. However, all 84 high-throughput screenings performed in human cell lines submitted to GenomeCRISPR database by October 2016 were pooled screenings (Rauscher et al., 2016). One possible explanation for this is that pooled format screenings are less expensive and labor intensive; moreover, screening reagents for pooled formats are easier to produce (Shalem et al., 2015). However as mentioned for RNAi screenings, pooled
23
formats are limited to simple phenotype readout assays (as cell proliferation or survival) (Shalem et al., 2015).
The selection of the cells is performed after viral delivery in pooled screening. The goal of positive selection is to leave after selection only cells with survival-enhancing perturbation. The goal of the negative selection is to leave after selection only cells that could survive despite the perturbation.
The DNA is extracted, and PCR amplification is used to prepare samples for sequencing after selection.
Data analysis
The data analysis includes sequencing data processing, quality control, quantification of representation of each sgRNA, determination of the statistical significance of the changes in sgRNA representation and hit selection (Miles et al., 2016). The publicly available tools like edgeR (Y. Chen et al., 2015) or MAGeCK (Li et al., 2014) can be used to perform each step.
Validation
The goal of validation is to separate true positive hits from false positive screens. This can be done in a manner similar to RNAi screenings (secondary screening, orthogonal assay), however additional validation that the target gene was modified by Cas9 dependent DSB (for knockout libraries) or that transcription level changed due CRISPRi/CRISPRa methods should be performed.
24 Transcriptome profiling
Transcriptome profiling allows to study a cellular system at the transcriptome level. Transcriptome is the set of all RNA molecules in a particular cell. The most widespread techniques for transcriptome profiling are DNA microarrays and RNA-seq techniques (Lowe et al., 2017).
DNA microarray consists of a solid surface with thousands of microscopic spots attached to it. These spots contain probes, short specific (usually 25-60bp) DNA sequences, to which target fluorescently labeled complementary DNA (cDNA) hybridize via complementary base pairing between two DNA strands. Higher number of complementary bases means stronger bond between strands, that can stand washing step, when weaker non-specific bonding sequences are removed. The fluorescent label of cDNA generates signal for each spot. The strength of the signal depends on the amount of the cDNA bound to the probes. Comparing the strength of the signals from the same spot in two different conditions (e.g. control and experiment) microarrays allow to quantify relative changes in expression levels.
The two main types DNA microarrays from manufacturing point of view are spotted and in-situ microarrays. The probes for spotted microarrays are synthesized and stored in wells before placing on the array (DeRisi et al., 1996). Then they are placed at certain location using a robotic arm and spotting pins. This manufacturing technique allows to produce “in house” microarrays that can be highly customizable, since the set of probes can be specified for a particular experiment. On the other hand for in-situ DNA microarrays, probes are synthesized directly on the array surface, using for example photolithographic synthesis technique (Fodor et al., 1991). This technique relies on light-sensitive masking agents and one nucleotide is added at a time to applicable probes over the whole array. The applicable probes are unmasked using UV light allowing attachment of nucleotide from a solution of a single nucleotide.
DNA microarrays can be used for two-channel or one-channel detection. Two-channel microarrays can be hybridized with two samples simultaneously (e.g. control and experiment). The samples are labeled with two different fluorescent dyes which has
25
different fluorescence emission wavelengths. The microarray scanner excites the dyes with specific wavelengths and quantifies the relative intensities. The one-channel microarray can be hybridized with only one sample, so comparison between two samples requires two separate hybridizations.
A typical workflow of a DNA microarray experiment for measuring expression changes is:
1) Sample preparation. This step includes acquiring samples, extraction of the RNA, generating cDNA via reverse transcription, PCR amplification, labelling with fluorescent dye and mixing with hybridization solution.
2) Hybridization and washes. This step includes adding the mixture to the array, hybridization, washing away non-specific bonding sequences and drying. 3) Scanning. This step includes scanning the array with laser beam that excite
fluorescent dye and quantifying the intensities of each spot.
4) Data analysis. This step includes normalization, quality control, filtering (spots with low intensity, noisy replicates, missing values) and statistical analysis. This can be done either by creating custom data analysis pipeline (e.g. using
BioConductor (Gentleman et al., 2004) packages as affy (Gautier et al.,
2004), affyPLM) or using integrated tools such as EXPANDER (Shamir et al., 2005) or Affymetrix Power Tools (APT).
RNA-seq refers to the combination of a high-throughput sequencing techniques with computational methods to measure the presence of transcripts in an RNA extract (Lowe et al., 2017).
A typical workflow of a RNA-seq experiment for measuring expression changes is:
1) Library preparation. During this step RNA is isolated from the cells. The isolated can be filtered to include only mRNA or ribosomal RNA (rRNA) can be depleted. The RNA
26
is converted to cDNA using reverse transcription and each fragment can also be amplified.
2) Sequencing. During this step the fragments are sequenced.
3) Data analysis. This step includes quality control of the raw sequences, alignment to reference genome (if known) or de novo assembly (if reference genome is unknown), quantification of transcripts expression and differential analysis between samples. These steps can be performed using such software tools as RNA workbench (Grüning et al., 2017) or RNA-seq workflow in Bioconductor (Love et al., 2015)
27
Computational analysis of functional genomics data
The result of functional genomics experiment is usually used either as a ranked list of biological components (genes, mRNAs, ..) where each gene is associated with an
experimental score and a p-value or as a ‘hit list’ which contains only biological components with scores and p-values list with the scores resp. p-values that are above resp. below a certain threshold level. Numerous computational methods to interpret functional screening data and infer molecular machinery underlying the given phenotype can be grouped into two categories. The most widespread approaches can be grouped into two categories.
The first category is the pathway analysis methods that identify which canonical pathways or annotated gene sets are over- or underrepresented in a ranked list or a hit list. According to (Khatri et al., 2012), three generations of the pathway analysis approaches can be
distinguished.
The first generation is over representation analysis (ORA) approaches which can be still considered as the gold standard approach for analysis of results of functional screenings. Typically, such methods include the following steps:
1) counting number of genes in the input list that belong to each pathway; 2) testing each pathway for over- or underrepresentation in the input list using
statistical test such as hypergeometric, Fisher’s exact, chi-square, or binomial tests.
The major limitations of such approaches are:
1) treating each gene in the input list equally, disregarding the experimental measurements;
2) using typically only hit list, disregarding other genes in the ranked list; 3) disregarding possible dependency between genes;
28
Some examples of methods that implement this approach are ClueGO (Bindea et al., 2009), GOstat (Beißbarth et al., 2004), Enrichr (Kuleshov et al., 2016), David (Huang et al., 2009) and iGA (Breitling et al., 2004) tools.
ClueGO (Bindea et al., 2009) is a Cytoscape (Shannon et al., 2003) plugin which facilitates visualization, annotation, creation annotation networks and performing over representation analysis. It uses one- or two-sided tests based on the hypergeometric distribution and Gene Ontology(GO) terms as well as KEGG and BioCarta pathways databases as annotated gene sets.
Enrichr, David, GOstat are web based tools that uses either Fisher’s exact test or chi-square tests to test overrepresentation.
Iterative Group Analysis (iGA) (Breitling et al., 2004) tool addresses the problem of using only the hit genes and disregarding others by using iterative approach. The tool uses ranked input list, assigns each gene to a class, e.g. based on GO term and determines the probability of change of each class by adding a gene at a time and finding the minimum probability to observe this many members of the class in the top of the list by chance [].
The second generation is Functional Class Scoring (FCS) approaches which aim at detecting coordinated impact of genes on a pathway. Typically, such methods include the following steps:
1) computing single pathway-level statistics using gene level statistics such as the Kolmogorov-Smirnov statistics, sum, mean of gene-level statistic;
2) testing the significance of the pathway-level statistics e.g. using phenotype or pathway permutation.
These approaches address the following limitations of the ORA approaches:
1) use experimental measurements;
2) use information from the whole ranked list;
29
The major limitations of such approaches are:
1) treat each pathway independently;
2) usually consider only ranking but not exact values of experimental measurements.
Examples: GSEA (Subramanian et al., 2005), Enrichr (Kuleshov et al., 2016) tools.
Gene Set Enrichment Analysis (GSEA) is the first and one of the most popular tool implementing FSC approach. GSEA tool takes as an input a ranked list of genes and
determines whether the members of a canonical pathway (or any other annotated gene set) are randomly distributed throughout the input list or mainly found in the top of the input list (Subramanian et al., 2005).
The three main steps of GSEA according to (Subramanian et al., 2005) are:
1) Calculation of an Enrichment Score (ES) for a pathway (or any other annotated gene set). This is done by starting in the top of the input list, moving down in the list increasing the running sum statistics if current gene belong to the pathway and decreasing otherwise. The increment is weighted using experimental measurements. ES is calculated as maximum of the sum across all genes in the input genes and it corresponds to a weighted Kolmogorov–Smirnov-like statistic.
2) Testing the significance of ES is done by permuting phenotype labels in the input list, calculating ES for permuted data and constructing distribution for ES. The p-value for the ES from step 1 is calculated using this distribution.
3) Adjusting p-value from step 3 for multiple hypothesis testing (if many canonical pathways are tested). This is done by normalizing each ES by the size of the pathway and computing permutation based False Discovery Rates (FDR).
Enrichr (Kuleshov et al., 2016) is another popular tool. Enrichr contains 125 frequently updated gene set libraries (divided into categories: transcription, pathways, ontologies, diseases/drugs, cell types and miscellaneous) and implements ORA using Fisher exact test as well as FSC method. The latter method takes as an input list of genes with coefficients from 0 to 1 that represent ‘the grade of membership’. The ‘grade of membership’ for a gene set is
30
defined as a sum of ‘gene grades’ and the statistical significance is calculated using
hypergeometric distribution.
The third generation is Pathway Topology (PT) approaches. It is difficult to generalize about this category, but essentially, these approaches perform the same steps as FCS approaches, however for computing pathway level statistics they utilize not only experimental
measurements but also topological information about pathways:
1) computing single pathway-level statistics using gene level statistics calculated using experimental measurements and topological information about pathways and/or molecular interactions information;
2) testing the significance of the pathway-level statistics.
The major limitations of such approaches are:
1) dependency on the pathway topology information which can be incomplete.
Examples: SPIA (Tarca et al., 2009), EnrichNet (Glaab et al., 2012).
Signaling pathway impact analysis (SPIA) method was proposed in 2009 by (Tarca et al., 2009). The method assesses the pathway significance using information from both standard over representation analysis and from possible abnormal perturbation of the pathway measured using expression changes of every gene in the pathway (the method was suggested for the analysis of transcriptome profiling data). To be able to quantify
perturbation of the pathway, the authors first introduce a gene perturbation factor, which is calculated as a sum of the expression change of the gene and a normalized and weighted sum of perturbation factors of the upstream genes in the pathway, where the weights quantify the strength of the interactions in the pathway if such information is available. Next, the author introduced the net perturbation accumulation of every gene which is the perturbation factor minus expression change, and total net perturbation accumulation of entire pathway as a sum of net perturbation accumulation of every gene. Then, the p-value of getting a total perturbation accumulation of a pathway higher than given is calculated by permuting gene IDs in the pathway and constructing the null distribution. The total p-value
31
for a pathway is calculated as a probability to observe value from the standard ORA and p-value for perturbation accumulation as low as for a given pathway.
EnrichNet method was proposed in 2012 by (Glaab et al., 2012). The method takes a list of genes, annotated gene sets (e.g. canonical pathways) and a network of molecular
interactions as input data. The method calculates the scores associated with the distance between the list of genes and annotated gene sets using a random walk with restart
algorithm (RWR) and compares these scores with a background model. A random walk with restart algorithm enables to estimate the proximity of two nodes when each following step of the walk starting from a seed node on a graph is chosen randomly and the walk can be restarted with a certain probability. The authors argue that such distance measure better capture possible relationships between two nodes than for example the shortest path distance. Each annotated gene set is assigned a vector where each position is a RWR score from randomly chosen input gene to a gene in the pathway. Then, the deviation of these vectors from a background model, which is defined as “average distribution across all pathways” is assessed.
The second category of computational approaches for analysis and interpretation of the functional screening data is network analysis methods which usually use protein-protein interaction networks as complementary information. These methods aim at improving hit identification, finding functionally related biological components, finding significantly enriched/maximum weight subnetworks using ranked list or hit list. This is usually done by introducing network-based scoring methods that use network topology information and screening results. Below are examples.
(L. Wang et al., 2009) suggested a method implementing "guilt by association" principle and NePhe scoring system to address the problem of false positives and false negatives
associated with RNAi screenings. The "guilt by association" principle was used in the sense that if a gene has many connections with other hit genes, then it is a true positive if it is a hit and false negative if it is not hit, and vice versa. The quantification of the connectedness between two genes was done using either direct neighbor information or the shortest path distance or diffusion kernels or association analysis-based transformations.
32
(Kaplow et al., 2009) suggested RNAiCut method to identify thresholds for ranked functional screening data by using connectivity of subgraphs of protein-protein interaction networks. The main hypothesis of the method is that true positive hits are densely interconnected in the protein-protein interactions networks (Kaplow et al., 2009). The method ranks the screening data and for each set of first k genes in the ranked list it computes the number of edges (connectivity) in the subgraph retrieved from PPI network. Then, the method estimates the p-value of getting such connectivity if the subnetwork was constructed of random nodes conserving the degree distribution. The number of genes k associated with the lowest p-value is used as the threshold.
(S. Ma et al., 2014) suggested NEST (Network Essentiality Scoring Tool) to assess gene essentiality and improve the quality of loss-of-function screening. The NEST score is calculated as a sum of expression values or scores from loss of function screenings
information of neighbor genes in molecular network weighted by the interaction confidence. The authors showed the NEST scores are significantly higher for essential genes.
(Cornish et al., 2014) suggested a method called SANTA that also uses “guilt by association” principle to quantify association between a gene list and a network (including functionally annotates molecular networks). The authors introduced Knet and Knode scores that use adapted Ripley's K-Function for networks to measure network scores (Knet) and network-based nodes scores (Knode). The Knet scores assess quantity and strength of hits located in the proximity of each other in the network. This score can help to measure functional
association of gene list with functionally annotates molecular networks. The Knode score quantify each node’s neighborhood for strong and close hits. By extracting nodes with the highest Knode score, significantly enriched for hits subnetworks can be identified.
(Kairov et al., 2012) suggested a method called OFTEN (Optimally Functionally Enriched Network) implemented in BiNoM (Bonnet et al., 2013) Cyroscape (Shannon et al., 2003) plugin to associate a ranked gene list with PPI subnetwork. The method aims at finding the largest connected component of a subnetwork formed by optimal number of top-ranked genes in the input list. The optimal number is identified by finding the number of top-ranked genes after which the percolation score rapidly goes down. The percolation score computes
33
using the size of the largest connected component of a subnetwork, the number of genes that were used to extract subnetwork and the mean value of the size of the largest connected component formed by randomly selected genes.
(Beisser et al., 2010) and (Dittrich et al., 2008) suggested a method called BioNet for finding maximum-weight connected subgraph which represent active subnetwork in the network. The method first annotates each gene with experimentally derived values. Then, these p-values are aggregated into one number (if several experimental conditions were tested simultaneously). The scoring function model both the signal and the noise component of the p-value using a beta-uniform mixture model, controlling false discovery rate. Then, the maximum-weight connected subgraph is found using linear programming algorithm.
Several other methods besides OFTEN and BioNet exist for finding active subnetworks. These are : jActiveModules (Ideker et al., 2002), ClustEx (Gu et al., 2010), PinnacleZ (Chuang et al., 2007), kwalk (Zheng et al., 2009), WMAXC (Amgalan et al., 2014), BMRF (L. Chen et al., 2013), COSINE (H. Ma et al., 2011). These methods as well as BioNet share the general idea: first, to introduce a subnetwork scoring function; then, to introduce an algorithm to find subnetwork with maximum or close to maximum score.
A completely different method one should mention is CausalR suggested by (Bradley et al., 2017) and (Chindelevitch et al., 2012). This method works with a network that consists of casual interactions that show the effect of the interaction between two proteins (inhibition or activation). It takes as starting points each gene (and indication whether it is up- or downregulated or there is no change) in a list of genes and finds points of convergence (usually upstream regulators) in the network that can explain the differential expression pattern seen in the starting points.
As for limitations, both pathway analysis and network analysis approaches have several general limitations. Firstly, pathway and network information can be incomplete and inaccurate. Secondly, both approaches do not give much information about the genes that are not included into pathways or networks. Lastly, networks are biased towards well studied genes.
34
2 Network analysis of functional genomics screening data
Some parts of this section are verbatim copy of two research papers being prepared for publication. One of them describes masterPATH method and its application to the analysis of the results of miRNA loss-of-function screening and transcriptomic profiling of terminal muscle differentiation and of ‘druggable’ loss-of-function screening of the DNA repair process; the other one is devoted to the study of the shortest path approach on the human interactome.
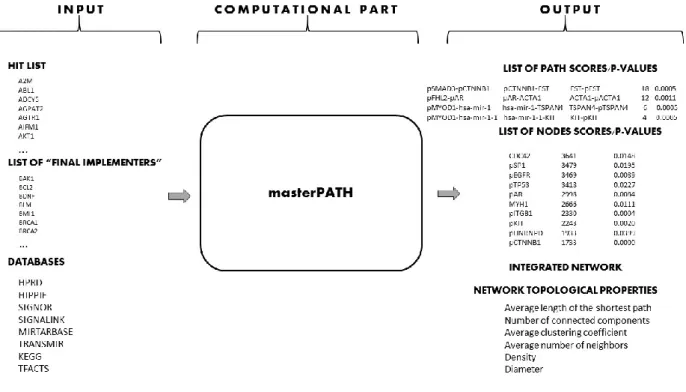
Here a new network analysis method to analyze functional genomics screening data – masterPATH – is presented. The method aims at elucidating members of molecular
pathways leading to the studied phenotype using functional genomics experiments data in the hit list form. The method works on an integrated network that represent human interactome. The method constructs the integrated network from 8 databases: HPRD (Peri et al., 2003), HIPPIE(Schaefer et al., 2012), Signor (Surdo et al., 2017), SignaLink (Fazekas et al., 2013), tFacts (Essaghir et al., 2010), KEGG Metabolic Pathways (Ogata et al., 1999), transMir (J. Wang et al., 2009), mirTarBase (Hsu et al., 2011); and calculates basic topological properties. The method extracts subnetwork built from the shortest paths of 4 different types (with only protein-protein interactions, with at least one transcription interaction, with at least miRNA-mRNA interaction, with at least one metabolic interaction) between hit genes to so called “final implementers” - genes that are involved in molecular events responsible for final phenotypical realization (if known) or between hit genes (if “final implementers” are not known). The method calculates centrality score for each node and each linear path in the subnetwork as a number of the shortest paths found in the previous step that pass through the node and the linear path. Then, the statistical significance (p-valuenet) of each centrality score is assessed by comparing it with centrality scores in subnetworks built from the shortest paths for randomly sampled hit lists (summarized in Figure 3-1). It is hypothesized that the nodes and the linear paths with statistically significant centrality score can be considered as putative members of molecular pathways leading to the studied phenotype. In case the experimental scores and p-values are available for a large number of nodes in the network, the method can also calculate experiment-based scores
35
(scoreexp) and experiment-based p-values (p-valuesexp) for the shortest paths or linear paths. The scoreexp is calculated as an average of the experimental scores of the nodes in the path. The p-valueexp is calculating by aggregation of the p-values of the nodes in the path using Fisher’s combined probability test and permutation approach.
The method is illustrated by analyzing the results of miRNA loss-of-function screening and transcriptomic profiling of terminal muscle differentiation and of ‘druggable’ loss-of-function screening of the DNA repair process. It is shown that known and new potentially interesting components for both biological systems are identified by the method.
Figure 2-1. Overview of masterPATH.
masterPATH algorithm
The following notions are used in the mechanistic model of pathway construction: an unweighted graph G=(V, E) represents a network of molecular interactions, where V are nodes that can be proteins, genes, small molecules or miRNAs; E are edges represent
36
of size n is as a set H = {hi : hi ∈ V for ∀ i ∈ [1..n]}. List of “final implementers” of size m as a
set F = {fi : fi ∈ V for ∀ I ∈ [1..m]}. A simple linear paths p between a pair of nodes (v,u) : v,u
∈ V is as set of pairs of nodes that represent existing edge in the graph G: p(v,u)= (v,v1),(v1,v2)
... (vn,u) where vi ∈ V for ∀ i and each node vi is distinct. Length L of the path p(v,u) is the
number of edges in the path p. We distinguish 4 different types of paths:
• protein-protein paths if all edges represent protein-protein interactions;
• transcriptional paths if there exist at least one edge that represent transcriptional interaction;
• miRNA paths if there exist at least one edge that represent miRNA-mRNA interaction; • metabolic paths if there exist at least one edge that represent enzymatic reaction. The algorithm of the method is the following. For a given network G, hit list H, list of “final implementers” F the method finds for each pair of hit gene and “final implementer” (hi, fj) all
the shortest paths {pi} of four abovementioned types of length less or equal the maximum
length Lmax (defined by the user) in the network G. The search is done using breadth-first
algorithm. Then the centrality score which resembles centrality score c is calculated for each node v and each path q (of length of several interactions) as a number of the shortest paths from {pi} that pass through the node v and the path q : c(v)= |p ∈ {pi}: v ∈ p| ; c(q) = |p ∈
{pi}: q ∈ p| . After that, the statistical significance of each score is assessed. 10000 random
hit lists are sampled from the set of nodes N preserving or not preserving the degree distribution of the initial hit lit. The probability (p-valueNet) of getting a node v or a path q with specific centrality score by chance is calculated as a proportion of sampled hit lists for which a node or a short path has the same or greater centrality score.
In case the experimental scores and p-values are available for the large number of nodes in the network G, experimental scores (scoreexp) and p-values (p-valueexp) can also be
calculated for the shortest path p, a path q, a node v. The scoreexp is calculatedas an average of the absolute values of the experimental scores of the nodes in a path for a shortest path
37
p-valueexp of the shortest path p and a path q is aggregated using Fisher’s combined probability test. The path is considered as a set of unique nodes. First, the test statistic 𝑋𝑒𝑥𝑝 = −2 ∑𝑚 log 𝑝𝑖
𝑖=1 is calculated for a path, where 𝑝𝑖 is an experimental p-value of a node 𝑖. Then, a permutation test is used to assess the p-value of the 𝑋𝑒𝑥𝑝 (p-valueexp): the set of experimental p-values is shuffled many times (e.g. 1000), the test statistic 𝑋𝑝𝑒𝑟𝑚is calculated for each shuffled sample, the p-value of the 𝑋𝑒𝑥𝑝 is calculated as a proportion of samples for which 𝑋𝑝𝑒𝑟𝑚 is at lease the same as 𝑋𝑒𝑥𝑝. The p-valueexp a node v equal to the
experimental p-value. The nodes without experimental values are not taken into account.
Databases
The following databases were used to construct integrated network: HIPPIE, Signor, SignaLink, tFacts, KEGG Metabolic pathways, transMir, mirTarBase; and protein-protein networks: Human Protein Reactions Database (HPRD) v9.1 and Human Integrated Protein-Protein Interaction rEference (HIPPIE) v2.0. All databases contain experimentally validated protein-protein interactions for human cells except SignaLink database which contains a small number of predicted miRNA-mRNA interactions. We distinguish high confidence, medium confidence and low confidence interactions is HIPPIE database using the confidence score from the database. The confidence score is assigned for each interaction in HIPPIE database and is calculated as a weighted sum of the number of studies in which an interaction was detected, the number and quality of experimental techniques used to measure an interaction and the number of non-human organisms in which an interaction was reproduced(“HIPPIE Howto,” n.d.). Predefined confidence levels by HIPPIE team were used to construct networks with only High Confidence interactions – HIPPIE HC (confidence level 0.73 - third quartile of the HIPPIE score) and with High and Medium Confidence interactions – HIPPIE HC+MC (confidence level 0.63 - second quartile of the score distribution).
All the databases use different types of gene ID. The IDs were converted to the HUGO gene nomenclature and this nomenclature was used to construct networks. Only interactions