HAL Id: cea-01556375
https://hal-cea.archives-ouvertes.fr/cea-01556375
Submitted on 5 Jul 2017
HAL is a multi-disciplinary open access
archive for the deposit and dissemination of
sci-entific research documents, whether they are
pub-lished or not. The documents may come from
teaching and research institutions in France or
abroad, or from public or private research centers.
L’archive ouverte pluridisciplinaire HAL, est
destinée au dépôt et à la diffusion de documents
scientifiques de niveau recherche, publiés ou non,
émanant des établissements d’enseignement et de
recherche français ou étrangers, des laboratoires
publics ou privés.
Complexation of Cesium and Thallium Cations by a
Water-Soluble Cryptophane
Laure-Lise Chapellet, Jean-Pierre Dognon, Marion Jean, Nicolas Vanthuyne,
Patrick Berthault, Thierry Buffeteau, Thierry Brotin
To cite this version:
Laure-Lise Chapellet, Jean-Pierre Dognon, Marion Jean, Nicolas Vanthuyne, Patrick Berthault, et al..
Experimental and Theoretical Study of the Complexation of Cesium and Thallium Cations by a
Water-Soluble Cryptophane. ChemistrySelect, Wiley, 2017, 2, pp.5292-5300. �10.1002/slct.201700979�.
�cea-01556375�
Study of the Complexation of
Cesium and Thallium Cations by a
Water-soluble Cryptophane
Laure-Lise Chapellet,
[a]Jean-Pierre Dognon,
*,[b]Marion Jean,
[c]Nicolas Vanthuyne,
[c]Patrick
Berthault,
[b]Thierry Buffeteau,
*, [d]Thierry
Brotin
*,[a]Abstract:
Cs (cesium) and Tl (thallium) are known to be very toxic for the environment and human health. Thus, the synthesis of molecular receptors aimed at extracting these two elements from the environment is strongly desired. In this Article, we report the synthesis of the two enantiomers ofcryptophane-223(OH)7 (1) and the study of their interaction with cesium and
thallium cations in basic aqueous solutions. These two
complexes have been studied by 133Cs and 205Tl NMR
spectroscopy to reveal the complexation of the two metallic cations and by chiroptical techniques (electronic and vibrational circular dichroism) to provide valuable information about the conformational changes occurring during the binding process.
The thermodynamic parameters of complexation K, DH0 and DS0
obtained from titration experiments reveal a strong interaction between 1 and the two cations under a large range of experimental conditions. A decomposition of the total binding energy, performed by DFT calculations, allows us to characterize the nature of the interactions existing between the cage-molecule and these two cations. These calculations also reveal the importance of the spin-orbit coupling for predicting
correctly the large frequency difference between the free Tl+ and
Tl+@1 NMR signals and to understand its origin. In addition to
the development of a methodology enabling detailed understanding of the host-guest interaction, this study indicates a very pronounced selectivity of this cage-molecule towards both
Cs+ and Tl+ cations in various experimental conditions.
subject of intense research. During the last decade, we have reported that water-soluble cryptophanes possess remarkable binding properties for a large variety of guest molecules
(halogenomethanes, oxiranes and cationic species).[1] For
instance, the efficient binding of cesium (Cs+) and thallium (Tl+)
cations with water-soluble cryptophanes bearing phenol groups
has been evidenced in LiOH/H2O, NaOH/H2O and even in
KOH/H2O solutions. Thus, it has been shown that cryptophanes
2, 3, 4 and 5 (Scheme 1) are among the best-known molecular
receptors for encapsulating cesium and thallium cations in
aqueous solutions. The affinity of Cs+ and Tl+ for these host
molecules depends on external parameters (nature of the basic solution, concentration) but also the nature of the cryptophane structure. For instance, it has been clearly established that the presence of phenol groups and their number play a key role in the stabilization of these complexes. This suggests that coulombic interactions probably play an important role in their
stabilization. Other types of interactions such as p-cation
interaction probably exist but these different contributions are difficult to quantify without the use of quantum chemistry calculations.
Scheme 1. Chemical structures of water-soluble cryptophanes(OH)x (x = 5, 6) 2-5 used previously for Cs+ and Tl+ encapsulation.
It has been also reported that cryptophane with larger
inner cavities can bind efficiently Cs+ and Tl+ cations. For
instance, compound 4, which possesses two ethylenedioxy and one propylenedioxy bridges shows a strong affinity for these two cations. Interestingly, the structure of this cryptophane can be modified to introduce a reactive function on the propylenedioxy
linker.[2] This chemical group can be chosen in order to react
orthogonally with the other groups grafted on the benzene rings. Cryptophane 1 reported in this article (Scheme 2) belongs to this class of compounds. It contains a secondary alcohol function attached on the propylenedioxy linker and the synthesis
of 1 in its racemic form has been recently described.[2] Herein,
we report the synthesis of the two enantiomers MM-1 and PP-1
and their characterization by 1H, 13C NMR and high-resolution
mass spectrometry. We show that compound 1 binds very
efficiently Cs+ and Tl+ cations in LiOH/H
2O, NaOH/H2O and
KOH/H2O. Electronic (ECD) and vibrational (VCD) circular
dichroism techniques are used to investigate the conformational changes occurring during the binding process. Isothermal titration experiments (ITC) enable accurate determination of the
parameters of complexation (K, DH0, DS0). In addition, 133Cs and
205Tl NMR spectroscopy give valuable information on the
O O O HO HO OH O O OH HO O OH O O O HO HO OH O O OH HO O OH O O O HO HO OH O O OH HO O OH O O O HO H OH O O OH HO O OH 2 3 4 5
[a] Dr. T. Brotin, Dr. L.L. Chapellet
Laboratoire de Chimie de L’ENS LYON (UMR 5182) Ecole Normale Supérieure de Lyon
46, Allée D’Italie
69364 Lyon cedex 07, France E-mail: thierry.brotin@ens-lyon.fr [b] Dr. P. Berthault, Dr. J.-P. Dognon
NIMBE, CEA, CNRS
Paris-Saclay University, CEA Saclay 91191 Gif-sur-Yvette, France E-mail: jean-pierre.dognon@cea.fr [c] M. Jean, Dr. N. Vanthuyne
Aix-Marseille University, CNRS, Centrale Marseille, iSm2 Marseille, France
[d] Dr. T. Buffeteau Bordeaux University
Institut des Sciences Moléculaires, CNRS UMR 5255 33405 Talence, France
E-mail: t.buffeteau@ism.u-bordeaux1.fr
Supporting information for this article is given at the end of the document.
decomposition of the total binding energy to investigate and quantify the nature of the interactions that exist between these two cations and host 1.
Scheme 2. Structure of the water-soluble cryptophane MM-1.
Results
Preparation of enantiopure cryptophane 1. Optically active
cryptophane 1 has been prepared in a three-steps synthesis from cryptophane 6 whose synthesis has been reported recently
in its racemic form.[2] The two enantiomers of 6 have been
separated by semi-preparative chiral HPLC chromatography to give rise to enantiomers (-)-6 and (+)-6. The enantiomeric excess of (-)-6 and (+)-6 (ee > 99.5 %) has been checked by analytical HPLC chromatography (Figure S1 in the Supporting Information). Additional purification steps on silica gel and
recrystallization in CH2Cl2/EtOH provide these two enantiomers
with high chemical purity. The ECD spectra recorded in CH2Cl2
and CHCl3 and polarimetric measurements (in CHCl3) of the two
enantiomers (-)-6 and (+)-6 are reported (Figure S2 in the Supporting Information). According to the ECD spectra and polarimetric values obtained for compounds 2-5, we found the following assignment (-)-MM-6 and (+)-PP-6 for the two enantiomers of 6.
Lithium diphenylphosphide (1 M in THF) has proved to be a very efficient reagent to deprotect in a single step both the six methyl groups and the allyl function attached on the
propylenedioxy linker.[2,3,4] Applied to compounds MM-6 and
PP-6, this approach gives rise the two desired MM-1 and PP-1
derivatives in 97 and 99% yields (crude product), respectively. Since the two isolated compounds MM-1 and PP-1 contain impurities in small amount, an additional purification has been used. Thus, these two compounds have been allowed to react with anhydride acetic in pyridine to give cryptophanes MM-7 and
PP-7 in 99 % and 78 % after purification, respectively. Then, MM-1 and PP-1 derivatives have been recovered in 98% and
92% yields, respectively by hydrolysis of the ester group under
basic conditions (Scheme 3). The 1H and 13C NMR spectra of
compounds MM-1 and PP-1 are identical to those previously reported for the racemic derivative (Figures S3-S6 in the
Supporting Information). 1H and 13C NMR spectra of MM-7 and
PP-7 are also reported (Figures S7-S11 in the Supporting
Information). It is noteworthy that compound 7 may exist under imploded form, which is ascertained by the presence of
characteristic signals in the 1H NMR spectrum.[5,1c] As an
example, the 1H NMR spectrum of a sample containing mainly
the imploded form is given (Figure S8 in the Supporting Information).
Scheme 3. Synthesis of the two enantiomers of cryptophanes 1 and 7
obtained from the two enantiomers of cryptophane 6. a) PPh2Li (1 M), THF,
60°C, 48 hrs; (97 %, MM-1; 99 %, PP-1) b) Ac2O, Pyridine, 0°C - 20°C, 5 hrs
(99%, MM-7, 78%, PP-7); c) KOH (0.5 M), THF, 50°C, 16 h, (98 %, MM-1; 92%, PP-1).
Isothermal Titration Calorimetry (ITC). ITC is the method of
choice to measure the association constants between cesium and thallium cations with host 1 in aqueous solutions. In the past, we have used this method to determine the binding constant K
and the thermodynamic parameters of complexation DH0, DS0
and DG0 of Cs+ and Tl+ cations with compounds 2-5.[6] ITC
experiments of (rac)-1 in the presence of Cs+, Tl+ and Rb+ have
been performed in LiOH/H2O, NaOH/H2O and KOH/H2O
solutions at different concentrations (0.1 or 1.0 M) (Figures S12-S15 in the Supporting Information). Basic conditions are mandatory to ensure a good solubility of the cage. To interpret the data obtained from isothermal titration calorimetric (ITC) experiments, we will consider that, in our experimental conditions, only the encapsulation of the metallic cations by the molecular host takes place. Example of such an equation reaction is reported in Scheme 4 that describes the
encapsulation of different metal cations (M+ = Rb+, Cs+, Tl+) by
host 1 in NaOH/H2O. The binding constants of Rb+@(rac)-1,
Cs+@(rac)-1 and Tl+@(rac)-1 complexes arereported in Table 1
whereas the thermodynamic parameters of complexation DH0,
DS0 and DG0 are given in Supporting Information (Figure S16 in
the Supporting Information). Even though Cs+ and Tl+ are the
two main cations of interest in this study, the association
constant between Rb+ and the cage has been measured in some
cases to perform competition experiments for high values of K.
Scheme 4. One binding site model considered for the isothermal titration
calorimetric experiments (ITC) in NaOH/H2O.
In LiOH/H2O solution at 298 K, the ITC experiments show
a very strong association between the Cs+ and Tl+ cations and
the cage, even at high concentration. For instance, in LiOH/H2O
(0.1 M), an association constant K = 3.6´108 M-1 (DG0 = -11.7
kcal mol-1) has been measured for the Cs+@(rac)-1 complex. At
higher LiOH/H2O concentration (1 M), this binding constant is
decreased by 2 orders of magnitude (K = 4.5´106 M-1; DG0 =
-9.1 kcal mol-1). It is noteworthy that, in the same experimental
conditions, the Tl+ cation shows higher affinity for the cage. For
instance, a binding constant K = 1.0´109 M-1 (DG0 = -13.6 kcal
mol-1) has been measured in LiOH/H
2O (0.1 M). As observed for
the Cs+ cation, increasing the LiOH/H
2O concentration results in
a decrease of the binding constant (K = 3.1´107 M-1; DG0 = -10.2
kcal mol-1). On the other hand, the Rb+@(rac)-1 complex
exhibits much lower association constants under the same
LiOH/H2O (0.1 M).
Table 1. Binding constants K (M-1
) measured at 298 K by ITC for the M+
@(rac)-1 complexes in LiOH (0.1 M in H2O), NaOH (0.1 M in H2O), KOH
(0.1 M in H2O) and LiOH (1 M in H2O).
Cations M+
LiOH (0.1 M) NaOH (0.1 M) KOH (0.1 M) LiOH (1 M)
Cs+
3.6± 0.2´108[a] 7.6±0.6´108[a] 1.0± 0.04´107 4.5 ± 0.2´106
Tl+ 1.0± 0.1´109[a] 11.0 ± 2´109[a] 5.6 ± 0.9´107 3.1 ± 0.2´107
Rb+
1.3 ± 0.3´105 2.6 ± 0.1´105 - 1.8 ± 0.2´103
[a] from competition experiments (competitor Rb+)
Replacing the LiOH solution by a NaOH solution leads to a slightly higher K value. For instance, in a 0.1 M NaOH solution,
the Cs+@(rac)-1 complex shows a binding constant K = 7.6´108
M-1 (DG0 = -12.1 kcal mol-1) slightly higher than that measured in
the same conditions in LiOH solution. The same trend occurs for
the Tl+@(rac)-1 complex. In contrast to what is observed in
these solutions, the use of a 0.1 M KOH solution has a strong impact on the equilibrium constants of these two complexes. For
instance, binding constants K = 1.0´107 M-1 (DG0 = - 9.6 kcal
mol-1) and K = 5.6´107 M-1 (DG0 = -10.6 kcal mol-1) have been
measured for the Cs+@(rac)-1 and Tl+@(rac)-1 complexes,
respectively. Combined together these results show that both
Cs+ and Tl+ cations are very well recognized under a large range
of experimental conditions. A very high selectivity toward Li+,
Na+ and even K+ cations is also observed.
133Cs and 205Tl NMR Spectroscopy. As both cesium and
thallium nuclei have non-null spin isotopes, NMR spectroscopy
can be used to characterize the Cs+@(rac)-1 and Tl+@(rac)-1
complexes. Thanks to the high polarizability of their electron clouds and the strong shielding effect induced by the six aromatic rings, high field NMR signals characteristic of the encapsulated form of these cations are observed.
The 133Cs NMR spectrum of Cs+ in the presence of (rac)-1
shows two well-resolved signals at 298 K in NaOD/D2O (0.1 M)
solution. Cs+ free in solution gives an intense signal near 0 ppm
whereas the Cs+@(rac)-1 complex gives rise to a characteristic
133Cs NMR signal located at d = -258 ppm. This signal is
relatively broad at room temperature. Interestingly, a sharpening
of the Cs+@(rac)-1 NMR signal is observed when the
temperature of the solution increases (Figure S17 in the Supporting Information). In contrast, lowering the temperature
results in a broadening of the Cs+@(rac)-1 NMR signal. This
counter-intuitive effect has been previously observed with cryptophanes 2, 3 and 4, which also show a very high affinity for
Cs+.
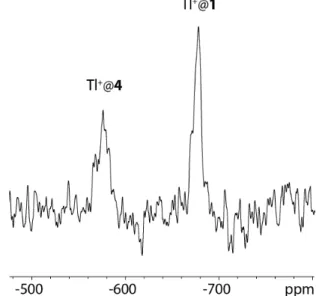
The 205Tl NMR spectra are more difficult to record since this
nucleus resonates at a frequency out of the scope of most of the commercial NMR probe heads. Consequently, a homemade system is necessary to facilitate the detection of this signal (see Experimental Section in the Supporting Information for more
details). In addition, the detection of the Tl+@1 signal is made
difficult due to the large difference of chemical shift existing
between the Tl+ cation present within the cavity of the
cryptophane host and Tl+ dissolved in the bulk. In the present
case, a high field shifted signal located at -680 ppm has been
observed for the Tl+@(rac)-1 complex. Another signal located at
+340 ppm has been detected for the free Tl+ cation. This leads
to a chemical shift difference larger than 1000 ppm for this
induce large chemical shift differences. This is evidenced in
Figure 1 by comparing the 205Tl NMR signals of two Tl+@(rac)-1
and Tl+@(rac)-4, which differ only by the presence of a
secondary alcohol function attached on propylenedioxy linkers in host 1.
Figure 1.205
Tl NMR spectrum of the Tl+
@4 and Tl+
@1 complexes in NaOD/D2O (0.1 M) at 348 K. The free Tl+ signal is positioned at 340 ppm with
respect to TlNO3 (not shown).[7]
ECD Spectroscopy. Thanks to the preparation of enantiopure
compounds MM-1 and PP-1, the encapsulation process of Cs+
and Tl+ cations can also be studied using chiroptical techniques
such as ECD. This technique is known to be a valuable tool to
study the conformational rearrangements that take place in solution
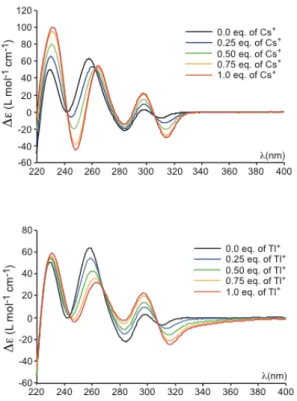
upon the encapsulation process. Indeed, large spectral changes are sometimes observed. ECD spectra of the Cs+@MM-1 and Tl+
@MM-1 complexes in LiOH/H2O (0.1 M) in the presence of different
amounts of Cs+ and Tl+ cations are presented in Figure 2.
Figure 2 shows that the addition of various quantities of a
cesium hydroxide solution (from 0 to 1 equiv.) to the LiOH/H2O
(0.1 M) solution of free host 1 gives rise to a significant change of the overall ECD spectrum in the 220-380 nm region. The presence of three isosbestic points indicates the formation of a
new species upon addition of Cs+. This new species can be
attributed to the formation of the Cs+@MM-1 complex. Replacing
the Cs+ cation by Tl+ cation leads to more marked modifications
of the ECD spectra. These spectral changes mainly occur for the
ECD bands of the 1L
b transition (280 – 320 nm) for which
addition of one equivalent of Tl+ results in a significant
bathochromic shift. As observed with Cs+, the ECD spectra also
reveal the presence of multiple isosbestic points indicating the
Figure 2. ECD spectra of the Cs+
@MM-1 (top spectra) and Tl+
@MM-1 (bottom spectra) complexes recorded in LiOH/H2O (0.1 M) at 293 K as a
function of the amount of cesium hydroxide or thallium acetate added into the solution (0 eq, 0.25 eq, 0.5 eq, 0.75 eq and 1.0 eq). ECD spectra for higher Cs+
or Tl+
concentrations are identical to that recorded for 1 equivalent of Cs+
or Tl+
.
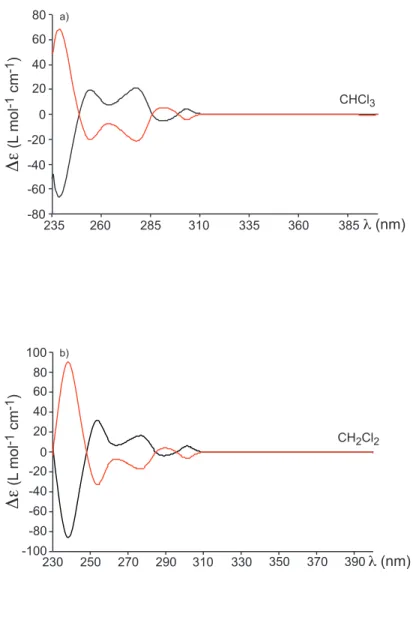
A modification of the experimental conditions also produces important changes in the ECD spectra of the MM-1
derivative. For instance, the presence of a competitor (CHCl3)
present inside the cavity of MM-1 significantly affects the overall ECD spectrum of compound MM-1. The replacement of the
chloroform molecule by the Cs+ or the Tl+ cations has a dramatic
effect on the global shape of the ECD spectrum of MM-1,
especially for the ECD bands of the allowed 1B
b transition
located at low wavelength (close to 220 nm). Indeed, a strong
decrease in intensity is observed upon addition of Cs+ or Tl+
cations into the solution (Figure S18 in the Supporting Information). The presence of multiple isosbestic points
indicates that both the Cs+@MM-1 and Tl+@MM-1 complexes
are efficiently formed and that these two cations can
successfully expel the CHCl3 molecule from the inner cavity of
the host. It is noteworthy that a change of the concentration of
the LiOH/H2O solution produces similar effects (Figure S19 in
the Supporting Information). For instance, higher LiOH/H2O
concentration (1 M) solution gives rise to ECD spectra similar to
those recorded for the CHCl3@MM-1 complex. The addition of
CsOH/H2O or TlOAc/H2O into this solution strongly affects the
ECD spectra of MM-1. In all cases, it is important to note that the ECD spectra remain unchanged when more than one equivalent
of Cs+ or Tl+ are added into the solution. Finally, the replacement
of LiOH/H2O by a KOH/H2O solution reveals two different
behaviors in the ECD spectra of MM-1 upon addition of Cs+ or
Tl+ cations. In the presence of cesium hydroxide solution, very
small modifications of the ECD spectra of MM-1 are observed, whereas the spectral changes are more pronounced when a thallium acetate solution was added (Figure S20 in the Supporting Information).
spectra of CDCl3@PP-1 and Cs @PP-1 complexes recorded in
NaOD/D2O (0.21 M) solution. Important spectral modifications
occur upon complexation of CDCl3 and Cs+, as already observed
for compound 3.[1f] Indeed, the intensity of the band at 1495 cm-1
increases for the CDCl3@PP-1 complex, whereas this band
presents a bisignate pattern for the Cs+@PP-1 complex. On the
other hand, the intensity of the band at 1600 cm-1 strongly
increases for the Cs+@PP-1 complex. These spectral changes,
as well as those observed in the 1450-1250 cm-1 region, which
correspond to coupled modes involving wagging and twisting
vibrations of the CH2 groups (chains and caps), may be
interpreted as a modification of the conformation of the linkers of
host 1. Thus, the presence of CDCl3 inside the cavity of 1 favors
the trans conformation of the ethylenedioxy linkers whereas the
presence of Cs+ cations favors the gauche conformations of the
linkers in order to maximize the host-guest interactions.
Figure 3. VCD spectra of empty PP-1 as well as CDCl3@PP-1 and Cs+@PP-1
complexes recorded at 293 K in NaOD/D2O solution (0.21 M). The
concentration of host 1 was 0.030 M.
DFT Calculations. Quantum chemistry calculations have been
performed to understand the nature of the various interactions that can exist between the host and the cations. These calculations are also expected to be useful to understand the
origin of the large NMR chemical shift observed for the Cs+@1
and the Tl+@1 complexes. Thus, we have carried out orbital,
topological and energy decomposition analyses (EDA) along
with the calculation of chemical shift for the Cs+@1 and the
Tl+@1 complexes with quantum chemistry methods.[8,9]
Computational details are provided in the Supporting Information. The optimized geometry of the complexes is rather similar for
alkali metals (K+, Rb+, Cs+) and for the heavier Tl+ cation, as
shown in Figure 4. However, the position of the Tl+ cation within
the cryptophane cage differs from that of Cs+, revealing a
modification of the interaction between the Tl+ cation and the
cage.
The nature of the bonding interactions between the metal and the host has been first investigated with an energy partitioning of the total interaction energy into components familiar to chemists, namely electrostatic, Pauli repulsion and orbital mixing.
complexes.
It is important to note that all of the terms assignable to the bond (polarization, charge-transfer, etc.) are grouped into a single orbital interaction term. The results are reported in Figure 5.
Figure 5. DFT PBE/TZ2P bonding energy analysis with respect to the M+ and
cryptophane fragments.
The M+@1 total bonding energy is a negative value indicating
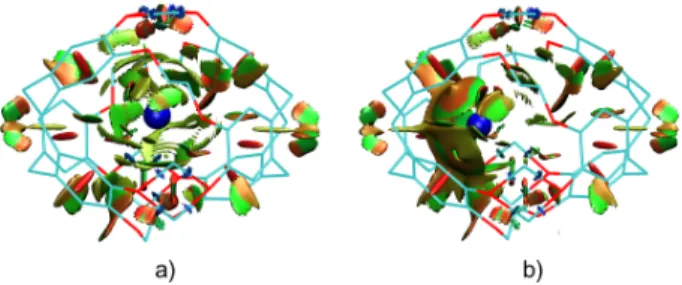
stabilization during encapsulation of the cation, which originates mainly in attractive electrostatic (~ 32% of the total attractive interactions) and orbital interactions (~ 50% of the total attractive interactions). The dispersion forces are a non-negligible component of the interaction (~ 18% of the total attractive interactions). The spatial regions in which the non-covalent interactions (electrostatic, dispersion) are taking place are visualized in Figure 6.
The total bonding energy is much more negative for the Tl+
complex than for the Cs+ complex. The Voronoi Deformation
Density (VDD) analysis reveals if charge flows away or toward the space around a certain nucleus upon the formation of the
complex from its fragments.[10] Upon encapsulation of the alkali
metals the VDD analysis indicates that no charge transfer occurs between the cage and the cation. In contrast, in the case of the thallium cation, 0.2 electrons (0.25 electrons from natural bond orbital (NBO) analysis) are transferred from the cage to the
6p orbital of the Tl+ cation.[11]
The 6d(Tl) orbital mixes the 2p(C) orbital of the phenyl ring
(symmetrized fragment orbital analysis).[9] The calculation
reveals that the Tl+@1 complex is also stabilized at lower energy
(See Figure 1a in the computational details in the Supporting Information) by the mixing of the 6s(Tl) orbital with the 2p(C) orbital of the aromatic ring. In the alkali metal complexes, the 5p(M) orbital mixes with the 2p(C) orbital of all cages (See Figure 1b in the computational details in the Supporting Information).
interaction regions appear in green and light brown for Cs (a) and Tl (b). Hydrogen atoms are removed for clarity. The cations are in blue color.
From this analysis, it is clear that the phenyl ring-Tl+ interaction
is predominant inside the cryptophane cage. The Tl+@1
complex is stabilized by orbital interactions and by cation-π interactions. In the alkali metal series, cation-π interactions cannot be clearly identified.
Figure 7. Calculated chemical shifts using a secondary reference (See
computational details in the Supporting Information).
These different interaction patterns, as revealed by the ECD spectra, have a consequence on the magnetic properties
of the metal ions. The M+ isotropic shielding was calculated
through the DFT/GIAO shielding tensor. The results are reported
in Figure 7 for Cs+ and Tl+. As shown in Figure 7, it is critical to
take into account explicitly all the relativistic contributions (scalar and spin-orbit) to the nuclear shielding for Tl element. Upon complexation, the electronic effects (phenyl ring π electrons and cation-cryptophane orbital interaction) increase the electron
density at the nucleus. For the Tl+ complex, this effect is large,
shifting the NMR signal to high field with a huge chemical shift variation with respect to that experienced by the alkali metal cations.
Discussion
Comparison of the binding properties of 1 with cryptophane
congeners 2 - 5. ITC experiments performed on the Cs+
@(rac)-1 and the Tl+@(rac)-1 complexes reveal a very high affinity of
host 1 for the cesium and thallium cations. This cage shows the
highest affinity for the Tl+ cation. The affinity of 1 for Cs+ is about
ten times smaller than the affinity measured for Tl+. In addition,
the Rb+ and K+ cations are much less recognized by the host
since the affinity for these two cations is about one thousand and one million times smaller, respectively, than the binding
between the magnitude of the binding constant and the
polarizability of the M+ cation (Tl+ > Cs+ > Rb+ > K+ >> Na+, Li+).
The affinity of 1 for the Cs+ and Tl+ cations lies in the same
range than the binding constant measured for compounds 2 and
4.[1e,6] These compounds also possess six phenol groups
attached on the benzene rings but their cavity size is different. Compounds 1 and 4 have the closest structures since they differ only by the presence of a secondary alcohol function in 1. Thus,
upon complexation of Cs+ or Tl+ it is not surprising to observe
comparable binding constants between these two compounds. The similarity in magnitude of the binding constants suggests that the alcohol group present in 1 does not play any crucial role in the stabilization of the complex. This is probably because the OH function points outside the cavity and cannot establish specific interactions with the metal cation present within the cavity. A minimized structure of the host obtained by DFT supports this assumption.
Comparison of the ECD spectra of 1 with compounds 2 and 3 reveals the same evolution of the ECD spectra in the presence of metal cations. ECD spectroscopy was found to be very sensitive to the conformational changes of water-soluble cryptophanes upon encapsulation of guest molecules or
cations.[1] The Cs+ or Tl+ encapsulation induces large spectral
modifications, which are the consequence of the conformational rearrangements of the linkers. These conformational rearrangements allow the cage to change its cavity size in order to maximize its interactions with the metal cations. It is
noteworthy that a higher concentration of Cs+ or Tl+ cations
(more than 1 equivalent) does not induce further spectral changes, suggesting that host-guest interactions are solely responsible of the observed effect. Such spectral changes have
already been observed with compounds 2 and 3,[1e,1f] but it is
interesting to notice that in the case of 1 these effects are not amplified, even though host 1 is potentially subject to larger conformational changes. Indeed, the propylenedioxy linker, present in the structure of 1, is certainly more favorable to conformational changes than ethylenedioxy linkers (compounds
2 and 3).
The ECD experiments performed in the presence of a
competitor (CHCl3) or in KOH/H2O solution give new insight to
interpret the behavior of 1 in the presence of metal cations. For instance, important similarities are observed between the ECD
spectra of the CHCl3@MM-1 complex (LiOH/H2O, 0.1 M) and
the spectrum recorded at higher LiOH/H2O (1 M) concentration.
This indicates that the cage adopts a similar conformation in solution. The chloroform molecule possesses a large molecular
volume (Vvdw = 72 Å3) that forces the cage to enlarge its cavity
(increasing the proportion of trans conformation of the linkers). Interestingly, increasing the concentration of the basic solution seems to produce a similar effect. Nevertheless, high concentrations of LiOH are not the most favorable conditions to observe efficient complexation of metal cations. However, the
interactions between cage 1 and Cs+ or Tl+ seem to be strong
enough to provoke a conformational change that reduces the
cavity size (the complexation of Cs+ or Tl+ cations favors the
proportion of gauche conformation). An opposite effect takes place when the experiments are performed in KOH solution. We
have reported that K+ cations bind moderately to cage 1. Thus,
K+ acts as a competitor for Cs+ or Tl+, resulting in a decrease of
the observed binding constants by two orders of magnitude. The
encapsulation of the K+ cation also results in a pre-organization
of the host molecule leading to moderate chiroptical changes
upon Cs+ and Tl+ encapsulation. Indeed, these cations have
similar volumes and the replacement of K+ (V
vdw = 11 Å3) by Cs+
(Vvdw = 20 Å3) or Tl+ (Vvdw = 14 Å3) is not expected to modify
significantly the cavity size of the host.
complexes. Indeed, a bathochromic shift of the ECD bands of
the 1L
b transition (280 – 320 nm) is observed for the Tl+@MM-1
complex. This effect has been previously observed for
compounds 2-5 in the presence of Tl+.[1f,6] This seems to be an
indication that Tl+ interact differently with the cages. DFT
calculations support this assumption (see below).
Understanding the nature of the interaction between the metallic cations and the cage. For the first time, DFT
calculations have been performed comparatively for the Cs+@1
and Tl+@1 complexes. A theoretical approach that consists to
decompose the total binding energy into different contributions (electrostatic, Pauli interaction, orbital interaction and dispersion energy) is very useful to understand the nature of the interactions that takes place between the cations and host 1.
These DFT calculations confirm that the Tl+ cation interacts
more strongly with the cage than the Cs+ cation. In the case of
the Tl+ cation, the calculations reveal that the Pauli repulsion
term is strongly positive for the Tl+ and contributes significantly
to the destabilization of the complex. However, this term is largely compensated by the strongly negative electrostatic and orbital interaction terms with a non-negligible charge transfer
between Tl+ and the cage. These terms dominate the host-guest
interactions, and the summation over the different contributions leads to a large negative total binding energy (DE = -70 kcal/mol), which is characteristic of the formation of a very stable complex.
In the case of the Cs+ cation, the total binding energy is
significantly lower (DE = -40 kcal/mol). Indeed, even though the positive contribution of the Pauli repulsion term is much less
important than for Tl+, the two electrostatic and orbital interaction
terms are decreased by a factor 2 in magnitude leading to a weaker total binding energy.
These results are consistent with the ECD measurements
that suggest a stronger interaction between the cage and the Tl+
cation (bathochromic effect of the 1L
b transition). In contrast, the
calculations reveal a similar behavior for the interactions of the
Cs+ and Rb+ cations with the cage. This is also consistent with
the ECD measurements that show similar spectra for these two species (data not shown). Thus, it can be claimed that the ECD spectra are not only characteristic of the conformational changes of the host but they are also characteristic of the nature of the interaction that takes place between the metal cations and the two cyclotribenzylene units that constitutes the cryptophane skeleton.
A direct comparison between DFT binding energy (from EDA) and binding constants measured by titration experiments is not appropriate. Indeed, EDA is a very powerful method for a qualitative and quantitative analysis of the chemical bond. This method reports the instantaneous interaction energy between two fragments (the cage and the cation) in the molecular system. In this calculation, neither the full thermodynamics effects nor the solvation effects in reference to experiments are included.
Hard cations such as K+ and Rb+ are probably more solvated
that soft cation such as Cs+. Consequently, solvation of the
cationic species is expected to decrease the electrostatic
interaction term more rapidly in the case of the K+ and Rb+
cations than in the case of the Cs+ cation. The solvation of the
cage must also be taken into account in our case. It is noteworthy that the presence of water molecules inside the cavity of the host is an important issue to understand the binding properties of the cryptophane derivatives in aqueous solution, especially when cationic species are present within the cavity. The presence of water molecules inside the cavity of cryptophane hosts has already been evidenced both
experimentally (X-ray crystallography) and theoretically.[12,13] The
Experimental procedures based on ITC experiments have been
recently proposed to address this problem.[14] For instance,
Eggers and co-workers have suggested treating water molecules as a co-reactant in order to have access to the global desolvation free energy term. This approach is interesting but also time demanding and it is out of the scope of this article. From a theoretical point of view, an implicit solvation model cannot take into account these phenomena. An explicit solvation model including in the case of the cryptophane cage inner water molecules and several outer solvation shells is mandatory, leading to time demanding calculations.
133Cs and 205Tl NMR spectra of the complexes. 133Cs and 205Tl
nuclei are known to be very sensitive to their surrounding environment. In the past, we have reported that both nuclei give rise to very important chemical shift differences between the metallic cation dissolved in the bulk and the cation present within
the cavity of the cryptophane hosts.[1e,1f] These frequency
differences were found more important for the Tl+ cation than for
the Cs+ cation. These findings are still observed with compound
1, and can be the consequence of several parameters. As
mentioned above Tl+ interacts more strongly with the cage and
its polarizability is about twice that of the Cs+ cation.
Consequently, a small change in the cryptophane structure can induce very large chemical shift differences for these two nuclei.
For instance, a comparison of the 133Cs and 205Tl NMR spectra
of compounds 1 and 4 reveals the high sensitivity of these two nuclei for their immediate environment. At room temperature, a
chemical shift difference, Dd, of 10 - 15 ppm is observed
between the two Cs+@(rac)-1 and the Cs+@(rac)-4 complexes.
This difference is much larger in the case of the 205Tl nuclei,
since Dd = 110 ppm at 335 K (Figure 1).[15]
It is noteworthy that the high sensitivity of the 205Tl nucleus
with its immediate environment also explains the large chemical
shift differences between Tl+ in the bulk and the Tl+@(rac)-1
complex. This chemical shift reaches a value Dd ~ 1030 ppm at 335 K. DFT calculations are very helpful and informative to interpret such high chemical shift difference. For instance, in the
case of 205Tl, these calculations show that relativistic
contributions such that spin-orbit coupling is a very important parameter, which has to be taken into account to predict
correctly the chemical shift of the Tl+@1 complex. In the case of
the Cs+@1 complex, the contribution of the spin-orbit coupling is
less important and this contribution can be neglected.
The temperature effect observed in the case of the Cs+@1
complex is intriguing and counter-intuitive. It is noteworthy that a similar effect also occurs with cryptophanes 2, 3 and 4, which
show high affinity for Cs+. In contrast, an opposite effect is
observed with compound 5 that exhibits the lowest association
constant with Cs+.[6] We have also noticed that the broadening of
the Cs+ NMR signal observed at lower temperature seems
related to the symmetry of the host. Thus, the higher the
symmetry of the host the sharper the 133Cs NMR signal at low
temperature. For instance, at 278 K the Cs+ NMR spectrum of
compound 1 (C1-symmetry) shows a signal larger than that of
compound 2 (D3-symmetry). DFT calculations reveal that
coulombic interactions between Cs+ and the phenolate group are
important. Considering that the Cs+ cation is small with respect
to the volume of the inner cavity of the hosts, we can thus
assume that Cs+ interacts with the different OH groups of the
host. Consequently, it explores different regions of the cavity leading to a broadening of the signal at lower temperature. A
decrease of the symmetry of the host results in a larger Cs+
NMR signal at low temperature. Increasing the temperature
results in a mean value of this 133Cs NMR signal. This
assumption does not take into account important characteristics
take place with a change of the temperature. However, these considerations are not consistent with the fact that compound 5
shows an opposite behavior. In addition, it must be mentioned
that a similar temperature effect seems to occur with the 205Tl
(no quadrupolar moment). Additional work is needed to fully address and understand this surprising effect.
Conclusions
We have described the synthesis of the two enantiomers MM-1 and PP-1 from enantiopure cryptophanes MM-6 and PP-6, respectively. The two enantiomers MM-6 and PP-6 have been isolated by semi-preparative HPLC on chiral stationary phase. Then, subsequent reactions afforded the desired MM-1 and
PP-1 derivatives. We have also studied the binding properties of the
water-soluble cryptophane 1 in basic aqueous solution in the
presence of metallic cations (M+ = Rb+, Cs+, Tl+). The titration
experiments (ITC) show a very high affinity of 1 for the Cs+ and
Tl+ cations under a large range of experimental conditions. For
instance, a binding constant as high as K = 1.0´1010 M-1 has
been measured for Tl+@1 complex in LiOH/H
2O (0.1 M).
Chiroptical techniques (ECD and VCD) have been used to investigate the conformational changes that take place during
the encapsulation process. The formation of the Cs+@(rac)-1
and Tl+@(rac)-1 complexes has been also studied via 133Cs and
205Tl NMR spectroscopy, where the low-field signals with respect
to the free cations in solution is used to unambiguously detect these two complexes even at high temperature (335 K).
On the other hand, DFT calculations have shown to be a valuable tool to understand the nature of the interaction existing between the cage and the different cations. These calculations
suggest that the Tl+ cation interacts differently with the cage than
the other alkali cations studied in this article (M+ = K+, Rb+, Cs+).
For instance, thanks to an energy decomposition analysis, these calculations show the predominance of the electrostatic and
orbital interactions in the stabilization of the Tl+@1 complex. The
theoretical investigation of the electronic structure and bonding
revealed cation-π interactions in the Tl+@1 complex. In the alkali
metal series, π-cation interactions cannot be clearly identified. In addition, this theoretical work shows that the large chemical shift
observed in the case of the Tl+@1 complex (Dd ~ 1000 ppm) can
be only explain by including relativistic contribution such as spin-orbit coupling interactions and a non-negligible charge transfer
between Tl+ and the cage.
The originality in the structure of host 1 lies in the presence of a hydroxyl function that can be used for subsequent reactions. Since the secondary alcohol does not directly participate to the
stabilization of the M+@1 complexes, it can be used at a later
stage for grafting an organic spacer linked to a solid support. A synthetic work is under way to graft these molecules onto solid supports (superparamagnetic nanoparticles) with the objective of increasing the extraction yield of cesium and thallium cations
from aqueous solutions.[16]
Supporting Information Summary
Experimental section, HPLC and ECD spectra of MM-6 and
PP-6, 1H and 13C NMR spectra of MM-1 and PP-1, 1H and 13C NMR
spectra of MM-7 and PP-7, isothermal titration calorimetric (ITC)
experiments and thermodynamic parameters of the M+@1
Acknowledgements
The authors are indebted to the CNRS (Chemistry Department) and to Région Aquitaine for financial support in VCD equipments. The GDR 3712 Chirafun is acknowledged for allowing a collaborative network between some partners of this project.
Conflict of Interest
The authors declare no conflict of interest.
Keywords: Calorimetry • Chirality • Circular Dichroism • DFT
Calculations • Molecular Recognition
[1] a) A. Bouchet, T. Brotin, D. Cavagnat, T. Buffeteau, Chem. -Eur. J.
2010, 16, 4507; b) A. Bouchet, T. Brotin, M. Linares, H. Ågren, D. Cavagnat,
T. Buffeteau, J. Org. Chem. 2011, 76, 1372; c) A. Bouchet, T. Brotin, M. Linares, D. Cavagnat, T. Buffeteau, J. Org. Chem. 2011, 76, 7816; d) A. Bouchet, T. Brotin, M. Linares, H. Ågren, D. Cavagnat, T. Buffeteau, J. Org.
Chem. 2011, 76, 4178; e) T. Brotin, R. Montserret, A. Bouchet, D. Cavagnat,
M. Linares, T. Buffeteau, J. Org. Chem. 2012, 77, 1198; f) T. Brotin, D. Cavagnat, P. Berthault, R. Montserret, T. Buffeteau, J. Phys. Chem. B 2012,
116, 10905.
[2] L. L. Chapellet, J. R. Cochrane, E. Mari, C. Boutin, P. Berthault, T. Brotin, J. Org. Chem. 2015, 80, 6143.
[3] E. Vedejs, P. L. Fuchs, J. Am. Chem. Soc. 1973, 95, 822. [4] R. E. Ireland, D. M. Walba, Org. Synth. 1977, 56, 44.
[5] G. Huber, T. Brotin, L. Dubois, H. Desvaux, J. P. Dutasta, P. Berthault,
J. Am. Chem. Soc. 2006, 128, 6239.
[6] T. Brotin, S. Goncalves, P. Berthault, D. Cavagnat, T. Buffeteau, J.
Phys. Chem. B 2013, 117, 12593.
[7] J. F. Hinton, Bull. Magn. Reson. 1992, 13, 90.
[8] F. M. Bickelhaupt, E. J. Baerends In Reviews of Computational
Chemistry, D. B. Boyd, K. B. Lipkowitz, Wiley-VCH: New York, 2000, P. 1, Vol.
15.
[9] [G. te Velde, F. M. Bickelhaupt, E. J. Baerends, C. Fonseca Guerra, S. J. A. van Gisbergen, J. G. Snijders, T. Ziegler, J. Comput. Chem., 2001, 22, 931.
[10] F. M. Bickelhaupt, N. J. R. van Eikema Hommes, C. Fonseca Guerra, E. J. Baerends, Organometallics, 1996, 15, 2923.
[11] A. E. Reed, R. B. Weinstock, F. Weinhold, J. Chem. Phys. 1985, 83, 735.
[12] O. Taratula, P. A. Hill, N. S. Khan, P. J. Carroll, I. J. Dmochowski, Nat.
Comm. 2010, 1.
[13] L. Gao, W. Liu, O-S. Lee, I. J. Dmochowski, J. G. Saven, Chem. Sci.
2015, 6, 7238.
[14] B. M. Castellano, D. K. Eggers, J. Phys. Chem. B 2013, 117, 8180. [15] This temperature has been chosen because the 205Tl NMR spectra are
not well resolved at room temperature.
[16] E. Siurdyban, T. Brotin, D. Talaga, K. Heuzé, L. Vellutini, T. Buffeteau,
Supporting Information
Table of contents
Figure S1: Chromatograms (Chiralpak ID, 250
´ 4.6 mm, EtOH/CH
2Cl
2: 20/80, 1 mL/min) of the
collected anti-1 enantiomers after preparative separation on Chiralpak ID (250 ´ 10 mm, EtOH/CH
2Cl
2:
20/80, 5 mL/min) by 120 injections of 4.4 mg of racemate. Detection by UV-vis spectroscopy at 254
nm (black chromatograms) and CD spectroscopy at 254 nm (red chromatograms).
Figure S2: ECD spectra of compound MM-6 and PP-6 recorded in CHCl
3(a: top spectrum; c = 1.12
10
-4M - 9.04 10
-5M) and in CH
2Cl
2(b: bottom spectrum; c = 9.41 10
-5M - 8.88 10
-5M ). Polarimetric
measurements of compounds MM-6 and PP-6 recorded at 25°C in CHCl
3.
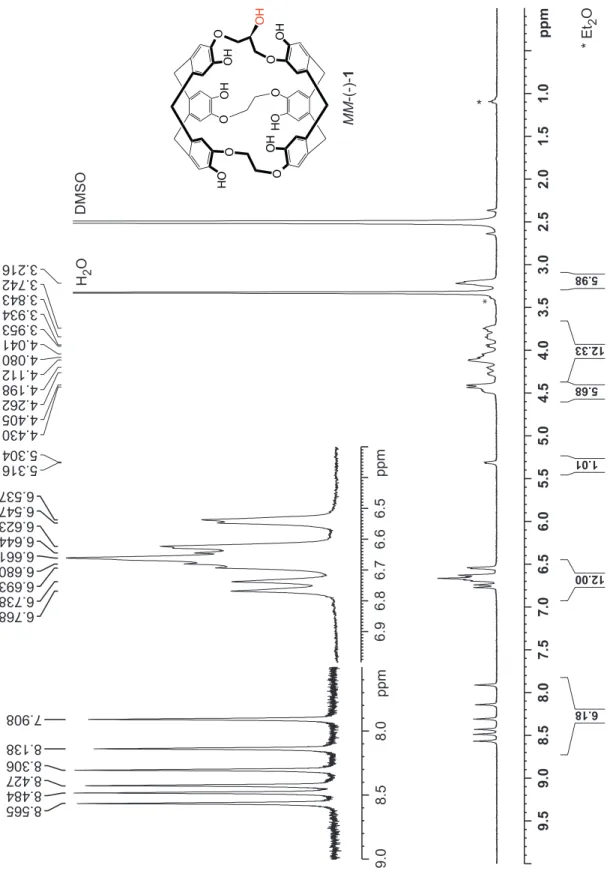
Figure S3:
1H NMR spectrum (300 MHz) of the enantiomer MM-1 recorded in DMSO-d
6at 298 K.
Figure S4:
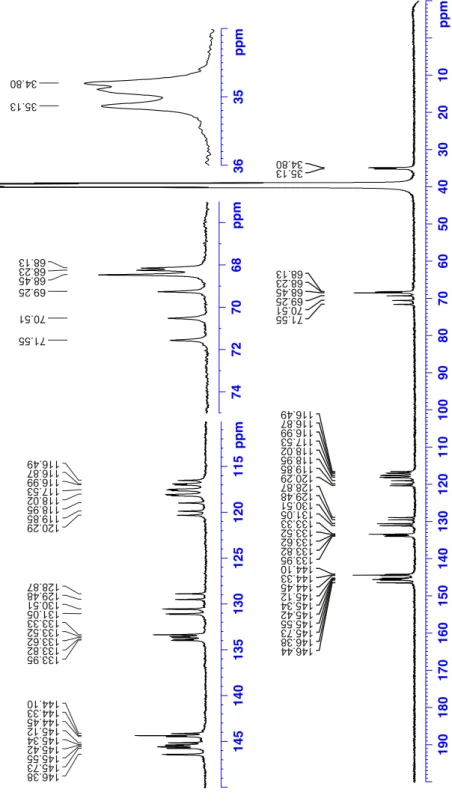
13C NMR spectrum (75.47 MHz) of the enantiomer MM-1 recorded in DMSO-d
6at 298 K.
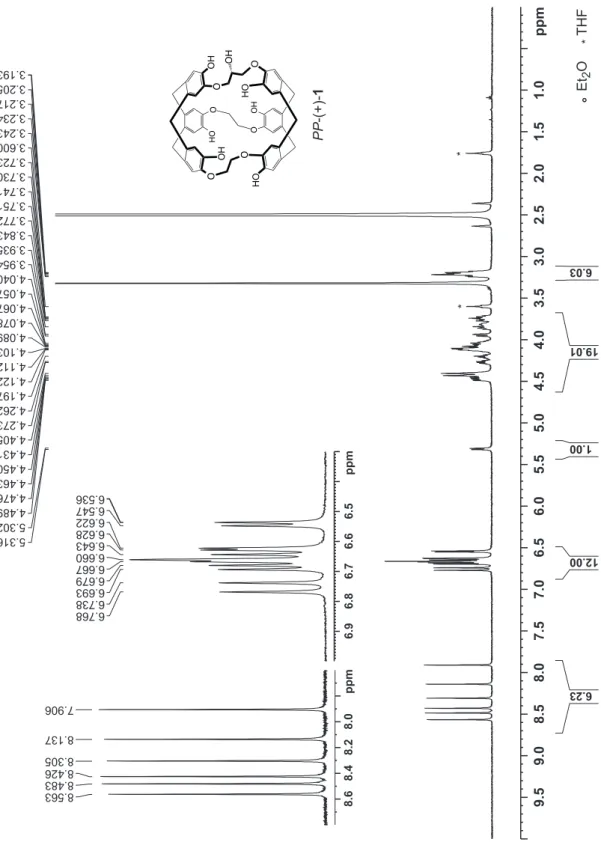
Figure S5:
1H NMR spectrum (300 MHz) of the enantiomer PP-1 recorded in DMSO-d
6at 298 K.
Figure S6:
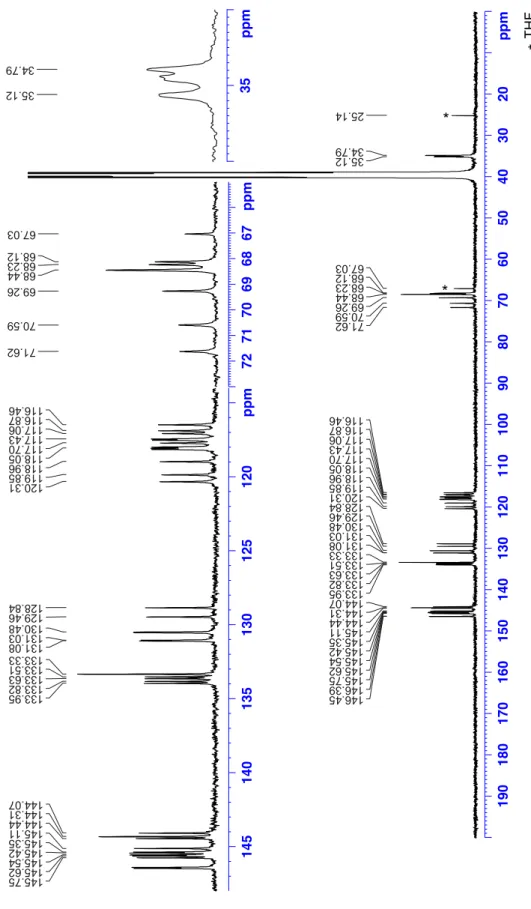
13C NMR spectrum (75.47 MHz) of the enantiomer PP-1 recorded in DMSO-d
6at 298 K.
Figure S7:
1H NMR spectrum (300 MHz) of the enantiomer PP-7 (non-imploded form) recorded in
CD
2Cl
2at 298 K.
Figure S8:
1H NMR spectrum (300 MHz) of the enantiomer PP-7 (mainly imploded form) recorded in
CD
2Cl
2at 298 K. in insert: comparison of the
1H NMR spectra of the imploded and non-imploded form
(aromatic region only).
Figure S9:
13C NMR spectrum (75.47 MHz) of the enantiomer PP-7 (non-imploded form) recorded in
CD
2Cl
2at 298 K.
Figure S11:
13C NMR spectrum (75.47 MHz) of the enantiomer MM-7 (non-imploded form) recorded in
CD
2Cl
2at 298 K.
Figure S12: Calorimetric titration of 1 in LiOH/H
2O (0.1 M) at 298 K in presence (or not) of RbCl (top
left), CsOH (top right) or TlOAc (bottom). The host solution (top left, c = 99.3 µM; top right, c = 26.0
µM; bottom, c = 30.2 µM) was placed into the calorimeter cell (1.4 mL) and 28 successive aliquots (10
µL) of RbCl (top left c = 1.029 mM), CsOH (top right, c = 0.404 mM) and TlOAc (bottom, c = 0.406
mM) were added at 3 min intervals. The concentration of RbCl was: top right, c = 0.302 mM; bottom, c
= 0.598 mM (competition experiments).
Figure S13: Calorimetric titration of 1 in NaOH/H
2O (0.1 M) at 298 K in presence (or not) of RbCl (top
left), CsOH (top right) or TlOAc (bottom). The host solution (top left, c = 100 µM; top right, c = 29.9 µM;
bottom, c = 30.2 µM) was placed into the calorimeter cell (1.4 mL) and 28 successive aliquots (10 µL)
of RbCl (top left c = 1.0 mM), CsOH (top right, c = 0.398 mM) and TlOAc (bottom, c = 0.387 mM) were
added at 3 min intervals. The concentration of RbCl was: top right, c = 0.500 mM ; bottom, c = 0.911
mM (competition experiments).
Figure S14: Calorimetric titration of 1 in KOH/H
2O (0.1 M) at 298 K in presence CsOH (top) or TlOAc
(bottom). The host solution (top, c = 40.2 µM; bottom, c = 75.4 µM) was placed into the calorimeter cell
(1.4 mL) and 28 successive aliquots (10 µL) of CsOH (top, c = 0.400 mM) and TlOAc (bottom, c =
0.693 mM) were added at 3 min intervals.
Figure S15: Calorimetric titration of 1 in LiOH/H
2O (1 M) at 298 K in presence (or not) of RbCl (top
left), CsOH (top right) or TlOAc (bottom). The host solution (top left, c = 98.2 µM; top right, c = 99.1
µM; bottom, c = 29.8 µM) was placed into the calorimeter cell (1.4 mL) and 28 successive aliquots (10
µL) of RbCl (top left c = 1.029 mM), CsOH (top right, c = 0.986 mM) and TlOAc (bottom, c = 0.493
mM) were added at 3 min intervals.
Figure S16: Thermodynamic parameters
DH
0(kcal/mol),
DS
0(cal/mol/K) and
DG
0(kcal/mol) of the
M
+@1 complexes (M
+= Rb
+, Cs
+, Tl
+) in LiOH/H
2O (0.1 M and 1M), NaOH/H
2O (0.1 M) and KOH/H
2O
(0.1 M) solutions.
Figure S17:
133Cs NMR spectra of the Cs
+@(rac)-1 complex in NaOD/D
2O (0.1 M) at different
temperatures: 278, 288, 298, 308, 318, 328, 338 and 348 K.
Figure S18: ECD spectra recorded at 293 K of MM-1 in LiOH/H
2O (0.1 M) solution (saturated CHCl
3thallium acetate solutions. [Host] was 1.3 10
-5M for a) [Host] was 1.35 10
-5M for b) . ECD spectra for
higher [Cs
+] ([Tl
+]) are identical to that recorded for 1 eq. of Cs
+(Tl
+).
Figure S19: ECD spectra recorded at 293 K of MM-1 in LiOH/H
2O (1 M) in presence of different
amount of a) top spectra: cesium hydroxide. b) bottom spectra: thallium acetate solutions. [Host] was
1.45 10
-5M for a) [Host] was 1.3 10
-5M for b). ECD spectra for higher [Cs
+] ([Tl
+]) are identical to that
recorded for 1 eq. of Cs
+(Tl
+).
Figure S20: ECD spectra recorded at 293 K of MM-1 in KOH/H
2O (0.1 M) solution in presence of
different amount of a) top spectra: cesium hydroxide. b) bottom spectra: thallium acetate solutions.
[Host] was 1.3 10
-5M for a) [Host] was 1.3 10
-5M for b) . ECD spectra for higher [Cs
+] ([Tl
+]) are
identical to that recorded for 1 eq. of Cs
+(Tl
+).
S25 – S28: DFT calculations (Geometry, Energy decomposition analysis, Non Covalent Interaction,
Experimental Section
Separation of the two enantiomers of 6. The two enantiomers of 6 were separated on a
semi-preparative Chiralpak-ID (250 ´ 10 mm) chromatographic column. A mixture of Ethanol/CH
2Cl
2(20:80)
was used as a mobile phase (flow rate: 5 mL/min). UV detection was performed at 254 nm. 550 mg of
racemic compound 6 have been dissolved in 15 mL of dichloromethane and 125 injections (120
µL
every 3 minutes) have been necessary to complete the experiment. The first eluted enantiomer has
been collected between 3.3 and 4 minutes and the second one between 4.4 and 5.6 minutes. 270 mg
of the first eluted enantiomer ((-)-enantiomer) has been isolated with an enantiomeric excess ee
>
99 %. Then, 270 mg, of the second eluted enantiomer ((+)-enantiomer) has been isolated with an
enantiomeric excess ee > 99 %.
Synthesis of compound PP-7. Freshly prepared lithium diphenylphosphide (1 M; 6.2 mL) was added
under argon to a stirred solution of cryptophane MM-6 (250 mg, 0.26 mmol) in THF (3 mL). The red
mixture was stirred for 48 hours at 60°C. Then, it was poured in water. The aqueous phase was
washed five times with CH
2Cl
2(50 mL). The aqueous phase was then collected and cooled to 0°C.
Acidification with conc. HCl solution gives rise to a white precipitate, which was collect on a frit. The
white solid was washed several times with water and dried on air. Finally, the solid was washed with
diethyl ether to give compound MM-1 as a white powder (0.21 g; 97 %). This compound contains trace
of impurities and an additional purification step is necessary. Thus, compound MM-1 (0.21 g, 0.25
mmol) was added in a 25 mL round bottom flask with 7 mL of dry pyridine. The flask was cooled to
0°C. Then, anhydride acetic (1.4 mL) was added under an argon atmosphere. After addition, the flask
was allowed to reach room temperature and the mixture was stirred for 5 hours at room temperature.
Then, the solution was poured in a mixture of CH
2Cl
2and H
2O. The aqueous phase was extracted
three times with CH
2Cl
2. The combined organic phase were washed once with water and then dried
over Na
2SO
4. Evaporation of the solvent under reduced pressure gives rise to a solid residue, which
was purified on silica gel (CH
2Cl
2/Acetone: 90/10). Different fractions were evaporated to give
compound PP-7 as a white glassy solid (0.22 g; 78 %).
1H NMR (300 MHz, CD
2Cl
2, 25°C) δ 6.84 (s, 2
H), 6.90 (s, 4H), 6.85 (s, 1 H), 6.84 (s, 1 H), 6.82 (s, 1 H), 6.81 (s, 1 H), 6.69 (s, 1 H), 6.66 (s, 1 H),
5.15 (m, 1 H), 4.625 (d, J = 13.8 Hz, 4 H), 4.61 (d, J = 13.8 Hz, 2 H), 4.30-3.85 (m, 12 H), 3.51 (d, J =
13.8 Hz, 2 H), 3.495 (d, J = 13.8 Hz, 2 H), 3.49 (d, J = 13.8 Hz, 2 H), 2.34 (s, 9 H; OCH
3), 2.32 (s, 3 H;
OCH
3), 2.31 (s, 3 H; OCH
3), 2.30 (s, 3 H; OCH
3), 2.07 ppm (s, 3 H; OCH
3);
13C NMR (75.4 MHz,
CH
2Cl
2, 25°C) δ 171.4 (2C), 170.1 (4C), 169.9 (2C), 150.4 (2C), 150.3, 150.2, 149.9, 149.6, 141.9
(2C), 141.8, 141.7, 140.6, 140.3, 139.7, 139.4, 139.3, 139.2, 138.7, 138.4, 135.0, 134.9 (2C), 134.6,
133.5, 133.2, 126.2, 126.1, 125.7, 125.6, 125.2, 124.6, 122.0, 121.6, 121.4, 121.3, 115.9, 115.3, 71.9,
70.8 (3C), 70.4, 66.2, 65.7, 37.8, 37.7, 37.4 (4C), 22.2 (6C), 22.0 ppm. The
1H and
13C NMR spectra
of compound MM-7 are identical to that of PP-7.
Synthesis of MM-1. A solution of KOH/H
2O (0.5 M; 7mL) was added in one portion to compound
PP-7 (0.22 g, 0.19 mmol) in THF (PP-7 mL). The mixture was overnight stirred at 50°C under an argon
atmosphere. Then, THF was removed under reduced pressure. 7 mL of water were added and the
flask was cooled to 0°C. Acidification with few drops of conc. HCl gives rise to a white solid, which was
collected on a frit and washed several times with water. The solid was then dried on the frit and
washed with diethyl ether to give compound MM-1 as a beige solid (0.16 g; 98 %).
1H NMR (300 MHz,
DMSO-d
6, 25°C) δ 8.57 (s, 1 H), 8.48 (s, 1 H), 8.43 (s, 1 H), 8.31 (s, 1 H), 8.14 (s, 1 H), 7.91 (s, 1 H),
6.77 (s, 1 H), 6.74 (s, 1 H), 6.69 – 6.62 (m, 8 H), 6.55 (s, 1 H), 6.54 (s, 1H), 5.31 (s, 1 H), 4.50 – 3.70
(m, 18 H), 3.22 (m, 6 H).
13C NMR (75.4 MHz, DMSO-d
6, 25°C) δ 146.4, 146.35, 145.7, 145.6, 145.5,
145.4, 145.3, 145.1, 144.5, 144.3 (2 C), 144.1, 133.9, 133.8, 133.6, 133.5, 133.3 (2 C), 131.1 (2 C),
130.5 (2 C), 129.5, 128.9, 120.2, 119.8, 119.0, 118.1 (2 C), 118.0, 117.6, 117.5, 117.4, 117.0, 116.9,
116.5. 71.5, 70.5, 69.2, 68.5 (3C), 68.2, 68.1, 35.1, 34.9, 34.8 HRMS m/z [M+H]
+calcd. for C
49H
45O
13841.2892 found. 841.2855.
Using the same synthetic approach derivative PP-6 (0.24 g, 0.25 mmol) gives rise to MM-7 (0.2 g;
71 %, 2 steps). In turn, hydrolysis of compound MM-7 under basic solution gives compound PP-1
(0.13 g; 88 %) as a beige solid. Spectroscopic data are identical to those reported for the MM-1
enantiomer.
ECD measurements. ECD spectra were recorded at 293 K using 0.2 cm path length quartz cells. The
concentration of the MM-1 derivative was in the range (5.0 10
-5– 10
-5M) in basic LiOH/H
2O or
KOH/H
2O solutions. Additional ECD spectra were recorded at higher LiOH/H
2O concentration (1 M) or
in the presence of a competitor (saturated LiOH/H
2O solution with CHCl
3). Spectra were recorded in
the 220 – 400 nm spectral range with a 0.5 nm increment and a 1 s integration time. Spectra were
processed with standard spectrometer software and baseline corrected without smoothing. Spectral
units are expressed in difference in molar extinction coefficients.
VCD measurements. The IR and VCD spectra were recorded on a FTIR spectrometer equipped with
a VCD optical bench.
[1]following the experimental procedure previously published.
[2]Samples were
held in a CaF
2cell with a fixed path length of 45 µm. IR and VCD spectra of the two enantiomers of 1
were measured in basic NaOD/D
2O (0.214 M) solution at a concentration of 0.030 M. Additional
spectra were recorded in the presence of a very small amount of CDCl
3and CsOH.
ITC experiments. Isothermal Titration Calorimetry (ITC) experiments were performed at 298 K. In a
typical experiment, the host solution (~ 0.1 mM) in LiOH/H
2O (0.1 M) or KOH/H
2O (0.1 M) was placed
in the calorimeter cell (1.4 mL) and 28 successive aliquots (10 µL) of guest solution (10 times more
concentrated) were added via a computer-automated injector at 3 min intervals. Heat changes were
recorded after each addition. Heats of dilution were measured by a blank experiment (in the absence
of host) under the same conditions, and they were subtracted from the titration data prior to curve
fitting. The first injection was discarded from each data set to remove the effect of guest diffusion
across the syringe tip during the equilibration process. Titration curves were fitted with the one binding
set model. In the case of very high binding for the Cs
+@(rac)-1 and Tl
+@(rac)-1 complexes,
competition experiments were necessary. In our case, RbCl was a good competitor since it shows
lower affinity with host 1. Thus, prior to measure enthalpogram for the Cs
+@1 and the Tl
+@1
complexes, the association constant K and the enthalpy of complexation DH
0of the Rb
+@1 complex
were measured. Additional ITC experiments were performed at higher LiOH/H
2O (1 M) concentration
under the same conditions. In this case, competition experiments were not necessary.
NMR experiments.
133Cs NMR spectra were recorded on an 11.7 T Bruker Avance spectrometer
using a 5 mm broadband probehead. A solution of cesium nitrate was used as a chemical shift
reference (0 ppm). A delay time of 1s was applied between each pulse. At 298 K the delay time was 5
s.
133Cs NMR spectra were also recorded at different temperature (278 - 348 K). The
205Tl NMR
experiments were performed on a Bruker DMX300 spectrometer (7 Tesla) equipped with a 5 mm BB
Nalorac probehead recovered from a 11.7 Tesla spectrometer. First, a solution of thallium nitrate was
used as a chemical shift reference (0 ppm). Then, the other spectra were recorded by part. The
interscan delay was 0.9 s. For all the displayed
205Tl NMR spectra the FIDs were processed by an
exponential window of 200 Hz before Fourier transformation.
DFT Calculations. DFT calculations were performed using the ORCA and ADF program packages.
used in the framework of the zeroth-order regular approximation (ZORA) and all-electron basis sets.
[5]The non-covalent interactions were analyzed and visualized with MULTIWFN and VMD programs.
[6],[7]A comprehensive description of the used methods is provided in Supporting Information.
Analytical chiral HPLC separation for compound 6
Column
Mobile Phase
t
1k
1t
2k
2a
Rs
Chiralpak ID
EtOH/CH
2Cl
220/80
3.84 (-)
0.28
5.33 (+)
0.78
2.79
5.04
Figure S1: Chromatograms (Chiralpak ID, 250
´ 4.6 mm, EtOH/CH
2Cl
2: 20/80, 1 mL/min) of the
collected anti-6 enantiomers after preparative separation on Chiralpak ID (250 ´ 10 mm, EtOH/CH
2Cl
2:
20/80, 5 mL/min) by 120 injections of 4.4 mg of racemate. Detection by UV-vis spectroscopy at 254
nm (black chromatograms) and CD spectroscopy at 254 nm (red chromatograms).
0 1 2 3 4 5 6 7 8 UV 254 nm CD 254nm 3.79 0 1 2 3 4 5 6 7 8 5.31 UV 254 nm CD 254nm Minutes Minutes (-) (+) O O O H3CO H3CO OCH3 O O O OCH 3 OCH3 H3CO O MM-(-) OCH3 OCH3 H3CO O O H3CO H3CO OCH3 O O O O O PP-(+)
Conc.
[a]MM-6
0.24
-204.9
-216.2
-249.5
-454.7
-835.0
PP-6
0.22
+200.2
+210.0
+239.5
+443.0
+820.0
[a]
g/100 mL.
Figure S2: ECD spectra of compound MM-6 and PP-6 recorded in CHCl
3(a: top spectrum; c = 1.12
10
-4M - 9.04 10
-5M) and in CH
2Cl
2(b: bottom spectrum; c = 9.41 10
-5M – 8.88 10
-5M ). Polarimetric
measurements of compounds MM-6 and PP-6 recorded at 25°C in CHCl
3.
235 260 285 310 335 360 385 0 20 40 60 80 -20 -40 -60 -80