Publisher’s version / Version de l'éditeur:
Journal of Fuel Cell Science and Technology, 7, 2, pp. 021009-1-021009-14,
2010-04-01
READ THESE TERMS AND CONDITIONS CAREFULLY BEFORE USING THIS WEBSITE. https://nrc-publications.canada.ca/eng/copyright
Vous avez des questions? Nous pouvons vous aider. Pour communiquer directement avec un auteur, consultez la première page de la revue dans laquelle son article a été publié afin de trouver ses coordonnées. Si vous n’arrivez pas à les repérer, communiquez avec nous à PublicationsArchive-ArchivesPublications@nrc-cnrc.gc.ca.
Questions? Contact the NRC Publications Archive team at
PublicationsArchive-ArchivesPublications@nrc-cnrc.gc.ca. If you wish to email the authors directly, please see the first page of the publication for their contact information.
NRC Publications Archive
Archives des publications du CNRC
This publication could be one of several versions: author’s original, accepted manuscript or the publisher’s version. / La version de cette publication peut être l’une des suivantes : la version prépublication de l’auteur, la version acceptée du manuscrit ou la version de l’éditeur.
For the publisher’s version, please access the DOI link below./ Pour consulter la version de l’éditeur, utilisez le lien DOI ci-dessous.
https://doi.org/10.1115/1.3177448
Access and use of this website and the material on it are subject to the Terms and Conditions set forth at
Numerical analysis of water transport through the membrane
electrolyte assembly of a polymer exchange membrane fuel cell
Zhang, Xu; Song, Datong; Wang, Qianpu; Huang, Cheng; Liu, Zhong-Sheng;
Shah, A. A.
https://publications-cnrc.canada.ca/fra/droits
L’accès à ce site Web et l’utilisation de son contenu sont assujettis aux conditions présentées dans le site
LISEZ CES CONDITIONS ATTENTIVEMENT AVANT D’UTILISER CE SITE WEB.
NRC Publications Record / Notice d'Archives des publications de CNRC:
https://nrc-publications.canada.ca/eng/view/object/?id=cd73826a-b16e-4152-a803-34bc759770f0
https://publications-cnrc.canada.ca/fra/voir/objet/?id=cd73826a-b16e-4152-a803-34bc759770f0
Xu Zhang
1 e-mail: xu.zhang@nrc.gc.caDatong Song
Qianpu Wang
Cheng Huang
Zhong-Sheng Liu
Institute for Fuel Cell Innovation, National Research Council Canada, 4250 Wesbrook Mall, Vancouver, BC, V6T 1W5, Canada
A. A. Shah
School of Engineering Sciences, Southampton University, Southampton SO171BJ, UK
Numerical Analysis of Water
Transport Through the Membrane
Electrolyte Assembly of a
Polymer Exchange Membrane
Fuel Cell
The effects of water transport through membrane electrolyte assembly of a polymer exchange membrane fuel cell on cell performance has been studied by a one-dimensional, nonisothermal, steady-state model. Three forms of water are considered in the model: dissolved water in the electrolyte or membrane, and liquid water and water vapor in the void space. Phase changes among these three forms of water are included based on the corresponding local equilibriums between the two involved forms. Water transport and its effect on cell performance have been discussed under different operat-ing conditions by usoperat-ing the value and the sign of the net water transport coefficient, which is defined by the net flux of water transported from the anode side to the cathode side per proton flux. Optimal cell performance can be obtained by adjusting the liquid water saturation at the interface of the cathode gas diffusion layer and flow channels. 关DOI: 10.1115/1.3177448兴
Keywords: proton exchange membrane fuel cell, membrane electrolyte assembly, water transport, fuel cell model, net water transport coefficient
1 Introduction
Successful water management in the proton exchange mem-brane共PEM兲 fuel cell plays a critical role in terms of reducing the mass transport limitation. Too much water causes flooding in the cathode region, which inhibits oxygen from diffusing to the reac-tion sites of the cathode catalyst layer of a PEM fuel cell. On the other hand, too little water makes the membrane dry out and re-sults in lower proton conductivity because the membrane’s trans-port properties are highly dependent on water content. One com-mon phenomenon occurring in a PEM fuel cell is that cell performance is low under low humidity conditions. Cell perfor-mance gradually improves with an increase in humidity. Once the humidity and liquid water saturation reach certain values, cell performance cannot be improved anymore. Instead, further in-creases in humidity and liquid water saturation will reduce cell performance.
Numerous researchers have studied improvement to PEM fuel cell performance through experiments, modeling, and optimiza-tion design 关1–5兴. A mathematical model is a powerful tool to understand water transport in PEM fuel cells关6兴. Water in a PEM fuel cell either is generated in the cathode catalyst layer as a result of oxygen reduction reaction共ORR兲 or can be brought in by hu-midified gaseous reactants. Water may desorb/adsorb in electro-lyte or membrane, or condense/evaporate between vapor and liq-uid phases, depending on the operating conditions of the cell. Most of previous developed PEM fuel cells or cell component models are single-phase models that consider the total water amount without distinguishing liquid water from water vapor 关7–11兴. These models are valid for low liquid water saturation conditions and are suitable for PEM fuel cell simulation under low humidity. However, when the PEM fuel cell operates in a fully
humidified condition, the gaseous reactants inside the fuel cells become oversaturated and water vapor may condense into liquid water, resulting in a possibly high performance loss due to mass transport limitation. In single-phase models, the effect of liquid water on cell performance cannot be investigated, which is critical for PEM fuel cell operation, especially in high current density range. Therefore, numerous two-phase models have been devel-oped to take into account liquid water transport in PEM fuel cells 关12–27兴. Previous published two-phase models are able to predict cell performance, as well as the distributions of liquid water satu-ration and gaseous reactants in the cell. However, most of the parametric studies carried out in these two-phase models did not clearly show the above evolution of cell performance with the variation of liquid water condition in the cathode side of a PEM fuel cell.
Bernardi and Verbrugge 关12兴 developed the hydraulic model with assumptions that the membrane is fully hydrated with liquid water. They analyzed the effects of different operating conditions on water balance in fuel cells. However, this model is not suitable for a partially dry membrane. Recently, Janssen关13兴 developed a two-dimensional phenomenological model based on concentrated solution theory to describe the transport of water in the mem-brane, and of water vapor and liquid water in the electrodes. This model gave a clear description of water transport in a partially dry membrane as well as in a fully hydrated membrane, but it was a water transport model only and did not couple with a cell model to thoroughly understand the effect of water transport on cell perfor-mance. Therefore, to further understand water transport through the membrane electrolyte assembly共MEA兲 of a PEM fuel cell, a model should include two-phase transport in the electrodes and gas diffusion layers, describe fully water transport in a cell oper-ating with saturated and unsaturated gases, and couple with a cell model.
More recently, a number of multidimensional, multiphase, and nonisothermal models have been published. Berning and Djilali 关21兴 developed a 3D, two-phase model considering momentum
1Corresponding author.
Manuscript received March 3, 2008; final manuscript received October 31, 2008; published online January 6, 2010. Review conducted by Abel Hernandez.
transport in the liquid and gas phases through separate transport equations and including exchange terms between phases. How-ever, they treated catalyst layer as an interface without thickness. Wang and Wang 关28兴 expended their multiphase mixture 共M2兲 model to a 3D, nonisothermal two-phase model, where each spe-cies or phase in the porous electrode is modeled by a separate mass conservation equation, but one momentum equation is solved to get the mixture velocity. They do not include mass trans-port between phases. Siegel et al.关17兴 presented a 2D model to account for the transport of liquid water in the electrode and treat all three forms of water as a separate phase and allow mass trans-port among them. However, Schroeder’s paradox was neglected. Steinkamp et al. 关29兴 presented a 2D dynamic two-phase flow model accounting for all important transport processes in a PEM fuel cell. Unfortunately, the computational cost for simulation was quite high because of the high complexity of the model.
Overall, the focus of this paper is to formulate a model that accounts for most of the important transport processes in a PEM fuel cell with 1D simplification. Using this one-dimensional, nonisothermal, two-phase, steady-state model, we numerically studied the effect of liquid water saturation on cell performance to capture the whole picture of water transport by changing the boundary conditions of liquid water saturation at the cathode side of the cell. The water balance is characterized by the net water flux per proton flux from the anode side through the membrane to the cathode side. Based on the value and sign of the net water flux through the MEA, we analyzed cell performances under different operating conditions and obtained the optimal cell performance by adjusting liquid water saturation at the interface of a cathode gas diffusion layer共GDL兲 and channels.
2 Model Description
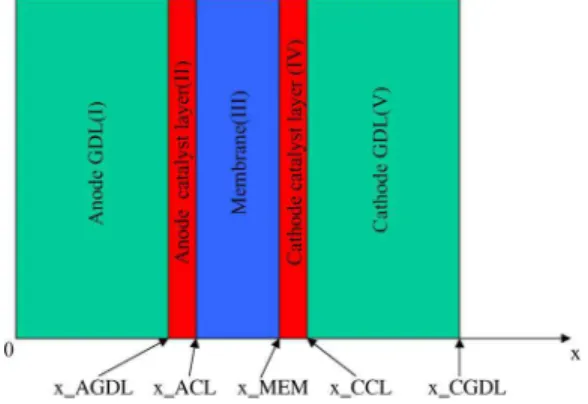
The model presented here is a one-dimensional, two-phase, nonisothermal model of a cell sandwich including five subdo-mains: anode and cathode gas diffusion layers, anode and cathode catalyst layers, and membrane. A schematic of the model domain is showed in Fig. 1. A fuel cell is a complex system coupling transport processes and the electrochemical reaction. For simplic-ity, we made the following assumptions.
共1兲 The PEM fuel cell operates under steady state.
共2兲 A one-dimensional approximation is used in the model for-mulation by neglecting the variation of reactant concentra-tions in flow channels.
共3兲 Gas species 共O2, H2, N2, and water vapor兲 diffuse through
the pores of the GDLs and catalyst layers共CLs兲. O2and H2
also dissolve into electrolyte as species.
共4兲 Three types of water are considered: dissolved water in the electrolyte/membrane, water vapor, and liquid water in pores. The mass transports among these three types of
wa-ter are dictated by the deviation from the local equilibrium. Dissolved water transport in the electrolyte is assumed through diffusion and electro-osmotic drag.
共5兲 Generated water from ORR in the cathode catalyst layer is either in liquid or in vapor form, depending on the local vapor pressure.
共6兲 Agglomerate model is employed in both anode and cathode catalyst layers.
共7兲 Gas species and liquid water cannot penetrate the membrane.
2.1 Model Equations. To thoroughly understand water trans-port through the whole MEA, we should use a two-fluid, multi-component model to solve individual transport equations for each phase and specie. Abriola and Pinder关30兴 developed a full system of conservation equations. Here we adopted Abriola and Pinder’s general equation systems关30兴 to the five subdomains of our model by modifying the source/sink terms to reflect the corresponding physical phenomena in each subdomain. Based on the conserva-tion principles of mass, momentum, energy, specie, and charge, the general governing equations can be obtained as follows.
2.1.1 Mass Conservation of Each Specie in Gas Phase. Tak-ing into account electrochemical reaction, diffusion, and convec-tion, the mass conservation equations are given as
d dx共ugCj兲 = d dx
冋
i共1 − s兲Dj effdCj dx册
− Sj 共1兲 where s is the water saturation and defined as the volume fraction of liquid water in the total void space of the porous media, iisthe porosity of subdomain i, and i苸 兵cathode GDL and CL, and anode GDL and CL其. j苸共O2, H2, N2, V兲 and x is the coordinate
from the anode side to the cathode side. Cjand Djeffdenote the
concentrations and the effective diffusion coefficients of each gas specie in the pore space, respectively. ugis the superficial velocity of gas phase. Sjis the source/sink term for each gas specie.
Be-cause the terms of inertial and bulk viscous can be neglected, we assumed that the gas velocity followed Darcy’s law
ug= −
Kikrg
g
dpg
dx 共2兲
where Ki is the absolute permeability of subdomain i, krg is the
relative permeability of gas phase, gis the dynamic viscosities of gas phase, and pgis the partial pressure of gas phase. Here, gas
phase denotes the mixture of oxygen, nitrogen, and water vapor at the cathode side, and the mixture of hydrogen and water vapor at the anode side. Using the ideal gas law,
pg=
再
共CO2+ CN2+ CV
c兲RT at the cathode GDL and CL
共CH2+ CV a兲RT
at the anode GDL and CL
冎
共3兲 Source terms SO2and SH2are zero at the cathode and anode GDLbecause of no electrochemical reaction. However, SO2and SH2are
the oxygen consumption at the cathode CL and the hydrogen con-sumption at the anode CL, which are related to the cathode and anode reaction rates.
SO2= 1 4兩RRc兩 共4兲 SH2= 1 2兩RRa兩 共5兲
where RRc and RRaare the reaction rates of the ORR and the
hydrogen oxidation reaction共HOR兲, and given by Bulter–Volmer law as
RRk= akij ref F
冉
Cj,e s Cj ref冊
N,k共e␣aFk /RT − e−␣cFk/RT兲 共6兲where j = O2and k = c or j = H2and k = a. iOref2and iHref2are the
cath-ode and ancath-ode exchange current densities and are estimated by关1兴 iO2 ref = 1 ⫻ 10−3exp
冋
73,269 R冉
1 303− 1 T冊
册
共7兲 iH2 ref = 1 ⫻ 101exp冋
9500 R冉
1 303− 1 T冊
册
共8兲 CO 2 ref and C H2ref are the oxygen and hydrogen reference
concentra-tions, ␣cand ␣aare the cathodic and anodic transfer coefficients, R is the universal gas constant, and c and a are the surface
overpotentials for the cathode and anode sides, respectively.
c= − − U0, a= − 共9兲
where U0is the open circuit potential and is given by关31兴
U0= 1.23 − 0.9 ⫻ 10−3共T − 298.15兲 共10兲
ac and aa are the surface areas of catalyst per unit volume of
catalyst layer ak= ak Pt mk Pt Ptk eff/ Lk, k 苸 c,a 共11兲
where akPt共m2kg−1兲 is the specific Pt surface area, mkPtis the Pt loading, Ptkeffis the utilization rate of specific Pt surface area, and Lkis the thickness of the catalyst layer.
akPt= 3/共rPtPt兲 共12兲
where rPtis the platinum radius and Ptis the density of platinum. In the Butler–Volmer expressions, Eq.共6兲, CO
2,e s and CH 2,e s are oxygen and hydrogen concentrations at the surface of agglomer-ates where the reaction takes place. They are related to the bulk values共CO2,eand CH2,e兲. According to Henry’s law,
CO2,e= HO2CO2, CH2,e= HH2CH2 共13兲
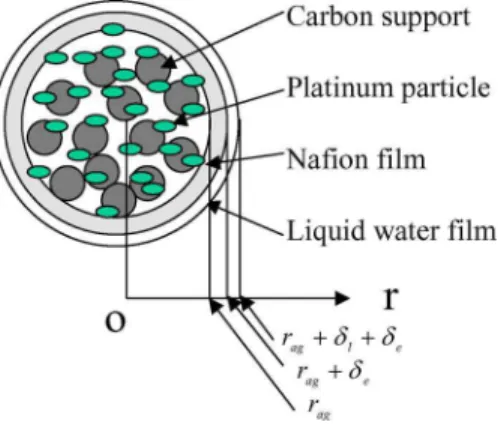
We denote Ninas the nafion volume fraction inside the agglomer-ate, and ais the total volume fraction of carbon, Pt, and small
pores inside the agglomerates. If the thickness of the electrolyte thin film that covers the agglomerate is␦e, the agglomerate radius
is rag, then the number of agglomerates per unit volume of the catalyst layer is
N=共a+ N
in兲/
共
4 3rag3
兲
共14兲The nafion film volume fraction, Nf, is N
f
=43关共rag+␦e兲3− rag 3
兴N 共15兲
Then the total nafion volume fraction is the sum of the volume fractions of nafion inside the agglomerates and the nafion thin film,
N= N
in
+ N
f 共16兲
Therefore, the porosity of the catalyst layers should be CL= 1 − a−共N
in
+ N
f兲 共17兲
When liquid water covers the agglomerates, the thickness of the liquid water film␦lis
␦l=
冤
共rag+␦e兲3+ sCL 4 3N冥
1/3 −共rag+␦e兲 共18兲The total film thickness would be␦=␦e+␦l.
We assumed that reactants diffuse in the electrolyte according to Fick’s law of diffusion. First we consider one agglomerate in
the cathode catalyst layer as shown in Fig. 2. For spherical diffu-sion, the quantity of diffusing oxygen, which passes through the spherical wall per unit time, is given by关32兴
q= 4DO2
w 共rag+␦l+␦e兲共rag+␦e兲
␦l
共CO2,e− Cw−e兲
in the water film 共19兲 and
q= 4DO2
e 共rag+␦e兲rag
␦e
共Cw−e− CO2,e
s 兲 in the nafion film
共20兲 where Cw−eis the concentration of oxygen at the interface of the
water film and the nafion film. DO
2
w and D
O2
e are the diffusivities of
oxygen in water and electrolyte, respectively. By summation of Eqs.共19兲 and 共20兲, we get
q= O2共CO2,e− CO2,e s 兲 共21兲 where we define O2= we w+ e 共22兲 w= 4DO2 w 共rag+␦l+␦e兲共rag+␦e兲 ␦l 共23兲 e= 4DO2 e 共rag+␦e兲rag ␦e 共24兲 Because the number of agglomerates per unit volume is N, the total quantity of diffusing oxygen, which passes through the water film and the nafion film per unit time, is Nq. We assumed that the total quantity of diffusing oxygen was consumed in the agglom-erate. Therefore,
NO2共CO2,e− CO2,e
s 兲 =1
4兩RRc兩 共25兲
Similar to the cathode catalyst layer, because no water is gener-ated in the anode catalyst layer,
H2= 4DH2 e 共rag+␦e兲rag ␦e 共26兲 and NH2共CH2,e− CH2,e s 兲 =1 2兩RRa兩 共27兲 where DH 2
e is the diffusivity of hydrogen in the electrolyte.
SVis the source/sink for water vapor. At the GDLs, water vapor
only comes from phase change SV= Se/c. When local water vapor pressure pV= CVRT larger than the saturation pressure of water
vapor psat, water vapor will condensate to liquid water. Otherwise, liquid water will evaporate to water vapor. The term Se/cdue to
the evaporation and condensation is given by关14,18兴
Se/c=
冦
e isl Wl 共psat− pV兲 pV⬍ psat c i共1 − s兲XV RT 共psat− pv兲 pVⱖ psat冧
共28兲where eand care the evaporation and condensation rate
con-stants, psat is the saturation pressure of water vapor, XV is the molar fraction of water vapor, and
XV,c= CV c CO2+ CN2+ CV c, XV,a= CV a CH2+ CV a 共29兲
At the cathode catalyst layer, water vapor comes from three parts: evaporation/condensation term due to phase change Se/c, absorption/desorption term Sd/v, and water production term due to
the chemical reaction Spw.
SV= Se/c+ ␥d/vSd/v+␥e/cSpw 共30兲
Spw=
冦
1
2兩RRc兩 cathode catalyst layer 0 anode catalyst layer
冧
共31兲 where ␥ is the switch function and will be discussed in Sec. 2.1.5. We assumed that the mass transfer term Sd/vbetween vapor and dissolved water was driven by concentration gradient Cd− Cd*,v
关23兴,
Sd/v=
再
ha,v共Cd− Cdⴱ,v兲共1 − s兲 Cd⬍ Cdⴱ,v
hd,v共Cd− Cdⴱ,v兲共1 − s兲 Cd⬎ Cdⴱ,v
冎
共32兲 where ha,vand hd,vare the mass transfer coefficients for
absorp-tion and desorpabsorp-tion of water vapor, Cd is the concentration of
dissolved water, and is the water content. Cdⴱ,vis the
concentra-tion of dissolved water in equilibrium with water vapor and re-lated to the vapor equilibrium water content v
ⴱ关7兴 as follows: Cdⴱ,v= m,dry Wm,dry v ⴱ 共33兲
where m,dryis the dry membrane density and Wm,dryis the dry
membrane equivalent weight. Hinatsu et al.关33兴 got the relation-ship between the vapor equilibrium water content and the water vapor activity awat 80° C as follows:
v ⴱ= 0.3 + 10.8a w− 16aw 2 + 14.1aw 3 共34兲 and aw= CVkRT psat , k 苸 共c,a兲 共35兲 2.1.2 Mass Conservation of Liquid Water. According to mass conservation equation of liquid phase,
d
dx共lul兲 = ml 共36兲 where mlrepresents the interfacial mass transfer rates from other
phases to liquid phases. If Wlis the molar mass of water ml=
再
关− Se/c+ ␥d/lSd/l+共1 − ␥e/c兲Spw兴Wl CLs
− Se/cWl GDLs
冎
共37兲 In a similar fashion to Sd/v, mass transfer term between liquid and dissolved water, Sd/l, is关23兴
Sd/l=
再
ha,l共Cd− Cdⴱ,l兲 Cd⬍ Cdⴱ,l
hd,l共Cd− Cdⴱ,l兲 Cd⬎ Cdⴱ,l
冎
共38兲 where ha,land hd,lare the mass transfer coefficients for absorption and desorption of liquid water in electrolyte, and Cdⴱ,lis the
con-centration of dissolved water in equilibrium with liquid water and related to the liquid equilibrium water content lⴱby
Cdⴱ,l=
m,dry
Wm,dry
lⴱ 共39兲
The water content at liquid equilibrium has the value of 22. ulis the superficial velocity of liquid. We also assumed that the
liquid velocity followed Darcy’s law ul= −
Kikrl
l
dpl
dx 共40兲
where krl is the relative permeability of liquid phase, l is the
dynamic viscosity of liquid phase, and plis the partial pressure of liquid phase.
By introducing capillary pressure, the liquid water pressure pl
can be replaced and the mass conservation equation for liquid water, Eq.共36兲, can be transformed into an equation in which the liquid water saturation s needs to be solved.
Capillary pressure is defined as the difference between gas pres-sure and liquid prespres-sure,
pc= pg− pl 共41兲
Substituting Eq.共40兲 into Eq. 共36兲 with Eq. 共41兲 results in − d dx
冋
l Kikrl l冉
dpg dx − dpc ds ds dx冊
册
= ml 共42兲 2.1.3 Electronic and ionic charge transfers.− d dx
冉
c 3/2 c d dx冊
= S,i 共43兲 − d dx冉
N 3/2 e d dx冊
= S,i 共44兲 where is the electronic potential in carbon phase, is the pro-tonic potential in electrolyte or membrane phase, cand eare theelectron and proton conductivities, c is the volume fraction of carbon phase, Nis the volume fraction of nafion, and Sand S
are the source/sink terms of electron and proton, respectively. S=
再
− FRRc cathode catalyst layer
FRRa anode catalyst layer
冎
共45兲
S=
再
FRRc cathode catalyst layer
− FRRa anode catalyst layer
冎
共46兲 2.1.4 Mass Balance for Dissolved Water in the Electrolyte. We assumed that water transport through membrane or electrolyte by diffusion and electro-osmotic drag. The mass balance for dis-solved water in the electrolyte is written as follows:
− d dx
冉
Dd dCd dx冊
− d dx冉
nd e eff F d dx冊
= Md 共47兲 where Cdis the water diffusivity in electrolyte, Cdis the concen-tration of dissolved water in electrolyte, ndis the electro-osmoticdrag coefficient, which is related to the water content of electro-lyte by nd=共2.5/22兲 关7兴. F is Faraday’s constant, and Mdis the interfacial mass transfer from liquid water or water vapor to dis-solved water. In membrane, Md= 0. In the anode and cathode
Md= − ␥d/vSd/v− ␥d/lSd/l 共48兲
where ␥ is the switch function and will be discussed in Sec. 2.1.5. 2.1.5 Switch Function of Mass Transfer Among the Phases (Liquid Water, Water Vapor, and Dissolved Water). The model developed here assumes that the three phases of water, liquid wa-ter, vapor, and dissolved wawa-ter, are in local equilibrium. The driv-ing forces from liquid water to vapor, liquid water to dissolved water, and water vapor to dissolved water are the relative humid-ity RH = pv/psat, the deviation of Cdfrom Cdⴱ,l, and the deviation of
Cdfrom Cdⴱ,v, respectively. When RH ⬎ 1, the vapor pressure
ex-ceeds the saturation pressure, the produced water from the ORR becomes a source term in liquid water equation, i.e., ␥e/v= 0;
oth-erwise, ␥e/v= 1.
In this paper, we adopted a critical saturation value of liquid water关23兴, denoted by sⴱ, and set to be the value of the immobile
saturation. When liquid water saturation is under sⴱ, water
drop-lets are in the noncontiguous status. Based on this value, we de-fine two switch functions to describe the mass transfer from vapor or liquid to dissolved water. When the local liquid saturation is smaller than sⴱ, liquid water is immobile and has less chance to
contact with electrolyte; the processes of absorption and desorp-tion between liquid phase and dissolved phase are off, i.e.,␥d/l
= 0; while the process of absorption and desorption between vapor phase and dissolved phase is on, i.e., ␥d/v= 1. When local liquid saturation is larger than sⴱ, liquid water droplets connect together
and cover the agglomerates; the transfer route from water vapor to dissolved water is closed, ␥d/v= 0; while the processes of
absorp-tion and desorpabsorp-tion between liquid phase and dissolved phase are on, ␥d/l= 1. Figure 3 shows these processes clearly. The mass transfer coefficients between liquid or vapor and dissolved are given in Table 2.
2.1.6 Energy Conservation in Liquid and Gas Phases. We as-sumed that gas phase, liquid phase, and solid phase participate in energy transfer and local thermal equilibrium among these three phases, that is, Tg= Tl= Ts= T. The conversation equation is as
fol-lows: − d dx
冉
ki effdT dx冊
+ d dx共lcp l ulT+ gcp g ugT兲 = Q 共49兲where kieffstands for the effective thermal conductivity of subdo-mains i, and Q is the sum of the volumetric heat source/sink, including Ohmic heat, irreversible electrochemical reaction heat, entropic reaction heat, and phase change heat.
Q=
冦
QOhmc
+ QOhm
c
+ Qentropic+ Qreaction+ Qe/c CLs
QOhm c + Qe/c GDLs QOhm c membrane
冧
共50兲 Each heat source/sink term is expressed as follows:QOhm c =
冦
共1 − g兲3/2c冉
d dx冊
2 GDLs c 3/2 c冉
d dx冊
2 CLs冧
共51兲 QOhm e =冦
e冉
d dx冊
2 membrane CL 3/2 e冉
d dx冊
2 CLs冧
共52兲 Qentropic=冦
⌬scT 4 RRc cathode CL ⌬saT 2 RRa anode CL冧
共53兲 Qreaction=再
− FcRRc cathode CL − FaRRa anode CL冎
共54兲 Qe/c= hglSe/v 共55兲where hglis the liquid-vapor enthalpy change, and ⌬sc and ⌬sa are the entropies associated with ORR and HOR, respectively.
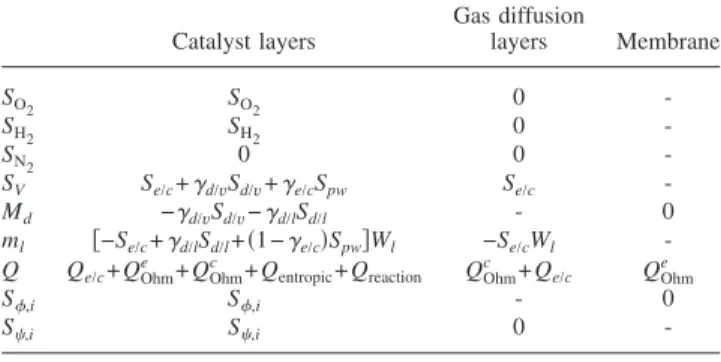
In summary, the expressions of the source/sink terms of the model equations in different subdomains are listed in Table 1.
2.2 Constitutive Relations
2.2.1 Effective Diffusion Coefficient. Bruggeman relation is used here to estimate the effective diffusion coefficients of gas species in porous media, respectively.
Djeff= i1.5Dj, j 苸 O2,H2,N2, and V 共56兲
where the bulk diffusivities are temperature and pressure depen-dent关34兴 DO2= 3.8 ⫻ 10 −9 T1.5/pg 共57兲 DH2= 1 ⫻ 10−9T1.5/pg 共58兲 DN2= 3.6 ⫻ 10−9T1.5/pg 共59兲 DV= 4.1 ⫻ 10−9T1.5/pg 共60兲
The diffusivity of oxygen through the electrolyte has the follow-ing form关35兴:
DO2
e
= 3.1 ⫻ 10−7e−2768/T 共61兲
and the diffusivity of hydrogen through the electrolyte is taken a constant value, shown in Table 2.
The diffusivity of dissolved water through the electrolyte is related to the water content and temperature关36兴
Dd=
再
3.1 ⫻ 10−7共e0.28− 1兲e−2436/T 0 ⬍ ⬍ 3
4.17 ⫻ 10−8共1 + 161e−兲e−2436/T 3 ⬍ ⬍ = 22
冎
共62兲 2.2.2 Permeability. The absolute permeability can be approxi-mated by Kozeny–Carman lawKi= di 2 i 3 16kK共1 − i兲 2, i 苸 different subdomains 共63兲
where kK is a Kozeny–Carman constant and diis the mean pore
diameter of subdomain i.
The relative permeabilities of liquid and gas phases are related to the liquid water saturation as关15兴
krl= s3 and krg=共1 − s兲3 共64兲
2.2.3 Capillary Pressure. The capillary pressure is given by 关16兴
pc= cos i
冑
i
Ki
I共s兲 共65兲
where is the surface tension, iis the contact angle of
subdo-main i, and I共s兲 is the Leverett function and estimated as I共s兲 =
再
1.417共1 − s兲 − 2.21共1 − s兲 2+ 1.263共1 − s兲3 i⬍ 90 deg 1.417s − 2.21s2+ 1.263s3 i⬎ 90 deg冎
共66兲 2.2.4 Membrane Conductivity. The membrane conductivity is highly dependent on the water uptake of the membrane and given by Springer et al.关7兴 as e= exp冉
1268冉
1 303− 1 T冊冊
共0.514 − 0.326兲 共67兲 e eff = N1.5e 共68兲2.2.5 Properties of Gas and Liquid Phases. The enthalpy of water evaporation hgl共J/mol兲 as a function of temperature is fitted
based on the data in关37兴 hgl= 3.5912 ⫻ 10
4
− 2.4253 ⫻ 102T+ 1.4453T2− 2.6968 ⫻ 10−3T3+ 3.5228 ⫻ 10−6T4− 1.872 ⫻ 10−9T5 共69兲
The density of gas mixture can be expressed as
g k = pg k兺 j Xj k Wj k RT 共70兲 where Xkj= Cj 兺 j Cj 共71兲 The dynamic viscosities of gas mixture are
g k = 兺 j Xj k j
冑
Wj 兺 j Xj k冑
Wj 共72兲 when k = c, then j = O2, N2, and V, or when k = a, then j = H2and V. 2.3 Boundary Conditions. According to our assumptions, gas species and liquid water cannot penetrate the membrane and then their fluxes should be zero at the interfaces of the anode CL and the membrane, and the membrane and the cathode CL, re-spectively.冏
dCO2 dx冏
x=x_MEM =冏
dCN2 dx冏
x=x_MEM =冏
dCV dx冏
x=x_MEM =冏
ds dx冏
x=x_MEM = 0 共73兲 and冏
dCH2 dx冏
x=x_ACL =冏
dCV dx冏
x=x_ACL =冏
ds dx冏
x=x_ACL = 0 共74兲 Since there is no proton conducting material in either the anode GDL or the cathode GDL, the proton fluxes at the interfaces be-tween the GDLs and the CLs should be zero,Table 1 Source/sink terms
Catalyst layers Gas diffusion layers Membrane SO2 SO2 0 -SH2 SH2 0 -SN2 0 0
-SV Se/c+␥d/vSd/v+␥e/cSpw Se/c
-Md −␥d/vSd/v−␥d/lSd/l - 0
ml 关−Se/c+␥d/lSd/l+共1−␥e/c兲Spw兴Wl −Se/cWl
-Q Qe/c+ QOhm
e + Q
Ohm
c + Q
entropic+ Qreaction QOhm
c + Q
e/c QOhm
e
S,i S,i - 0
-Table 2 Physical parameters and properties
Symbol Definition Value/Reference
Physical constant and properties
F Faraday’s constant共C mol−1兲 96,485
Rg Universal gas constant共J mol−1K−1兲 8.314
WO2 Molar mass of oxygen共kg mol−1兲 0.032
WN2 Molar mass of nitrogen共kg mol−1兲 0.028
Wl Molar mass of water共kg mol−1兲 0.018
WH2 Molar mass of hydrogen共kg mol−1兲 0.002
l Liquid water density共kg m−3兲 1,000
Fixed charge site concentration of nafion共mol m−3兲 1,800
⌬sc Entropy of ORR共J mol−1K−1兲 326.36
⌬sa Entropy of HOR共J mol−1K−1兲 ⫺0.208
kc Thermal conductivity of catalyst layer共W m−1K−1兲 0.27关39兴
kg Thermal conductivity of GDL共W m−1K−1兲 1.7关39兴
km Thermal conductivity of membrane共W m−1K−1兲 0.12关39兴
lCp
l Heat capacitance共liquid water兲 共J m−3K−1兲 4.13⫻ 106
Cg
p Specific heat capacity of air共J kg−1K−1兲 1.01⫻ 103
l Dynamic viscosity of liquid water共kg m−1s−1兲 1 ⫻ 10−4
Surface tension of liquid water共N m−1兲 0.07
O2 Dynamic viscosity of oxygen共kg m−1s−1兲 2.34⫻ 10−5
N2 Dynamic viscosity of nitrogen共kg m−1s−1兲 2.01⫻ 10−5
v Dynamic viscosity of water vapor共kg m
−1s−1兲 1.2⫻ 10−5
H2 Dynamic viscosity of hydrogen共kg m−1s−1兲 9.93⫻ 10−6
kK Kozeny–Carman constant 6
Pt Density of platinum共kg m−3兲 21,450
m,dry Density of dry membrane共kg m−3兲 2,000
Wm,dry Equivalent weight共kg mol−1兲 1.1
DH2
e
Diffusivity of hydrogen in the electrolyte共m2s−1兲 7.9⫻ 10−10
c Conductivity of carbon phase共S m−1兲 1,000
Geometry properties
L Catalyst layer thickness共m兲 25
Lm Membrane thickness共m兲 50
LG GDL thickness共m兲 200
g Porosity of GDL 0.75
a Total volume fraction of carbon, Pt, and small pores 0.3
N
in
Nafion volume fraction located inside agglomerates 0.1 c Carbon volume fraction in catalyst layer 0.2
rag Agglomerate radius共nm兲 200
␦e Thickness of nafion layer coating agglomerates共nm兲 15
a
g Contact angle of GDL 110 deg关1兴
c Contact angle of CCL 82 deg关1兴
dc Mean pore size in CCL共m兲 1
a
dg Mean pore size in GDL共m兲 10
a
rPt Platinum radius共nm兲 2
Electrochemical properties
␣c Cathodic transfer coefficient 1
␣a Anodic transfer coefficient 1
CO2
ref Oxygen reference concentration共mol m−3兲 1.18关17兴
CH2
ref Hydrogen reference concentration共mol m−3兲 22.6关17兴
Ptc
eff
Utilization rate of specific Pt surface area 0.5 Pta
eff
Utilization rate of specific Pt surface area 0.5
mc
Pt
Platinum loading on the cathode共kg m−2兲 4 ⫻ 10−3
ma
Pt
Platinum loading on the anode共kg m−2兲 4 ⫻ 10−3
Transport properties
HO2 Oxygen Henry’s law constant共dimensionless兲 0.64关17兴
HH2 Hydrogen Henry’s law constant共dimensionless兲 0.19关17兴
c Condensation constant共s−1兲 100关14兴
a Evaporation constant共atm−1s−1兲 100关14兴
hd,l Desorption coefficient between dissolved/liquid共s−1兲 3 a
ha,l Adsorption coefficient between dissolved/liquid共s−1兲 0.1 a
hd,v Desorption coefficient between dissolved/vapor共s−1兲 0.1 a
ha,v Adsorption coefficient between dissolved/vapor共s−1兲 0.01 a
DO2
w Oxygen diffusivity in liquid water共60°C兲 共m2s−1兲 4.82⫻ 10−9关14兴
DH2
e Hydrogen diffusivity in nafion共m2s−1兲 1 ⫻ 10−10关14兴
冏
ddx
冏
x=x_AGDL=
冏
d dx冏
x=x_CCL= 0 共75兲 Similarly, the dissolved water only exists in membrane or electro-lyte; its flux must be zero at the interfaces between GDLs and CLs.
冏
dCd dx冏
x=x_AGDL =冏
dCd dx冏
x=x_CCL = 0 共76兲 Since the membrane is not an electron conducting material, the fluxes of electrons at the interfaces between the CLs and mem-brane are zero.冏
d dx冏
x=x_ACL=
冏
d dx冏
x=x_MEM= 0 共77兲 At the interface between the cathode/anode flow channels and the cathode/anode GDL, the concentration of each gas species is pre-scribed as follows:
Cj兩x=x_CGDL= Cj,mean, j 苸 O2,N2,V 共78兲
Cj兩x=0= Cj,mean, j 苸 H2,V 共79兲
where subscript “mean” represents the average value between the inlet and outlet because of one-dimensional assumption. The val-ues of the gas concentrations at the boundaries are calculated from the relative humidity of the cathode/anode channels. If pcand pa
are the total gas pressure in the cathode and anode channels, the concentration of water vapor at the boundaries of the anode and cathode sides can be derived as
CVk,mean=RHpsat,k pk
Ck 共k 苸 a,c兲 共80兲
and the total gas molar concentration would be Ck=
pk
RTk
共k 苸 a,c兲 共81兲 where psat,k is the saturation pressure of water vapor at the
cathode/anode flow channels and is a function of temperature关23兴 log10psat,k= − 2.1794 + 0.02953共Tk− 273兲 − 9.1837
⫻ 10−5共T
k− 273兲2+ 1.4454 ⫻ 10−7共Tk− 273兲3
共82兲 Oxygen and nitrogen concentrations in the cathode flow channels are CO2,mean= XO2共Cc− CV,mean c 兲 共83兲 CN2,mean= Cc− CV,mean c − CO2,mean 共84兲
and hydrogen concentration in the anode flow channels is
CH2,mean= XH2共Ca− CV,mean
a 兲 共85兲
The boundary conditions for temperature in the anode flow chan-nels and cathode flow chanchan-nels are both specified as
T兩x=0= Ta 共86兲
Fig. 4 Reaction rate profile in the cathode catalyst layer for the base case
Fig. 5 Oxygen concentration profile in the cathode catalyst layer for the base case
Table 2 „Continued.…
Symbol Definition Value/Reference
Tc Cathode channel temperature共K兲 353
Ta Anode channel temperature共K兲 353
RHc Cathode channel relative humidity 100%
RHa Anode channel relative humidity 100%
Pc Cathode channel pressure共atm兲 1
Pa Anode channel pressure共atm兲 1
xO2 Oxygen mole fraction 0.21
xH2 Hydrogen mole fraction 1.0
T兩x=x_CGDL= Tc 共87兲
Because water is not generated at the anode side, we assume that liquid water saturation at the interface of the anode GDL/channels is zero,
sa= s兩x=0= 0 共88兲
As the result of the ORR, water is produced at the cathode side. If the gas flow rates in the cathode flow channels are not fast enough, liquid water may be accumulated. In this paper, we set the liquid water saturation at the interface of the cathode GDL and the cathode flow channels, sc, as a control parameter. By changing the
value of sc, we can simulate the evolution of cell performance and discuss optimal strategy for water management.
3 Results and Discussion
This work is focused on water transport issues in the MEA of a PEM fuel cell. The governing equations and boundary conditions described above are solved using the finite-element method imple-mented inCOMSOL 3.3. The primary set of parameter values used for the numerical simulation of the base case is listed in Table 2. A parametric study regarding water management in PEM fuel cells is discussed in the following.
3.1 Base Case. The base case was run at 80° C, 1 atm, and 100% humidity on both sides of the anode and the cathode. The boundary conditions of liquid water saturation at the interfaces between the anode/cathode channels and the GDLs共saand sc兲 are
both set to be zero. Simulation is done by decreasing cell voltage from open circuit potential U0to 0.
Most numerical models presented in literatures关17,18,23兴 were validated by comparison of simulated and measured cell polariza-tion curves. However, the polarizapolariza-tion curve is the result of many physical and chemical processes that occurred in a PEM fuel cell, such as proton transport, oxygen transport, or both of them. It would be very helpful for the design engineers to identify what is
Fig. 6 Net water transport coefficient versus current density for the base case
Fig. 7 Water content distribution through the whole MEA for the base case
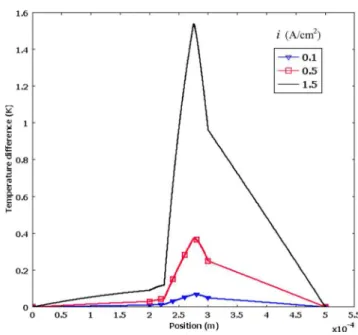
Fig. 8 Temperature profile through the MEA for the base case
Fig. 9 The various heat sources as a function of current den-sity in the cathode catalyst layer for the base case
the dominating or limiting process that leads to the cell perfor-mance degradation, where this limiting process occurs and how the water distributes through the whole MEA.
To answer these questions, first of all, the distributions of the reaction rate and oxygen concentration in the cathode catalyst layer for base case are shown in Figs. 4 and 5. At low current density, the reaction rate is distributed evenly in the cathode CL. However, at high current density, the reaction rate is highly close to the membrane side, but the concentration of oxygen does not decrease significantly. It is clearly shown that the proton transport is the limiting factor for the cell’s lack of performance.
Second, the net water transport coefficient through the mem-brane and distributions of water content in the CLs共anode and cathode sides兲 and in the membrane at different current densities are drawn in Figs. 6 and 7, respectively.
The net water transport coefficient, denoted by, is defined as the net flux of water transported from the anode to the cathode NH
2Oper proton flux NH+, = NH2O/NH+.
Two mechanisms are considered here regarding the water trans-port through the membrane: one is diffusion due to water concen-tration gradient across the membrane; another is electro-osmotic drag due to proton flux. According to the sign of  values, we can tell the direction of net water transport through the membrane.  ⬎ 0 means that the flux of the electro-osmotic drag is larger than
the flux of the back diffusion and net water transport is from the anode side across the membrane to the cathode side. This will probably lead to drying out of the anode or aggravate the cathode flooding. On the other hand,  ⬍ 0 indicates that the flux of water
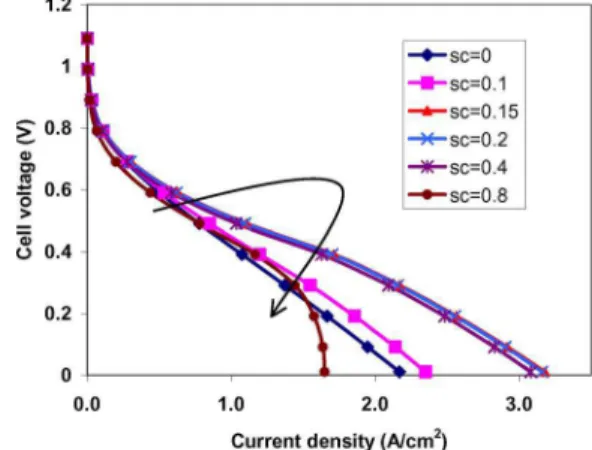
Fig. 10 Polarization curves for different accumulation levels of liquid water at the cathode side
Fig. 11 Water content distributions through the MEA at different current densities for different sc values
back diffusion is larger than the flux of the electro-osmotic drag and the net water moves from the cathode side through the mem-brane to the anode side.
As current density increases, more water is produced at the cathode side. Because produced water leads to higher water fluxes of back diffusion,  value will decrease. However, the flux of the back diffusion is still less than the flux of the electro-osmotic drag. Therefore, as shown in Fig. 6, is positive, meaning that the net water transport in the MEA is always from the anode side to the cathode side at all current densities for the base case. This may lead to membrane dehydration. The distributions of water content through the electrolyte and membrane at different current densi-ties in Fig. 7 show that at low current densidensi-ties the water content almost evenly distributed through the MEA. However, when the current density increases, the water content in the anode side de-creases dramatically due to the net water transport from the anode side to the cathode side. This results in the anode side membrane dehydration, and meanwhile, the water content in the cathode side increases to the value that equilibrates with the cathode side’s relative humidity. Therefore, the limiting proton transport process for the base case occurs actually in the anode catalyst layer and part of the membrane close to the anode CL.
The temperature distribution through the whole cell for base case is shown in Fig. 8. At low current density, such as 0.1 A / cm2, the temperature distribution is almost uniform
be-cause the heat generation is small. For higher current densities of
0.5 A / cm2and 1.5 A / cm2, the temperature distribution is
non-linear because of the heat sources in each subdomain. Since the largest heat source is in the cathode catalyst layer, the position of the highest temperature is at the interface between the membrane and the cathode catalyst layer. Heat sources due to the reaction heat including entropic heat of reaction and irreversible reaction heat, Ohmic heat, and phase change heat versus current density in the cathode catalyst layer are shown in Fig. 9. Compared with the other heat sources, reaction heat is dominant in the cathode cata-lyst layer. Because the relative humidity of the reactant gas is already 100%, higher temperature will result in the evaporation of liquid water. Therefore, phase change heat becomes negative at high current density as shown in Fig. 9.
3.2 Effect of Liquid Water Accumulation in Cathode Flow Channels. Water is generated in the cathode catalyst layer and may be accumulated in cathode flow channels due to an imperfect water management. The liquid water saturation at the interface of the cathode GDL and the cathode flow channels, sc, affects the
accumulation of liquid water. The larger the scvalue is, the easier the cathode flooding happens. Figure 10 demonstrates the effect of the liquid water accumulation at the interface of the cathode flow channels and the cathode GDL on cell performance. From Fig. 10, when the scvalue increases, cell performance increases due to the
proton conductivity improvement by higher water content in the membrane and anode electrolyte. Once screaches a certain value 共here is 0.15兲, increasing scfurther will result in cell performance
decrease because of the oxygen transport limitation caused by cathode side flooding. Therefore, the optimal value of sc, which
depends on the design and operation of the cell, exists.
The distributions of water content through the MEA at different current densities under different sc values are plotted in Fig. 11.
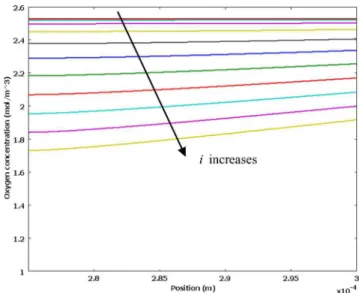
Fig. 12 Oxygen concentration at the interface of the cathode catalyst layer and membrane
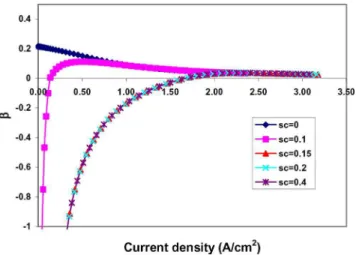
Fig. 13 The net water transport coefficient, as a function of current density at different saturation boundary conditions
Fig. 14 Optimal liquid water saturation versus the immobile saturation
Fig. 15 Value ofversus current density for different relative humidities for the base case
When scⱕ 0.15, at a same current density value the water content is higher for a large scthan that for a small sc. It means that the proton conductivity is improved with the increase in sc. In
addi-tion, when scⱖ 0.15, the water content distribution at same current
density remains the same for different sc values. It means that further increasing the scvalue cannot improve the proton conduc-tivity. When current density increases, due to the water production in the cathode catalyst layer, water content at the cathode catalyst layer increases to the level at a local water balance holding for liquid, vapor, and dissolved water. On the contrary, because of the electro-osmotic drag, water content at the anode catalyst layer decreases and leads to dry out at a high current density level.
A large sc value will easily cause the cathode side flooding,
which leads to a dramatical drop of oxygen concentration in the cathode side, as shown in Fig. 12. The net water transport coeffi-cient , as a function of current density at different sc, is given in
Fig. 13. At lower current density, when sc⬎ 0, because the back
diffusion is larger than the electro-osmotic drag,  ⬍ 0. Along with the increase in current density, both back diffusion and electro-osmotic drag increase, but the increment of electro-electro-osmotic drag is bigger than that of the back diffusion. Therefore,  increases from a negative value to a positive one. After sc⬎ 0.15, since the
membrane has reached a fully hydrated status at the cathode side 共see Fig. 11兲, the value of  remains the same even at a higher sc
value.
As discussed in Sec. 2, immobile saturation共sⴱ兲 plays an
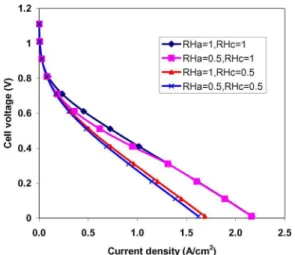
im-portant role in terms of phase change among the three forms of water. According to the experimental investigation in Ref.关38兴, sⴱ Fig. 16 Performance dependence on relative humidities for
the base case
Fig. 17 Water content distributions in the membrane for different relative humidity combinations in the anode and cathode channels
is an inherent property of porous media and is determined from the wetting properties and the structure of porous media, such as contact angle, pore shape, porosity, pore size distribution, and heterogeneity. Figure 14 shows the dependences of the optimal liquid water saturation on the interface of the cathode GDL and the cathode flow channels on the immobile saturation. The opti-mal saturation of liquid water at the interface of the cathode GDL and cathode flow channels increases if the immobile saturation value increases. Therefore, based on the immobile saturation of the porous material, we can adjust the gas flow rate in the cathode flow channels to keep the liquid water saturation at the interface of the cathode flow channels and the GDL close to the optimal value to obtain the best cell performance.
3.3 Effect of the Relative Humidity. Relative humidities at both sides of the MEA also have a noticeable impact on the net water transport through the membrane of the MEA. Figures 15 and 16 present the net water transport coefficients and the polar-ization curves for different sets of relative humidity combination of the anode and cathode sides when sa= sc= 0, respectively. From
Fig. 15, when relative humidity at the anode side is greater or equal to the value at the cathode side, the direction of the diffusion flux is from the anode side to the cathode side, so the value is positive and decreases as the current density increases, such as the cases of共RHa=1, RHc=1兲, 共RHa=1, RHc=0.5兲, and 共RHa=0.5, RHc= 0.5兲. However, for the case of 共RHa=0.5, RHc=1兲, at low current densities, the flux of back diffusion is much larger than the flux of the electro-osmotic drag due to a high water concentration at the cathode side. Therefore the value of  is negative and then increases to positive values with the increase in the current density and stays stable when the current density is high enough. In ad-dition, the positive value of means that the net water transport is from the anode side to the cathode side. This will eventually result in the anode side dehydration and the cathode side flooding if the cathode flow channels are not well managed. Because here we assume that there is no liquid water accumulation both in the anode and the cathode sides共sa= sc= 0兲, the water content in the
membrane and the electrolyte is mainly determined by the relative humidity condition of both sides. High relative humidity means higher water content, corresponding to higher proton conductivity, especially in the cathode CL. The water content distributions are given in Fig. 17 for the above mentioned four cases of relative humidity combinations in the anode and cathode flow channels. This is the reason why cell performances of the two cases of 共RHa=1, RHc=1兲 and 共RHa=0.5, RHc=1兲 exceed to the perfor-mances of the other two cases, as shown in Fig. 16.
4 Conclusions
A one-dimensional, nonisothermal, steady-state model includ-ing mass transport among liquid water, water vapor, and dissolved water has been developed to study water transport through the MEA of a PEM fuel cell under different saturation boundary con-ditions and different sets of feed relative humidities at both anode and cathode sides. We found that when there is no liquid water accumulation at both sides of the MEA or the relative humidity at the anode side is no less than the relative humidity at the cathode side, the net water transport through the membrane is from the anode side to the cathode side and net water transport coefficient decreases to a stable level as the current density increases. How-ever, when the relative humidity at the anode side is less than that at the cathode side, or the liquid water saturation at the interface of the cathode GDL and the cathode flow channels is bigger than the immobile saturation value, the net water transport through the membrane starts from the cathode side to the anode side at low current density level, then changes the transport direction from the anode side to the cathode side and net water transport coefficient finally stabilizes at a positive constant level as the current density increases. Changing the liquid water accumulation level in the cathode channels definitely affects the net water transport in the
MEA and cell performance as well. We also found that when the liquid water saturation in the cathode flow channels increased from 0 to a certain value, cell performance will increase. How-ever, when the liquid water saturation in the cathode channels increases further, cell performance will decrease. This indicates that there is an optimal liquid water saturation level in the cathode flow channels and that optimal saturation level is strongly related to the immobile saturation level of the porous media.
References
关1兴 Weber, A. Z., and Newman, J., 2004, “Modeling Transport in Polymer-Electrolyte Fuel Cells,” Chem. Rev.共Washington, D.C.兲, 104, pp. 4679–4726. 关2兴 Wang, C. Y., 2004, “Fundamental Models for Fuel Cell Engineering,” Chem.
Rev.共Washington, D.C.兲, 104, pp. 4727–4766.
关3兴 Yao, K. Z., Karan, K., McAuley, K. B., Oosthuizen, P., Peppley, B., and Xie, T., 2004, “A Review of Mathematical Models for Hydrogen and Direct Metha-nol Polymer Electrolyte Membrane Fuel Cells,” Fuel Cells, 4, pp. 3–29. 关4兴 Song, D., Wang, Q., Liu, Z., Navessin, T., Eikerling, M., and Holdcroft, S.,
2004, “Numerical Optimization Study of the Catalyst Layer of PEM Fuel Cell Cathode,” J. Power Sources, 126, pp. 104–111.
关5兴 Song, D., Wang, Q., Liu, Z., Eikerling, M., Xie, Z., Navessin, T., and Hold-croft, S., 2005, “A Method for Optimizing Distributions of Nafion and Pt in Cathode Catalyst Layers of PEM Fuel Cells,” Electrochim. Acta, 50, pp. 3347–3358.
关6兴 Eikerling, M., 2006, “Water Management in Cathode Catalyst Layers of PEM Fuel Cells: A Structure-Based Model,” J. Electrochem. Soc., 153, pp. E58– E70.
关7兴 Springer, T. E., Zawodzinski, T. A., and Gottesfeld, S., 1991, “Polymer Elec-trolyte Fuel Cell Model,” J. Electrochem. Soc., 138, pp. A2334–A2341. 关8兴 Eikerling, M., and Kornyshev, A. A., 1998, “Modelling the Performance of the
Cathode Catalyst Layer of Polymer Electrolyte Fuel Cells,” J. Electroanal. Chem., 453, pp. 89–106.
关9兴 Marr, C., and Li, X., 1999, “Composition and Performance Modeling of Cata-lyst Layer in a Proton Exchange Membrane Fuel Cell,” J. Power Sources, 77, pp. 17–21.
关10兴 Dutta, S., Shimpalee, S., and Van Zee, J. W., 2000, “Three-Dimensional Nu-merical Simultion of Straight Channel PEM Fuel Cells,” J. Appl. Electro-chem., 30, pp. 135–146.
关11兴 Wang, Q., Eikerling, M., Song, D., Liu, Z., Navessin, T., Xie, Z., and Hold-croft, S., 2004, “Functionally Graded Cathode Catalyst Layers for Polymer Electrolyte Fuel Cells-Part I: Theoretical Modeling,” J. Electrochem. Soc.,
151, pp. A950–A957.
关12兴 Bernardi, D. M., and Verbrugge, M. W., 1991, “A Mathematical Model of a Gas Diffusion Electrode Bonded to a Polymer Electrolyte,” AIChE J., 37, pp. 1161–1163.
关13兴 Janssen, G. J. M., 2001, “A Phenomenological Model of Water Transport in a Proton Exchange Membrane Fuel Cell,” J. Electrochem. Soc., 148, pp. A1313–A1323.
关14兴 He, W., Yi, J. S., and Nguyen, T. V., 2000, “Two-Phase Flow Model of the Cathode of PEM Fuel Cells Using Interdigitated Flow Fields,” AIChE J., 46, pp. 2053–2064.
关15兴 Wang, Z. H., Wang, C. Y., and Chen, K. S., 2001, “Two-Phase Flow and Transport in the Air Cathode of Proton Exchange Membrane Fuel Cells,” J. Power Sources, 94, pp. 40–50.
关16兴 Pasaogullari, U., and Wang, C. Y., 2004, “Two-Phase Transport and the Role of Micro-Porous Layer in Polymer Electrolyte Fuel Cells,” Electrochim. Acta,
49, pp. 4359–4369.
关17兴 Siegel, N. P., Ellis, M. W., Nelson, D. J., and von Spakovsky, M. R., 2004, “A Two-Dimensional Computational Model of a PEMFC With Liquid Water Transport,” J. Power Sources, 128, pp. 173–184.
关18兴 Mazumder, S., and Cole, J. V., 2003, “Rigorous 3D Mathematical Modelling of PEM Fuel Cells: II. Model Predictions With Liquid Water Transport,” J. Electrochem. Soc., 150, pp. A1510–A1517.
关19兴 Weber, A. Z., Darling, R. M., and Newman, J., 2004, “Modeling Two-Phase Behavior in PEFCs,” J. Electrochem. Soc., 151, pp. A1715–A1727. 关20兴 You, L., and Liu, H., 2006, “A Two-Phase Flow and Transport Model for PEM
Fuel Cells,” J. Power Sources, 155, pp. 219–230.
关21兴 Berning, T., and Djilali, N., 2003, “A 3D, Multiphase, Multicomponent Model of the Cathode and Anode of a PEM Fuel Cell,” J. Electrochem. Soc., 150, pp. A1589–A1598.
关22兴 Baschuk, J. J., and Li, X., 2000, “Modeling of Polymer Electrolyte Membrane Fuel Cells With Variable Degrees of Water Flooding,” J. Power Sources, 86, pp. 181–196.
关23兴 Shah, A. A., Kim, G.-S., Gervais, W., Young, A., Promislow, K., Li, J., and Ye, S., 2006, “The Effects of Water and Microstructure on the Performance of Polymer Electrolyte Fuel Cells,” J. Power Sources, 160, pp. 1251–1268. 关24兴 Berg, P., Promislow, K., St-Pierre, J., Stumper, J., and Wetton, B., 2004,
“Wa-ter Management in PEM Fuel Cells,” J. Electrochem. Soc., 151, pp. A341– A353.
关25兴 Noponen, M., Birgersson, E., Ihonen, J., Vynnycky, M., Lundblad, A., and Lindbergh, G., 2004, “A Two-Phase Non-Isothermal PEFC Model: Theory and Validation,” Fuel Cells, 4, pp. 365–377.
关26兴 Song, D., Wang, Q., Liu, Z.-S., and Huang, C., 2006, “Transient Analysis for the Cathode Gas Diffusion Layer of PEM Fuel Cells,” J. Power Sources, 159,
pp. 928–942.
关27兴 Birgersson, E., Noponen, M., and Vynnycky, M., 2005, “Analysis of a Two-Phase Non-Isothermal Model for a PEFC,” J. Electrochem. Soc., 152, pp. A1021–A1034.
关28兴 Wang, Y., and Wang, C. Y., 2006, “A Nonisothermal, Two-Phase Model for Polymer Electrolyte Fuel Cells,” J. Electrochem. Soc., 153, pp. A1193– A1200.
关29兴 Steinkamp, K., Schumacher, J. O., Goldsmith, F., Ohlberger, M., and Ziegler, C., 2008, “A Nonisothermal PEM Fuel Cell Model Including Two Water Transport Mechanisms in the Membrane,” ASME J. Fuel Cell Sci. Technol.,
5, p. 011007.
关30兴 Abriola, L. M., and Pinder, G. F., 1985, “A Multiphase Approach to the Mod-eling of Porous Media Contamination by Organic Compounds 1. Equation Development,” Water Resour. Res., 21, pp. 11–18.
关31兴 Berger, C., 1968, Handbook of Fuel Cell Technology, Prentice-Hall, Engle-wood Cliffs, NJ.
关32兴 Crank, J., 1975, The Mathematics of Diffusion, 2nd ed., Oxford Science, Ox-ford, pp. 88.
关33兴 Hinatsu, J. T., Mizuhata, M., and Takenaka, H., 1994, “Water Uptake of Per-fluorosulfonic Acid Membranes From Liquid Water and Water Vapour,” J. Electrochem. Soc., 141, pp. A1493–A1497.
关34兴 Bird, R. B., Stewart, W. E., and Lightfoot, E. N., 2002, Transport Phenomena, 2nd ed., Wiley, New York.
关35兴 Ogumi, Z., Takehara, Z., and Yoshizawa, S., 1984, “Gas Permeation in SPE Method I. Oxygen Permeation Through Nafion and Neosepta,” J. Electrochem. Soc., 131, pp. A769–A772.
关36兴 Motupally, S., Becker, A. J., and Weidner, J. W., 2000, “Diffusion of Water in Nafion Membranes,” J. Electrochem. Soc., 147, pp. A3171–A3177. 关37兴 Marsh, K. N., 1987, Recommended Reference Materials for the Realization of
Physicochemical Properties, Blackwell Scientific, Oxford.
关38兴 Morrow, N. R., 1970, “Irreducible Wetting-Phase Saturations in Porous Me-dia,” Chem. Eng. Sci., 25, pp. 1799–1815.
关39兴 Khandelwal, M., and Mench, M. M., 2006, “Direct Measurement of Through-Plane Thermal Conductivity and Contact Resistance in Fuel Cell Materials,” J. Power Sources, 161, pp. 1106–1115.