HAL Id: hal-00328309
https://hal.archives-ouvertes.fr/hal-00328309
Submitted on 10 Oct 2008HAL is a multi-disciplinary open access
archive for the deposit and dissemination of sci-entific research documents, whether they are pub-lished or not. The documents may come from teaching and research institutions in France or abroad, or from public or private research centers.
L’archive ouverte pluridisciplinaire HAL, est destinée au dépôt et à la diffusion de documents scientifiques de niveau recherche, publiés ou non, émanant des établissements d’enseignement et de recherche français ou étrangers, des laboratoires publics ou privés.
Validation of ACE-FTS v2.2 measurements of HCl, HF,
CCl3F and CCl2F2 using space-, balloon- and
ground-based instrument observations
E. Mahieu, P. Duchatelet, P. Demoulin, K. A. Walker, E. Dupuy, L.
Froidevaux, C. Randall, Valéry Catoire, K. Strong, C. D. Boone, et al.
To cite this version:
E. Mahieu, P. Duchatelet, P. Demoulin, K. A. Walker, E. Dupuy, et al.. Validation of ACE-FTS v2.2 measurements of HCl, HF, CCl3F and CCl2F2 using space-, balloon- and ground-based instrument observations. Atmospheric Chemistry and Physics Discussions, European Geosciences Union, 2008, 8 (1), pp.3431-3495. �hal-00328309�
ACPD
8, 3431–3495, 2008 Validation of HCl, HF, CCl3F and CCl2F2 from ACE-FTS Title Page Abstract Introduction Conclusions References Tables Figures ◭ ◮ ◭ ◮ Back CloseFull Screen / Esc
Printer-friendly Version Interactive Discussion
Atmos. Chem. Phys. Discuss., 8, 3431–3495, 2008 www.atmos-chem-phys-discuss.net/8/3431/2008/ © Author(s) 2008. This work is distributed under the Creative Commons Attribution 3.0 License.
Atmospheric Chemistry and Physics Discussions
Validation of ACE-FTS v2.2 measurements
of HCl, HF, CCl
3
F and CCl
2
F
2
using
space-, balloon- and ground-based
instrument observations
E. Mahieu1, P. Duchatelet1, P. Demoulin1, K. A. Walker2,3, E. Dupuy3, L.
Froide-vaux4, C. Randall5, V. Catoire6, K. Strong2, C. D. Boone3, P. F. Bernath7,
J.-F. Blavier4, T. Blumenstock8, M. Coffey9, M. De Mazi `ere10, D. Griffith11, J.
Han-nigan9, F. Hase8, N. Jones11, K. W. Jucks12, A. Kagawa13, Y. Kasai13, Y. Mebarki6,
S. Mikuteit8, R. Nassar14, J. Notholt15, C. P. Rinsland16, C. Robert6, O. Schrems17,
C. Senten10, D. Smale18, J. Taylor2, C. T ´etard19, G. C. Toon4, T. Warneke15,
S. W. Wood18, R. Zander1, and C. Servais1
1
Groupe Infra-Rouge de Physique Atmosph ´erique et Solaire (GIRPAS), Institute of Astro-physics and GeoAstro-physics, University of Li `ege, Li `ege, Belgium
2
Department of Physics, University of Toronto, 60 St. George Street, Toronto, Ontario, M5S 1A7, Canada
3
Department of Chemistry, University of Waterloo, 200 University Avenue West, Waterloo, Ontario, N2L 3G1, Canada
4
Jet Propulsion Laboratory, California Institute of Technology , Pasadena, CA, USA 5
University of Colorado, CO, USA 6
ACPD
8, 3431–3495, 2008 Validation of HCl, HF, CCl3F and CCl2F2 from ACE-FTS Title Page Abstract Introduction Conclusions References Tables Figures ◭ ◮ ◭ ◮ Back CloseFull Screen / Esc
Printer-friendly Version Interactive Discussion
6115), 45071 Orl ´eans Cedex 2, France 7
Department of Chemistry, University of York, Heslington, York, YO10 5DD, UK 8
Institute for Meterorology and Climate Research (IMK), Forschungszentrum Karlsruhe and University of Karlsruhe, Karlsruhe, Germany
9
National Center for Atmospheric Research, CO, USA 10
Belgian Institute for Space Aeronomy, Brussels, Belgium 11
University of Wollongong, Australia 12
Harvard-Smithsonian Center for Astrophysics, Cambridge, MA, USA 13
National Institute of Communications and Information Technology, 4-2-1 Nukui-kita, Koganei, Tokyo 184-8795, Japan
14
Harvard University, Cambridge, MA, USA 15
Institute of Environmental Physics, University of Bremen, Germany 16
Langley Research Center, VA, USA 17
Alfred Wegener Insitute for Polar and Marine Research, Bremerhaven, Germany 18
National Institute of Water and Atmospheric Research Ltd, Lauder, Central Otago, New-Zealand
19
Laboratoire d’Optique Atmosph ´erique, Universit ´e des sciences et technologies de Lille (UMR 8518) 59655 Villeneuve d’Ascq, France
Received: 4 December 2007 – Accepted: 11 January 2008 –Published: 18 February 2008 Correspondence to: E. Mahieu (emmanuel.mahieu@ulg.ac.be)
ACPD
8, 3431–3495, 2008 Validation of HCl, HF, CCl3F and CCl2F2 from ACE-FTS Title Page Abstract Introduction Conclusions References Tables Figures ◭ ◮ ◭ ◮ Back CloseFull Screen / Esc
Printer-friendly Version Interactive Discussion
Abstract
Hydrogen chloride (HCl) and hydrogen fluoride (HF) are respectively the main chlorine and fluorine reservoirs in the Earth’s stratosphere. Their buildup resulted from the intensive use of man-made halogenated source gases, in particular CFC-11 (CCl3F) and CFC-12 (CCl2F2), during the second half of the 20th century. It is important to 5
continue monitoring the evolution of these source gases and reservoirs, in support of the Montreal Protocol and also indirectly of the Kyoto Protocol. The Atmospheric Chemistry Experiment Fourier Transform Spectrometer (ACE-FTS) is a space-based instrument that has been performing regular solar occultation measurements of over 30 atmospheric gases since early 2004. In this validation paper, the HCl, HF, CFC-11 10
and CFC-12 version 2.2 profile data products retrieved from ACE-FTS measurements are evaluated. Volume mixing ratio profiles have been compared to observations made from space by MLS and HALOE, and from stratospheric balloons by SPIRALE, FIRS-2 and Mark-IV. Partial columns derived from the ACE-FTS data were also compared to column measurements from ground-based Fourier transform instruments operated 15
at 12 sites. ACE-FTS data recorded from March 2004 to August 2007 have been used for the comparisons. These data are representative of a variety of atmospheric and chemical situations, with sounded air masses extending from the winter vortex to summer sub-tropical conditions. Typically, the ACE-FTS products are available in the 10–50 km altitude range for HCl and HF, and in the 7–20 and 7–25 km ranges for 20
CFC-11 and CFC-12, respectively. For both reservoirs, comparison results indicate an agreement generally better than 5–10%, when accounting for the known offset affecting HALOE measurements of HCl and HF. Larger positive differences are however found for comparisons with single profiles from FIRS-2 and SPIRALE. For CFCs, the few coincident measurements available suggest that the differences probably remain within 25
ACPD
8, 3431–3495, 2008 Validation of HCl, HF, CCl3F and CCl2F2 from ACE-FTS Title Page Abstract Introduction Conclusions References Tables Figures ◭ ◮ ◭ ◮ Back CloseFull Screen / Esc
Printer-friendly Version Interactive Discussion
1 Introduction
Under unperturbed atmospheric conditions, hydrogen chloride (HCl) and hydrogen flu-oride (HF) are the two most abundant halogenated species of the inorganic chlorine and fluorine families (respectively denoted Cly and Fy; see e.g. Prinn et al., 1999) in the stratosphere. Since the 1970s, their atmospheric concentrations have signifi-5
cantly increased, followed by a recent slowing down in their accumulation, and even a decrease for HCl (Mahieu et al., 2004; Froidevaux et al., 2006b). Indeed, the respec-tive HCl and HF mean upper stratospheric concentrations have risen from 2500 and 760 pptv in the mid-1980s to 3800 and 1800 pptv in the first years of the new millennium (e.g., Zander et al., 1992; Gunson et al., 1994; Nassar et al., 2006a, 2006b). These 10
increases are due to the extensive use of man-made chlorofluorocarbons (CFCs), fur-ther augmented, and then replaced, with substitutes such as hydrochlorofluorocarbons (HCFCs). Among these source gases, the main contributors are CCl2F2(CFC-12) and CCl3F (CFC-11), with current mean tropospheric concentrations of 540 and 250 pptv, respectively (WMO Report Nr. 50, 2007). Transport of these long-lived compounds 15
to the stratosphere leads to their photodissociation, with release of chlorine and flu-orine atoms (e.g., Kaye et al., 1991). Rapid recombination of these atoms with hy-drogenated compounds (e.g., CH4, H2) respectively produces HCl and HF, the two reservoir species of interest here. However, before the formation of HCl, Cl can be involved in the ClOx catalytic cycle which contributes to ozone depletion (e.g., Molina 20
and Rowland, 1974).
HF is a remarkably stable species in the stratosphere (e.g., Stolarski and Rundel, 1975), making it an ideal tracer of transport and dynamics in this atmospheric region (Chipperfield et al., 1997). Conversely, HCl can be activated under specific condi-tions occurring mainly in the stratospheric polar atmosphere and in wintertime, with 25
the production of active chlorine species (e.g., ClO) which are able to destroy ozone. This reactivation occurs through various heterogeneous reactions taking place on Polar Stratospheric Clouds (PSCs), at temperatures below 200K (e.g. Solomon et al., 1999;
ACPD
8, 3431–3495, 2008 Validation of HCl, HF, CCl3F and CCl2F2 from ACE-FTS Title Page Abstract Introduction Conclusions References Tables Figures ◭ ◮ ◭ ◮ Back CloseFull Screen / Esc
Printer-friendly Version Interactive Discussion
WMO Report Nr. 50, 2007, and references therein).
Even before the unambiguous confirmation of the significant role of anthropogenic chlorine in the destruction of the Earth’s protective ozone layer, monitoring net-works such as the AGAGE (Advanced Global Atmospheric Gases Experiment) and NOAA/ESRL (National Oceanic and Atmospheric Administration – Earth System Re-5
search Laboratory) have been measuring increases in a large number of source gases, including all major long-lived CFCs and HCFCs, by in situ surface sampling (e.g., O’Doherty et al., 2003; Montzka et al., 1999, and references therein). These increasing tropospheric loadings were at the heart of the alarming threat to ozone suggested by Molina and Rowland (1974). This theory was soon supported by the first detections in 10
the stratosphere of HF (Zander et al., 1975), of HCl (Farmer et al., 1976; Ackerman et al., 1976), and of CFC-11 and -12 (Murcray et al., 1975).
The ATMOS (Atmospheric Trace MOlecule Spectroscopy,
http://remus.jpl.nasa.gov/atmos) Fourier Transform InfraRed (FTIR) instrument was one of the pioneering space-based experiments that measured the vertical 15
distributions of nearly 30 atmospheric gases, during four shuttle flights that took place from 1985 to 1994 (Gunson et al., 1996). Among the many results of ATMOS, chlorine and fluorine budgets were evaluated using Northern latitude measurements of halogenated sources and reservoirs, supplemented by balloon and model data for a few missing species (Raper et al., 1987; Zander et al., 1987, 1992 and 1996). 20
HALOE (HALogen Occultation Experiment; Russell et al., 1993) has contributed over the longer term, recording regular, global occultation measurements of HCl and HF between September 1991 and November 2005. The HALOE data set has been used to derive the first global distributions and decadal trends of HCl and HF from space (e.g., Anderson et al., 2000; WMO Report Nr. 50, 2007). These stratospheric species 25
have also been remotely monitored from the ground, using FTIRs. Data sets now spanning more than 30 years are available from the Jungfraujoch station, allowing long-term trends in HCl and HF to be characterized (e.g., Rinsland et al., 2002; Mahieu et al., 2004; WMO Report Nr. 50, 2007). Other sites equipped with FTIRs
ACPD
8, 3431–3495, 2008 Validation of HCl, HF, CCl3F and CCl2F2 from ACE-FTS Title Page Abstract Introduction Conclusions References Tables Figures ◭ ◮ ◭ ◮ Back CloseFull Screen / Esc
Printer-friendly Version Interactive Discussion
and affiliated with the Network for the Detection of Atmospheric Composition Change (NDACC, previously NDSC,http://www.ndacc.org), have also contributed to this effort. Observations from nine sites spread from Northern high- to Southern mid-latitudes have detected the leveling-off of HCl, which peaked around the mid-1990s (Rinsland et al., 2003). In parallel, experiments using balloon-borne instruments, often focusing 5
on polar vortex chemistry in the low stratosphere, have completed the picture for both the source and reservoir species (e.g., Sen et al., 1998).
Among the space-borne instruments currently performing observations of these species, MLS (Microwave Limb Sounder) onboard Aura has collected HCl data over the last three years and is still in operation (Froidevaux et al., 2006b). ACE-FTS (Atmo-10
spheric Chemistry Experiment Fourier Transform Spectrometer), onboard the Cana-dian SCISAT satellite, is also still fully operational after more than four years in space and is the only instrument presently in orbit which measures HF. Previous work using ACE-FTS observations has included studies of the global inventories and partitioning of stratospheric chlorine and fluorine, using the version 2.2 (v2.2) data set (Nassar et 15
al., 2006a, 2006b).
Although the HCl and HF version 1.0 (v1.0) data products were targets of initial comparisons (e.g., McHugh et al., 2005; Mahieu et al., 2005), the more extensive v2.2 database still requires validation. Therefore, the present study aims at investigating the consistency and reliability of the ACE v2.2 HCl, HF, CFC-11 and -12 level 2 products, 20
prior to their official release to the scientific community. For this purpose, the present manuscript has been organized into several sections. Section 2 briefly describes the ACE-FTS instrument and measurements, as well as the strategy adopted in the re-trieval processes. Section 2 gives an overview of the correlative data sets and instru-ments involved, as well as details on selected data filtering and collocation criteria. 25
Section 2 deals with intercomparison results, on a per–molecule and per–instrument basis. Finally, conclusions are given in Sect. 5.
ACPD
8, 3431–3495, 2008 Validation of HCl, HF, CCl3F and CCl2F2 from ACE-FTS Title Page Abstract Introduction Conclusions References Tables Figures ◭ ◮ ◭ ◮ Back CloseFull Screen / Esc
Printer-friendly Version Interactive Discussion
2 The ACE-FTS measurements of HCl, HF, CFC-11 and -12
The ACE-FTS instrument was launched onboard the SCISAT satellite on 12 August 2003. A low altitude (650 km) high inclination (74◦) circular orbit was selected in or-der to allow for coverage of polar to tropical regions, in agreement with the mission’s objectives (Bernath et al., 2005). The platform also carries a spectrophotometer (MAE-5
STRO – Measurement of Aerosol Extinction in the Stratosphere and Troposphere Re-trieved by Occultation, (McElroy et al., 2007)) as well as two filtered solar imagers (ACE-imagers, Gilbert at al., 2007). The ACE-FTS instrument achieves a maximum spectral resolution of 0.02 cm−1 in the broad 750–4400 cm−1 spectral interval (2.2 to 13 micrometers). Since the beginning of routine operations on 21 February 2004, this 10
instrument has recorded up to 15 sunrise (sr) and sunset (ss) occultations per day (about every 90 min); successive infrared (IR) solar spectra are collected from 150 km altitude down to the cloud tops, with a vertical resolution of about 3–4 km, correspond-ing to 1.25 mrad field of view of ACE-FTS. As a result of the 2 s needed to record an interferogram and of the orbital beta angle, the vertical spacing of the measurements 15
varies between 1.5 and 6 km (without including the effects of atmospheric refraction). Analyses of ACE-FTS spectra (level 1 data) are performed at the University of Water-loo (Ontario, Canada). The algorithm is thoroughly described by Boone et al. (2005). In a first step, temperature and pressure are retrieved using CO2spectral lines, assuming a realistic profile. Subsequent retrievals of target species combine the information from 20
several microwindows that are carefully selected to minimize the impact of interfering gases in the altitude range of interest, i.e., generally from the lower mesosphere to the upper troposphere. Inversion of a series of successive spectra recorded during a solar occultation event produces volume mixing ratio (vmr) profiles of the target gases, on the measured altitude grid. These profiles are also interpolated onto a standard 25
altitude grid, consisting of 150 levels of 1 km thickness, which are considered to be homogeneous in terms of pressure, temperature and vmr of the various gases.
mea-ACPD
8, 3431–3495, 2008 Validation of HCl, HF, CCl3F and CCl2F2 from ACE-FTS Title Page Abstract Introduction Conclusions References Tables Figures ◭ ◮ ◭ ◮ Back CloseFull Screen / Esc
Printer-friendly Version Interactive Discussion
surements, a group of primary (“baseline”) data products have been selected by the ACE Science Team as the focus of this validation exercise. These include O3, CH4, H2O, NO, NO2, ClONO2, HNO3, N2O, N2O5, HCl, CCl3F, CCl2F2, HF, CO, aerosols, temperature and pressure.
ACE-FTS retrievals considered here have been performed using the standard edition 5
of the HITRAN-2004 line parameter and cross section compilation (Rothman et al., 2005). The microwindows used in the HCl, HF, CFC-11 and CFC-12 retrievals are listed in Table 1, together with the main interfering species and the altitude range in which each microwindow is used. Several spectral intervals encompassing discrete lines are simultaneously used to retrieve HCl and HF vmrs.
10
For CFCs, broad spectral features are used to retrieve their vertical distributions, typically between the tangent height of 10 and 25 km.
Version 2.2 retrievals are identical to v1.0 settings, except for HCl. In the new ap-proach, microwindows encompassing absorption lines of the H37Cl isotopologue have been included, 22 spectral intervals are used instead of the 13 used previously. 15
3 Correlative data sets
In the following sub-sections, all instruments and corresponding measurements will be briefly described; specific methodology for comparison, if any, as well as the criteria used for selecting the coincidences will also be provided.
3.1 MLS v2.2 measurements of HCl 20
Continuous (day and night) global measurements of HCl have been provided since August 2004 by MLS onboard the Aura satellite. MLS measures thermal emission lines from trace gases at millimeter and sub-millimeter wavelengths, as discussed by Waters et al. (2006). Validation of the MLS HCl version 2.2 (v2.2) data has been described recently by Froidevaux et al. (2008). This data version has been used since March 25
ACPD
8, 3431–3495, 2008 Validation of HCl, HF, CCl3F and CCl2F2 from ACE-FTS Title Page Abstract Introduction Conclusions References Tables Figures ◭ ◮ ◭ ◮ Back CloseFull Screen / Esc
Printer-friendly Version Interactive Discussion
2007. The reprocessing of the MLS data is still ongoing. The single profile precision of MLS HCl is 0.5 ppbv or less in the stratosphere, and the HCl accuracy estimate is about 0.2 ppbv. The recommended altitude range for MLS HCl profiles is from 100 to 0.15 hPa; the data can be used down to 150 hPa at high latitudes, although a high MLS bias is observed at low to mid-latitudes versus aircraft in situ data at this pressure 5
level (Froidevaux et al., 2008). More details regarding the MLS experiment and the HCl data screening are provided in the above references; per these references, we follow the MLS flags that screen out a small percentage of profiles with bad “Status”, and poor “Quality” (from radiance fits) or “Convergence” (retrieval issue). In this work, the comparisons of coincident profiles between MLS and ACE-FTS include 4731 ACE-FTS 10
occultations between 84◦N and 84◦S latitude. The number of MLS v2.2 reprocessed days available at the time of writing for 2004, 2005, and 2006 were 28, 179 and 154, respectively. For 2007, the comparisons include data from MLS and ACE-FTS until the end of August, although no MLS HCl data were obtained from 15 July through 9 August, due to a temporary instrument anomaly. The coincidence criteria used here 15
are the same as those used in the analyses by Froidevaux et al. (2008). For each ACE-FTS profile, the closest MLS profile (on the same day) within ±2 degrees of latitude and ±8 degrees of longitude is selected. The ACE-FTS profiles are interpolated (linearly versus log of pressure) onto the MLS retrieval grid, using the retrieved pressures from the ACE-FTS data.
20
3.2 HALOE v19 measurements of HCl and HF
The HALOE instrument was in operation onboard the UARS platform (Upper Atmo-spheric Research Satellite; Reber et al., 1993) for 14 years, from September 1991 to November 2005, when the mission was ended. Therefore, it operated throughout most of the first two years of the ACE mission operations phase. Given the UARS orbital in-25
clination of 57◦and the satellite altitude (close to 600 km), HALOE was able to sample the Earth’s atmosphere almost globally (from about 80◦N to 80◦S), in solar occultation mode, from the lower mesosphere to the upper troposphere. Eight IR channels allow
ACPD
8, 3431–3495, 2008 Validation of HCl, HF, CCl3F and CCl2F2 from ACE-FTS Title Page Abstract Introduction Conclusions References Tables Figures ◭ ◮ ◭ ◮ Back CloseFull Screen / Esc
Printer-friendly Version Interactive Discussion
the measurements of several trace gases (e.g., O3, CH4, H2O) with a vertical resolution of ∼2 km. HCl and HF vertical distributions are among the available data products.
Earlier version 17 (v17) HALOE HCl data were found to agree with correlative mea-surements to within about 10–20% in the stratosphere, with a possible low bias (Rus-sell et al., 1996a). Comparisons between version 19 (v19) HALOE and v1.0 ACE-FTS 5
data were described by McHugh et al. (2005), who found that ACE-FTS HCl was within ±10% of HALOE below 20 km, and 10–20% higher than HALOE from 20 to 48 km. In a recent paper, Lary et al. (2007) have compared several space-based measurements of HCl, by ACE-FTS, ATMOS, HALOE and MLS, obtained between 1991 and 2006, using a neural network. They further confirmed the low bias of HALOE with respect to 10
all other instruments.
For HF, v17 HALOE data were found to agree with correlative balloon measurements to better than 7% from 5 to 50 hPa (i.e., between about 20 and 35 km) (Russell et al., 1996b), but had a similar 10–20% low bias with respect to ATMOS as was observed for HCl (Russell et al., 1996a). Comparisons between v19 HALOE and v1.0 ACE-FTS 15
data were also performed by McHugh et al. (2005), who found that ACE-FTS HF was about 10–20% higher than HALOE from 15 to 45 km.
The latest version (v19; seehttp://haloedata.larc.nasa.gov) data release has been used in the present statistical analyses, for both HCl and HF.
The HALOE and ACE-FTS data sets were searched for coincident profile measure-20
ments, defined as occurring within 2 h in time and 500 km in geographic distance. A total of 36 coincidences were found; 5 corresponding to sunrise occultations and 31 to sunset occultations. Relaxing the time criterion to one day did not result in any new coincidences. Twenty nine coincidences occurred from 4 to 10 July 2004 (average latitude 66◦N) and two on 15 August 2005 (average latitude 49◦S); the five sunrise 25
coincidences occurred on 6 and 7 September 2004 (5 coincidences, average latitude 60◦N). Thus most of the comparisons correspond to polar summer conditions in the Northern Hemisphere.
ACPD
8, 3431–3495, 2008 Validation of HCl, HF, CCl3F and CCl2F2 from ACE-FTS Title Page Abstract Introduction Conclusions References Tables Figures ◭ ◮ ◭ ◮ Back CloseFull Screen / Esc
Printer-friendly Version Interactive Discussion
3.3 SPIRALE measurements of HCl
SPIRALE (SPectroscopie Infra-Rouge d’Absorption par Lasers Embarqu ´es) is a balloon-borne instrument operated by LPCE (Laboratoire de Physique et de Chimie de l’Environnement, CNRS – Universit ´e d’Orl ´eans) and routinely used at all latitudes, in particular as part of European validation campaigns for the Odin and Envisat missions. 5
This six tunable diode laser absorption spectrometer (TDLAS) has been previously de-scribed in detail (Moreau et al., 2005). In brief, it can perform simultaneous in situ measurements of about ten chemical species from about 10 to 35 km height, with a high frequency sampling (∼1 Hz), thus enabling a vertical resolution of a few meters depending on the ascent rate of the balloon. The diode lasers emit in the mid-infrared 10
domain (from 3 to 8 µm) with beams injected into a multipass Herriott cell located un-der the gondola and exposed to ambient air. The cell (3.5 m long) is deployed during the ascent when pressure is lower than 300 hPa. The multiple reflections obtained be-tween the two cell mirrors give a total optical path of 430.78 m. Species concentrations are retrieved from direct infrared absorption, by adjusting synthetic spectra calculated 15
using the HITRAN 2004 database (Rothman et al., 2005) to match the observation. Specifically, the ro-vibrational line at 2925.8967 cm−1was used for HCl. Measurements of pressure (from two calibrated and temperature-regulated capacitance manometers) and temperature (from two probes made of resistive platinum wire) aboard the gondola allow the species concentrations to be converted to vmrs.
20
Uncertainties in these pressure and temperature parameters have been evaluated to be negligible relative to the other uncertainties discussed below. The global uncer-tainties on the vmrs have been assessed by taking into account the random errors and the systematic errors, and combining them as the square root of their quadratic sum. The two important sources of random error are the fluctuations of the laser background 25
emission signal and the signal-to-noise ratio. At lower altitudes (below 16 km), these are the main contributions. Systematic errors originate essentially from the laser line width (an intrinsic characteristic of the diode laser), which contributes more at lower
ACPD
8, 3431–3495, 2008 Validation of HCl, HF, CCl3F and CCl2F2 from ACE-FTS Title Page Abstract Introduction Conclusions References Tables Figures ◭ ◮ ◭ ◮ Back CloseFull Screen / Esc
Printer-friendly Version Interactive Discussion
pressure (higher altitudes) than at higher pressures. The impact of the spectroscopic parameter uncertainties (essentially the molecular line strength and pressure broaden-ing coefficients) on the vmr retrievals is almost negligible. After quadratic combination, the random and systematic errors result in total uncertainties of 20% below 16 km altitude, decreasing to 13% at 23 km and to a constant value of 7% above 23 km. 5
The SPIRALE measurements occurred on 20 January 2006 between 17:36 UT and 19:47 UT. An HCl vertical profile was obtained during ascent, between 11.3 and 27.3 km height. The measurement position remained rather constant with a mean lo-cation of the balloon at (67.6±0.2)◦N and (21.55±0.20)◦E. The comparison is made with the ACE-FTS sunrise occultation (sr13151) that occurred 13h later (on 21 January 10
2006 at 08:00 UT) and was located at 64.28◦N–21.56◦E, i.e., 413 km distant from the mean SPIRALE position.
3.4 FIRS-2 measurements of HCl, HF, CFC-11 and CFC-12
The Far-InfraRed Spectrometer (FIRS)-2 is a thermal emission FTIR spectrometer de-signed and built at the Smithsonian Astrophysical Observatory. The balloon-borne 15
limb-sounding observations provide high-resolution (0.004 cm−1) spectra in the wave-length range 7–120 µm (80–1400 cm−1) (Johnson et al., 1995), at altitude levels from the tropopause to the balloon float altitude (typically 38 km). The retrievals are con-ducted in a two-step process. First, the atmospheric pressure and temperature profiles are retrieved from observations of CO2 spectral lines around 15 µm. Then, vertical 20
profiles of atmospheric trace constituents are retrieved using a nonlinear Levenberg-Marquardt least-squares algorithm (Johnson et al., 1995). Vertical vmr profiles are routinely produced for ∼30 molecular species including HCl, HF, CFC-11 and CFC-12. In particular, FIRS-2 retrieves HCl and HF using 11 and 3 rotational lines, respectively. CFC-11 and CFC-12 are retrieved using the same bands as ACE-FTS (see relevant 25
part of Table 1).
Uncertainty estimates for FIRS-2 contain random retrieval error from spectral noise and systematic components from errors in atmospheric temperature and pointing angle
ACPD
8, 3431–3495, 2008 Validation of HCl, HF, CCl3F and CCl2F2 from ACE-FTS Title Page Abstract Introduction Conclusions References Tables Figures ◭ ◮ ◭ ◮ Back CloseFull Screen / Esc
Printer-friendly Version Interactive Discussion
(Jucks et al., 2002; Johnson et al., 1995). The HCl retrievals yield total errors decreas-ing with increasdecreas-ing altitude from 55% at 12 km to 9% at 22 km and smaller than 7% above 22 km. The HF errors are small (<10%) from 16 to 31 km, with larger values (∼60%) below this range. For CFC-11, the total error for the profile used in this study increases with increasing altitude, from 24% at 12 km to 90% around 20 km. Lastly, the 5
error values for CFC-12 increase from 55 to 100% over the same altitude range. Measurements from FIRS-2 have been used previously in conjunction with other balloon-borne instruments to validate observations of the v17 HCl data product from HALOE (Russell et al., 1996a). HALOE showed a positive bias with respect to FIRS-2 decreasing with altitude, with mean differences ranging from +19% at ∼17 km 10
(100 hPa) to +9% at ∼31 km (5 hPa) (Russell et al., 1996a). A comparison of the HALOE v17 HF retrievals with data from the same balloon flights, presented in the companion paper of Russell et al. (1996b), yielded agreement within ±7% in the alti-tude range ∼21–31 km (50–5 hPa) with much larger differences at the lowermost com-parison levels (−53% at 100 hPa or 17 km) (Russell et al., 1996b).
15
The FIRS-2 profiles were acquired on 24 January 2007 at 10:11 UT (68◦N, 22◦E). The coincident ACE-FTS profiles were obtained at sunrise on 23 January 2007 at 08:25 UT (occultation sr18561, 64.7◦N, 15.0◦E; distance: ∼481 km). The low float altitude (∼28 km) of the balloon for this particular flight limits the vertical range of the comparison to 31 km. It should be noted that the precision for the CFCs was below 20
normal for this specific FIRS-2 flight, given the short time float and very cold tempera-tures lowering the signal-to-noise ratio (S/N) in the wavelength region from which CFCs are retrieved. The FIRS-2 profiles, provided on a 1 km-spacing altitude grid, are inter-polated onto the ACE-FTS altitude grid (1 km-spacing). The position of the FIRS-2 footprint was well inside the ARCTIC vortex, while the ACE-FTS footprint was near the 25
edge of the vortex. As a result, atmospheric subsidence mismatches are anticipated between the two measurements.
ACPD
8, 3431–3495, 2008 Validation of HCl, HF, CCl3F and CCl2F2 from ACE-FTS Title Page Abstract Introduction Conclusions References Tables Figures ◭ ◮ ◭ ◮ Back CloseFull Screen / Esc
Printer-friendly Version Interactive Discussion
3.5 Mark-IV measurements of HCl, HF, CFC-11 and -12
The Jet Propulsion Laboratory (JPL) Mark-IV (hereinafter MkIV) Interferometer (Toon, 1991) is an FTIR spectrometer designed for remote sensing of atmospheric composi-tion and is optically very similar to the ATMOS instrument. It has been used for ground-based observations as well as balloon-borne measurements since 1985. When flown 5
as part of a high-altitude balloon payload, it provides solar occultation measurements in the spectral range 1.77–15.4 µm (650–5650 cm−1), with high signal-to-noise ratio and high resolution (0.01 cm−1).
The retrieval altitude range generally extends from the cloud tops (5–10 km) to the float altitude (typically 38 km), with a vertical spacing of 0.9–3 km (depending on latitude 10
and altitude) and a circular field-of-view of 3.6 mrad, yielding a vertical resolution of ∼1.7 km for a 20 km tangent height (Toon et al., 1999).
The retrievals are conducted in two distinct steps. Firstly, slant column abundances are retrieved from the spectra using non-linear least squares fitting. Secondly, the matrix equation relating these measured slant columns to the unknown vmr profiles 15
and the calculated slant path distances is solved. This produces retrieved vmr vertical profiles for a large number of trace gas species including HCl, HF, CFC-11 and CFC-12 (Toon et al., 1999).
The uncertainty in the MkIV profiles is dominated by measurement noise and spec-troscopic errors. Other error sources (such as temperature uncertainties or pointing 20
error) can usually be neglected (Sen et al., 1998). The reported error for the HCl pro-files used in the following analyses ranges from 3 to 10% above ∼18 km. At lower altitudes, the error increases but remains smaller than 100% above ∼15 km. The HF errors are also quite small (<10%) from 20 to 38 km, with values rapidly increasing be-low this range (e.g., 50–70% at 17 km depending on the flight). The total error on the 25
CFC-11 retrievals is within 20% below 25 km but, above this altitude, it becomes con-siderable. For CFC-12, the profiles used in this study have errors of 3 to 30% (typically 5%) over most of the altitude range (from 10 to 35 km) with larger values (<100%) at
ACPD
8, 3431–3495, 2008 Validation of HCl, HF, CCl3F and CCl2F2 from ACE-FTS Title Page Abstract Introduction Conclusions References Tables Figures ◭ ◮ ◭ ◮ Back CloseFull Screen / Esc
Printer-friendly Version Interactive Discussion
the uppermost levels (Sen et al., 1998).
The quality of the MkIV observations was assessed through comparison with twelve in situ instruments embarked on the NASA ER-2 aircraft (Toon et al., 1999). The MkIV balloon and ER-2 aircraft flights occurred around Fairbanks (Alaska, USA) in 1997 as part of the Photochemistry of Ozone Loss in the Arctic Region In Summer (POLARIS) 5
experiment. These comparisons included three of the four species considered here. Briefly, a very good agreement was found between MkIV and the in situ instrument, with differences for HCl and CFC-11 within ±10% and as low as ±5% for CFC-12. In all three cases, there was no apparent systematic bias between MkIV and the coincident measurements (Toon et al., 1999).
10
Prior to the present study, MkIV data have been used for satellite validation stud-ies including several papers in the Journal of Geophysical Research special issue for UARS validation (J. Geophys. Res, 101(D6), 9539–10 473, 1996) and the validation of ILAS data (Toon et al., 2002). More recently, the MkIV data have been compared with the MLS HCl product (Froidevaux et al., 2006a; Froidevaux et al., 2008). For HCl, 15
MLS coincident profiles were compared with two MkIV observations around Ft. Sum-ner, New Mexico (34.4◦N, 104.2◦W) in September 2004 and showed good agreement – within the error bars – of 5 to 20% (Froidevaux et al., 2008).
For this work, we compare vmr profiles of HCl, HF, CFC-11 and CFC-12 retrieved from MkIV observations around Ft. Sumner, New Mexico, in September 2003, 2004 20
and 2005 with zonal averages of ACE-FTS data. There were no direct coincidences between ACE-FTS and the MkIV balloon flights, because ACE measurements around 35◦N never occur during the late-September turnaround in stratospheric winds. The ACE-FTS profiles were thus selected within a 10◦latitude band around Ft Sumner be-tween August and October in 2004, 2005 and 2006. At this time of the year, the atmo-25
spheric layers sounded by the instruments are sufficiently stable to allow for meaningful qualitative comparisons. About 90 ACE-FTS profiles were available in a latitude bin of ±5◦width centered at 34.4◦N. These were averaged to provide a zonal mean profile.
ACPD
8, 3431–3495, 2008 Validation of HCl, HF, CCl3F and CCl2F2 from ACE-FTS Title Page Abstract Introduction Conclusions References Tables Figures ◭ ◮ ◭ ◮ Back CloseFull Screen / Esc
Printer-friendly Version Interactive Discussion
3.6 Ground-based FTIR column measurements of HCl and HF
High-resolution IR solar spectra recorded under clear-sky conditions with ground-based FTIR (gb-FTIR) instruments have been analyzed to supply data for comparison with ACE-FTS v2.2 products. These observations have been recorded at 12 ground-based sites within the framework of the NDACC, with latitudes widely distributed among 5
the two hemispheres. Table 2 lists the station coordinates. Most instruments are commercial Bruker interferometers, either IFS-125HR, -120HR or -120M, except at the Toronto and Wollongong stations where Bomem DA8 spectrometers are operated. These interferometers are equipped with mercury-cadmium-telluride (Hg-Cd-Te) and indium-antimonide (InSb) detectors, which allow coverage of the 650–1500 and 1650– 10
4400 cm−1 spectral intervals, respectively. Spectral resolutions, defined as the inverse of the maximum optical path difference, range from 0.002 to 0.008 cm−1.
All ground-based instruments involved here perform regular measurements encom-passing the main IR absorption features of HCl, HF, CFC-11 and CFC-12. For the source gases however, the ground-based measurements are mostly sensitive to the 15
tropospheric contribution of their absorptions, with poor or no vertical information avail-able. These features are used to retrieve information on the atmospheric loadings of these two CFCs, and on their trends (e.g., Zander et al., 2005; Rinsland et al., 2005). Comparison with ACE-FTS measurements of the CFCs was not possible, as the ACE profiles are limited to the upper troposphere and lower stratosphere. Consequently, the 20
FTIRs will contribute here to the validation of ACE-FTS v2.2 HCl and HF products, for which both ground- and space-based viewing geometries provide reliable, compatible and comparable information, in the same altitude region of the atmosphere.
The retrievals have been performed using two algorithms. PROFFIT92 was used to analyze the Kiruna and Izana observations, SFIT2 (v 3.8 or v3.9) in all other cases. 25
Since both codes are based on the Optimal Estimation Method (OEM) (Rodgers, 1976), information on the vertical distribution of most of the FTIR target gases, including HCl and HF, can be retrieved from the measurements. The two algorithms have been
ACPD
8, 3431–3495, 2008 Validation of HCl, HF, CCl3F and CCl2F2 from ACE-FTS Title Page Abstract Introduction Conclusions References Tables Figures ◭ ◮ ◭ ◮ Back CloseFull Screen / Esc
Printer-friendly Version Interactive Discussion
compared by Hase et al. (2004) for a series of tropospheric and stratospheric species and proved to be highly consistent, for profile and column retrievals; in particular, the agreement was better than 1% for both HCl and HF.
The OEM implemented in both algorithms helps to characterize the retrieved prod-ucts, using the averaging kernel and related eigenvector formalism (e.g., Barret et al., 5
2003). Tools have been developed to perform these assessments and to evaluate the impact of the various fitting options, a priori inputs and assumptions made, on the information content.
Instead of using a single standardized retrieval strategy, approaches have been opti-mized by the FTIR data providers in order to generate the maximum information content 10
for HCl and HF, taking into account specific observation conditions at each site (dry-ness, altitude, latitude,. . . ) as well as instrument performance characteristics, such as the typical signal-to-noise ratio achieved and the spectral resolution. Table 3 pro-vides detailed information about the microwindows used, the fitted interferences, the number of independent pieces of information available (given by the trace of the aver-15
aging kernel matrix) or Degree Of Freedom for Signal (DOFS) and the altitude range of maximum sensitivity. Typical averaging kernels and eigenvectors corresponding to the adopted settings indicate that the retrievals of HCl and HF are mainly sensitive in the 12 to 35 km altitude range, with DOFS typically ranging from 1.4 to 3.8 for HCl and from 1.5 to 3.0 for HF (see Table 3). For Jungfraujoch, the first two eigenvalues (λ1 20
and λ2) are typically equal to 0.98 and 0.76, 0.98 and 0.66, respectively for HCl and HF, demonstrating that in both cases the impact of the a priori on the corresponding retrieved partial column is negligible, of the order of 2%. For most sites, additional information on the retrieval approaches adopted for HCl can be found in Appendix A of Rinsland et al. (2003). Relevant references are also provided in the last column of 25
Table 2. It is worth noting that HITRAN-2004 line parameters (Rothman et al., 2005) were adopted in all cases, for target and interfering species, consistent with the ACE-FTS. The impact of systematic uncertainties affecting the spectroscopic parameters of these species can therefore be neglected in the error budget.
ACPD
8, 3431–3495, 2008 Validation of HCl, HF, CCl3F and CCl2F2 from ACE-FTS Title Page Abstract Introduction Conclusions References Tables Figures ◭ ◮ ◭ ◮ Back CloseFull Screen / Esc
Printer-friendly Version Interactive Discussion
On the basis of the Jungfraujoch retrievals, statistical error analyses complemented with estimates based on the perturbation method have indicated that the smoothing er-ror is the main contribution to the erer-ror budget, followed by the measurement erer-ror and instrumental line shape uncertainties, independently evaluated with regular cell mea-surements. Once combined, the relative errors corresponding to stratospheric columns 5
are on average about 2.6 and 3.2% for HCl and HF, respectively. Comparative and complementary error estimates have been generated from PROFFIT runs for typical Kiruna observations, including evaluation of the impact of random error sources such as zero level uncertainties, channeling and tilt, fitted interferences, temperature uncer-tainties, and effect of spectrum signal-to-noise. For both species, uncertainties in the 10
temperature and zero level are the dominant error sources in this list. After quadratic combination, stratospheric column errors amount to ∼2.5% for HCl, and ∼3.0% for HF, i.e., commensurate with other estimates performed above.
Finally, HCl error budget evaluations performed in previous studies (e.g., Rinsland et al., 2003) further confirm the values quoted here, with a 3% random error associated 15
with a single stratospheric column retrieval from Kitt Peak spectra.
As mentioned earlier, both PROFFIT and SFIT2 use the OEM formalism. This is particularly useful when performing comparisons between measurements obtained with significantly different vertical resolutions. Indeed, it has been shown by Rodgers and Connors (2003) that a fair comparison requires convolution of the high-vertical-20
resolution measurement (ACE-FTS here) with the averaging kernel of the low-vertical-resolution data (gb-FTIR) using the following equation:
xs = xa+ A(xACE− xd) (1)
where xS is the resulting smoothed profile, xais the FTIR a priori, xACEis the ACE-FTS retrieved vertical distribution and A is the FTIR averaging kernel.
25
Actual or typical averaging kernels have been used to perform these operations, after proper extrapolation of the ACE-FTS profile down to the altitude site, using xa.
For most sites, time and space criteria for coincidence with ACE-FTS measurements have been set to ±24 h and 1000 km. However, the distance criterion was tightened
ACPD
8, 3431–3495, 2008 Validation of HCl, HF, CCl3F and CCl2F2 from ACE-FTS Title Page Abstract Introduction Conclusions References Tables Figures ◭ ◮ ◭ ◮ Back CloseFull Screen / Esc
Printer-friendly Version Interactive Discussion
to 500 km for Kiruna and Thule to minimize possible influence of the Polar vortex. For Reunion Island, it was relaxed to 1200 km to increase the number of coincidences, since there are fewer ACE-FTS measurements available at tropical latitudes.
Determination of the altitude range for partial column comparisons were objectively based on averaging kernel and/or eigenvector inspections and adopted in agreement 5
with the data providers. All corresponding values are listed in Table 3, for both reservoir species.
Densities have been computed using the pressure-temperature (p-T) information as-sociated with each data set. For ACE-FTS, p-T profiles retrieved from the spectra (Sect. 2) and made available together with the vmr distributions were used. For ground-10
based FTIRs, the daily p-T information used in the PROFFIT or SFIT2 retrievals was adopted; they are either based on NCEP (National Centers for Environmental Predic-tion) data, or on p-T soundings performed in the vicinity of the site.
4 Comparisons between ACE-FTS measurements and correlative data
The following subsections will present the HCl, HF, CFC-11 and CFC-12 comparisons, 15
starting with space-based instruments, then balloon-borne and ground-based FTIRs, in this order and when available.
Fractional differences (∆) between the vmrs or partial columns from ACE-FTS and the validating instrument (VAL) have been computed using the following formula:
∆ = 2 ×xxACE− xVAL ACE+ xVAL
in % (2)
20
Relative differences are statistically characterized by the standard deviation around the mean (denoted σ) and the standard error on the mean (as σ.√Nfor N coincidences).
ACPD
8, 3431–3495, 2008 Validation of HCl, HF, CCl3F and CCl2F2 from ACE-FTS Title Page Abstract Introduction Conclusions References Tables Figures ◭ ◮ ◭ ◮ Back CloseFull Screen / Esc
Printer-friendly Version Interactive Discussion
4.1 HCl comparisons
4.1.1 MLS
The version 2.2 ACE-FTS HCl profiles have been shown to agree quite well with MLS v2.2 HCl retrievals, within about 5 to 10% on average, from 100 to 0.2 hPa (i.e., ap-proximately from 16 to 60 km) (Froidevaux et al., 2008); furthermore, the latitudinal dis-5
tribution observed by MLS is well matched by that obtained from coincident ACE-FTS profiles. The above reference made use of data comparisons from mid-2004 through 2006; the results are essentially the same if one uses comparisons from 2007 alone, and they are not shown here. Instead, we show the time dependence of monthly zonal mean comparisons from all (4731) available coincident ACE-FTS and MLS profile pairs 10
in Fig. 1, at the 46 hPa pressure level (around 20 km). The monthly mean HCl averages from ACE-FTS and MLS are in good agreement, as shown by the error bars (2-σ) on the abundances as well as the differences in Fig. 1. As one would expect, the number of monthly coincidences is largest for the high latitude bins (the maximum number be-ing 285); the error bars in this figure give a good indication of the relative number of 15
coincidences. Figure 2 provides a similar view for the upper stratosphere (at 2.2 hPa or about 41 km), where the variations are smaller, but nevertheless well matched be-tween these two data sets. It should be pointed out that such time series comparisons are not meant to represent the best description of actual atmospheric variations versus time, as only coincident profile pairs, based on the ACE-FTS sampling pattern, are 20
included; we simply demonstrate that similar temporal changes can be obtained from such matched profiles.
4.1.2 HALOE
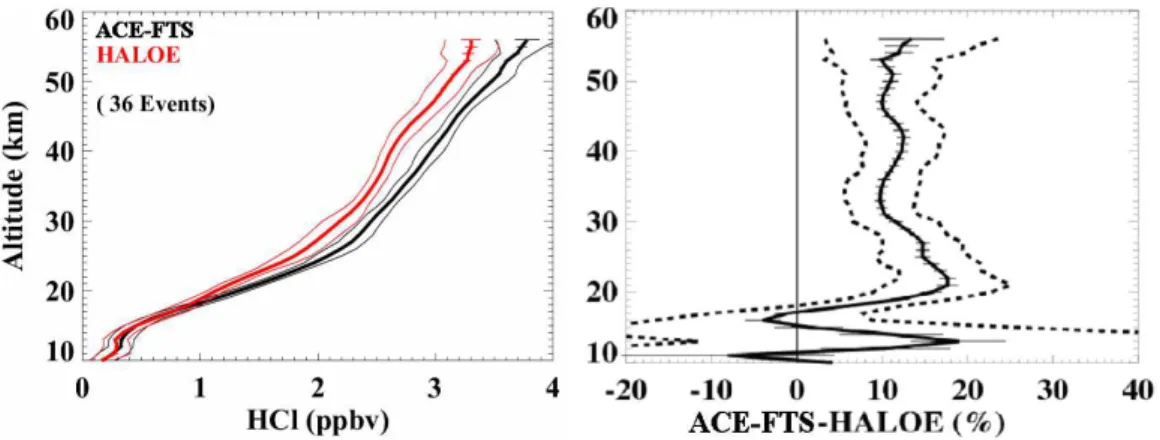
Figure 3 shows the average HCl profiles measured by both instruments for all coinci-dences (left frame). Although the analysis was performed separately for sunrise and 25
sig-ACPD
8, 3431–3495, 2008 Validation of HCl, HF, CCl3F and CCl2F2 from ACE-FTS Title Page Abstract Introduction Conclusions References Tables Figures ◭ ◮ ◭ ◮ Back CloseFull Screen / Esc
Printer-friendly Version Interactive Discussion
nificant results. Thus, only results for averages over all of the coincidences are reported here. Both instruments show vmrs increasing with altitude, with the ACE-FTS vmrs bi-ased high compared to HALOE above about 20 km. The thin lines in Fig. 3 represent the standard deviations of the distribution of profiles measured by each instrument, indicating that both instruments measure similar variability. Measurement variability is 5
quantified more clearly in Fig. 4, which shows the standard deviations of the distribu-tions relative to the mean mixing ratios. There is excellent agreement between the standard deviations of ACE-FTS and HALOE at all altitudes, with values on the order of about 5% from 20 to 55 km.
The right panel of Fig. 3 shows the fractional differences as a function of altitude. Av-10
erage differences are around 10–15% throughout the stratosphere, with the ACE-FTS biased high compared to HALOE above 17 km. This offset is commensurate with ear-lier intercomparisons (see Sect. 3.2), concluding that the HCl observations by HALOE are biased low with respect to other relevant data sets. This is also consistent with the conclusions from the MLS versus HALOE comparisons performed by Froidevaux 15
et al. (2008). These authors have noted that, despite a systematic bias, the MLS and HALOE spatial variations are very similar and of the same amplitude and sign as the one derived here.
4.1.3 SPIRALE
After locating the ACE-FTS occultation that was closest to the SPIRALE measure-20
ment, an additional “coincidence criterion” was investigated. Using the MIMOSA (Mod ´elisation Isentrope du transport M ´eso ´echelle de l’Ozone Stratosph ´erique par Ad-vection) contour advection model (Hauchecorne et al., 2002), potential vorticity (PV) maps in the region of both measurements have been calculated at each hour between 17:00 UT on 20 January 2006 and 08:00 UT on 21 January 2006 on isentropic sur-25
faces, every 50 K from 350 K to 800 K (corresponding to altitudes between 12.8 and 30 km). From these PV fields it can be deduced that SPIRALE and ACE-FTS vertical profiles were located in similar air masses in the well-established polar vortex over the
ACPD
8, 3431–3495, 2008 Validation of HCl, HF, CCl3F and CCl2F2 from ACE-FTS Title Page Abstract Introduction Conclusions References Tables Figures ◭ ◮ ◭ ◮ Back CloseFull Screen / Esc
Printer-friendly Version Interactive Discussion
whole range of altitudes. The dynamical situation was very stable with PV agreement better than 10%. Thus the geophysical situation is suitable for direct comparisons.
Before performing any comparison, the difference in the vertical resolution of the two instruments had to be taken into account, because ACE-FTS has a vertical resolution of 3–4 km while that of SPIRALE is on the order of meters. A triangular weighting 5
function of width equal to 3 km at the base (corresponding to the ACE-FTS estimated vertical resolution) was therefore applied to SPIRALE data at each of the ACE-FTS measurement altitudes, as in, e.g., Dupuy et al. (Sect. 4, Eq. (1), 2008). Conse-quently, the SPIRALE profile was truncated by 1.5 km at the bottom and at the top. Then, the resulting profile was interpolated on to the ACE 1 km-grid. The ACE-FTS 10
and SPIRALE HCl profiles (Fig. 5) are in good agreement between 16 and 20 km and above 23 km. Over these altitude ranges, the fractional differences lie between −2 and +27%. The lower (by more than 40%) HCl values observed by SPIRALE in the layer 20–23 km height are probably due to a PSC crossed by the gondola from 19.3 to 20.7 km height (detected by the onboard aerosol counter). Indeed, the use 15
of the HYSPLIT model (HYbrid Single-Particle Lagrangian Integrated Trajectory, see
http://www.arl.noaa.gov/ready/hysplit4.html) shows that the temperature encountered along the trajectories above 20.7 km during two days before the measurements were compatible with the formation of PSC particles, on which HCl may be adsorbed. At the time of the SPIRALE and of the aerosol counter measurements, the PSC has sed-20
imented. In general, the ACE-FTS HCl vmr values are larger than those of SPIRALE for the whole altitude range except at 24.5 km.
4.1.4 FIRS-2
The comparison between FTS and FIRS-2 HCl profiles is shown in Fig. 6. ACE-FTS reports systematically more HCl over the altitude range 12–31 km, with largest 25
fractional differences (>+90%) below 15 km where the HCl abundance is small (less than 0.4 ppbv). Above 15 km, the profile shapes are similar for ACE-FTS and FIRS-2, but the ACE-FTS vmr values are significantly larger than those of FIRS-2. The
ACPD
8, 3431–3495, 2008 Validation of HCl, HF, CCl3F and CCl2F2 from ACE-FTS Title Page Abstract Introduction Conclusions References Tables Figures ◭ ◮ ◭ ◮ Back CloseFull Screen / Esc
Printer-friendly Version Interactive Discussion
fractional differences are within +20 to +66% with smallest values at the uppermost levels. There are also indications of a high bias for MLS versus FIRS-2 HCl profiles in Froidevaux et al. (2008), although it’s hard to compare since these coincidences were obtained at different latitudes and seasons.
At present, the large difference between ACE-FTS and FIRS-2 remains unexplained. 5
All eleven HCl lines used in the FIRS-2 retrievals provide consistent results over the whole altitude range. These measurements were indeed obtained further north with respect to ACE-FTS, and they were performed in PSCs. However, a feature at 20 km in the ACE-imager extinction profiles supports the idea that the ACE-FTS observations could also have been influenced by PSCs, at least partially. Onboard the same gondola 10
than FIRS-2, the Submillimeterwave Limb Sounder (SLS) measured large amounts of ClO. Although HCl measurements performed by SLS were also higher than FIRS-2, it was not by the amount suggested by the comparison performed here and part of the difference could result from real HCl variability in winter high latitude stratosphere, in particular when comparing vortex-edge and inside-of-vortex air masses.
15
4.1.5 Mark-IV
The comparison between ACE-FTS and MkIV HCl profiles is shown in Fig. 7. The ACE-FTS zonal mean vmrs are in very good agreement (to better than ±7%) with the MkIV measurements above 20 km. Between 17 and 20 km, ACE-FTS reports less HCl than MkIV, by up to −20%. Below 17 km, the relative differences become extremely 20
large. This is mostly due to very small vmr values for both ACE-FTS and MkIV.
4.1.6 Ground-based FTIRs
Individual site comparisons have been performed, on the basis of the coincidence crite-ria defined in Sect. 3.6. Statistical results consisting of the mean fractional differences, corresponding standard deviations and standard errors are listed in Table 4, except 25
ACPD
8, 3431–3495, 2008 Validation of HCl, HF, CCl3F and CCl2F2 from ACE-FTS Title Page Abstract Introduction Conclusions References Tables Figures ◭ ◮ ◭ ◮ Back CloseFull Screen / Esc
Printer-friendly Version Interactive Discussion
the number of coincidences; 174 ACE-FTS occultations are used here, recorded from March 2004 to March 2007. Furthermore, a global mean and corresponding statistics are given at the end of the table, for all coincidences between 1000 and 500 km, re-spectively. Although no clear picture emerges from the statistics, it should be pointed out that (i) very few relative differences are significant at the 1-σ level; (ii) no PV fil-5
tering is included while the largest positive differences (∆; see Eq. (2) are generally obtained for high latitude sites (Ny ˚Alesund and Arrival Heights); (iii) although two of the three negative mean values are observed in the Southern Hemisphere (Wollon-gong and Lauder), no conclusion should be drawn regarding a latitudinal pattern in the differences, given the uncertainties affecting the means.
10
The overall relative difference is (6.9±15.9)% (1-σ), or (6.9±1.2)% (standard error). This would suggest a slight overestimation of HCl partial columns by ACE-FTS, on the order of a few percent. We note however that the largest individual fractional differ-ences, all observed at high northern and southern latitudes during the winter-spring time period, are included in this evaluation. When limited to the closest coincidences, 15
the mean ∆ is found equal to (3.6±10.1)% (1-σ), or (3.6±1.4)%.
In addition, all coincident HCl partial columns from ACE-FTS and from all 12 ground-based sites involved here have been included in a scatter plot (Fig. 8). Sites are iden-tified by various symbols and colors, data from all latitudes and seasons are included. It is worth mentioning that the magnitude of the partial columns is influenced by the 20
altitude ranges considered at each site in the partial column calculations (see Table 3 and Sect. 3.6). Moreover, measurements are not performed year-round at all sites. Hence, no direct conclusion should be drawn from their relative values and distribution. The linear regression to all data is reproduced by the dash-dotted black line, its slope and intercept are respectively equal to 0.90 and 5.52×10¹⁴molecules/cm2, 25
with a correlation coefficient R of 0.87. When restricting the data set to coinci-dences occurring within less than 500 km (see continuous black line and crossed-symbols), the correlation improves substantially with a slope of 0.98, an intercept of 1.82×10¹⁴molecules/cm2and a correlation coefficient of 0.95. This fitted straight line
ACPD
8, 3431–3495, 2008 Validation of HCl, HF, CCl3F and CCl2F2 from ACE-FTS Title Page Abstract Introduction Conclusions References Tables Figures ◭ ◮ ◭ ◮ Back CloseFull Screen / Esc
Printer-friendly Version Interactive Discussion
is compatible with the 1:1 line correlation, at the 95% confidence level. This improve-ment suggests that part of the comparisons include natural spatial variability for HCl, in particular in vortex-type situations, where subsided or chlorine-depleted air might be sampled. On the other hand, restriction of the time differences (e.g., to ±12 h) does not improve the correlation.
5
4.2 HF comparisons
4.2.1 HALOE
Similarly to Fig. 3, Fig. 9 shows the average HF profiles measured by both instruments for all coincidences, in left frame. Here again, only results for averages over all of the coincidences are reported. Both instruments show very similar profile shapes, but the 10
ACE-FTS vmrs are biased high compared to HALOE throughout most of the altitude range. Qualitatively, it is clear that both instruments measure similar variability below 30 km, but that ACE-FTS variability is higher above 30 km. Measurement variability is quantified more clearly in Fig. 10. As noted above, the ACE-FTS instrument shows higher variability above 30 km, probably indicative of poorer precision. Nevertheless, 15
the standard deviation profiles have similar shapes, with both instruments measuring an increase in variability near 30 km. This suggests that the larger variability near 30 km is a real geophysical feature. Although not shown here, this is analogous to the standard deviations seen in e.g., the CH4comparisons (De Mazi `ere et al., 2007). We believe that this is likely the result of summertime longitudinal variations arising from 20
differential meridional transport caused by breaking of westward-propagating waves that are evanescent in the summer easterly flow (e.g., Hoppel et al., 1999).
The right panel of Fig. 9 shows the percent differences between the instruments. Measurements from the ACE-FTS are biased high compared to HALOE, with mean differences around 5–20% from 15 to 49 km. As for HCl, the HF concentration mea-25
surements by HALOE have consistently revealed low biases when compared to other independent relevant datasets (i.e., Russell et al., 1996b; McHugh et al., 2005), whose
ACPD
8, 3431–3495, 2008 Validation of HCl, HF, CCl3F and CCl2F2 from ACE-FTS Title Page Abstract Introduction Conclusions References Tables Figures ◭ ◮ ◭ ◮ Back CloseFull Screen / Esc
Printer-friendly Version Interactive Discussion
magnitude is confirmed here.
4.2.2 FIRS-2
The results of the comparison for HF are shown in Fig. 11. ACE-FTS is systematically biased high with respect to FIRS-2. The extremely large relative differences at the lowermost altitude levels (>100% below 17 km) can be explained by the very low values 5
of the HF vmr at these altitudes, and by the negative vmr values (below 16 km) found in the FIRS-2 profile. This is also the range where the FIRS-2 quoted uncertainties are the largest (∼60%). Above 17–18 km, significant differences ranging between +17 and +50% are found, i.e., in any case larger than the 10% uncertainty estimates for FIRS-2. Although smaller than for the HCl comparison, the HF differences remain 10
significant over the whole altitude range. This is unexplained thus far, and such similar discrepancies are not confirmed when looking at ozone (Dupuy et al., 2008; Fig. 26).
4.2.3 Mark-IV
The results of the comparison for HF are shown in Fig. 12. Here also, there is good agreement between the ACE-FTS vmrs and MkIV. The relative differences are within 15
±10% above 19 km. For the same reasons as mentioned for HCl in Sect. 4.1.5, the discrepancies increase rapidly below this altitude.
4.2.4 Ground-based FTIRs
The same approach has been used to compare ACE-FTS and ground-based FTIR par-tial columns of HF. The last two columns of Table 4 give the corresponding statistical 20
results and number of available coincidences, found between March 2004 and Decem-ber 2006, using the same temporal and spatial criteria as before. Here again, most results are compatible with a no bias at the 1-σ level, although the number of coinci-dences is generally lower than for HCl. When considering all data together, we found a mean relative difference and corresponding standard deviation of (7.4±11.4)% (1-σ); 25
ACPD
8, 3431–3495, 2008 Validation of HCl, HF, CCl3F and CCl2F2 from ACE-FTS Title Page Abstract Introduction Conclusions References Tables Figures ◭ ◮ ◭ ◮ Back CloseFull Screen / Esc
Printer-friendly Version Interactive Discussion
or (7.4±1.1)% (standard error). There is no statistical difference in the mean if the 42 closest (<500 km) coincidences are selected.
Similarly to Fig. 8, Fig. 13 shows the HF partial column scatter plot. Distribu-tion of the 108 data points is already quite compact. The linear regression yields a slope of 1.05, an intercept of 0.43×10¹⁴molecules/cm2and a correlation coefficient of 5
0.96. Corresponding parameters indicate that the correlation is not improved when considering closer measurements (<500 km, symbols with plusses), with values of 0.96, 1.82×10¹⁴molecules/cm2 and 0.95, respectively. No direct comparison should be made between the HCl and HF scatter plots and data point distributions, as ground-based observations of these two species are not performed simultaneously. Contrary 10
to the HCl comparisons, chemical activation cannot be invoked to explain dissimilar-ities between in- and out-of-vortex air masses, but the impact of vertical dynamical motion could result in large partial column differences. It is however unlikely that such situation has been encountered for the HF comparisons, considering the absence of significant outliers. Overall conclusions are unchanged if measurements closer in time 15
are considered.
4.3 CFC-11 comparisons
4.3.1 FIRS-2
The CFC-11 comparison results are presented in Fig. 14. There is a very good agree-ment below 16 km with differences smaller than −10% (−20 pptv) from 12 to 16 km, 20
with ACE-FTS reporting slightly smaller CFC-11 vmrs than FIRS-2. Above 16 km, the fractional differences increase with increasing altitude, up to ∼−87% at 19 km. It should be noted that these differences consistently remain within the uncertainty estimates for the FIRS-2 profile.
ACPD
8, 3431–3495, 2008 Validation of HCl, HF, CCl3F and CCl2F2 from ACE-FTS Title Page Abstract Introduction Conclusions References Tables Figures ◭ ◮ ◭ ◮ Back CloseFull Screen / Esc
Printer-friendly Version Interactive Discussion
4.3.2 Mark-IV
Figure 15 shows the results of the CFC-11 comparison. The agreement is quite good. However, ACE-FTS vmr values are systematically smaller than those of MkIV, with differences on the order of −10% above 12 km and increasing to larger values (about −20%) below.
5
4.4 CFC-12 comparisons
4.4.1 FIRS-2
The ACE-FTS – FIRS-2 comparison for CFC-12 is shown in Fig. 16. Here, the vmr profiles for ACE-FTS and FIRS-2 have different shapes. The FIRS-2 profile has large uncertainty and shows only a slight decrease with increasing altitude, while the ACE-10
FTS vmr profile is more similar to that of CFC-11. Relative differences are positive (ACE-FTS vmrs larger than FIRS-2) from 12 to 20 km, with values close to +50% up to 17 km and decreasing quickly above. In the altitude range 17–24 km, the differences decrease with increasing altitude from +48% (+108 pptv) to −160% (−91 pptv) at the top of the comparison altitude range.
15
4.4.2 Mark-IV
Lastly, the ACE-FTS – MkIV comparison for CFC-12 is shown in Fig. 17. The differ-ences are similar to the results found for CFC-11, with ACE-FTS vmrs systematically lower than MkIV but with maximum differences on the order of −10%. These nega-tive differences in the CFCs comparisons with MkIV are consistent with the low biases 20
ACPD
8, 3431–3495, 2008 Validation of HCl, HF, CCl3F and CCl2F2 from ACE-FTS Title Page Abstract Introduction Conclusions References Tables Figures ◭ ◮ ◭ ◮ Back CloseFull Screen / Esc
Printer-friendly Version Interactive Discussion
5 Conclusions
In this paper, we have compared ACE-FTS v2.2 products with a series of available coincident or comparable profile or column measurements performed from space, bal-loons and from the ground, for HCl, HF, CFC-11 and CFC-12. Broad latitudinal and time coverage has been achieved for the reservoir species, with co-located measure-5
ments obtained from March 2004 to August 2007, from high-northern to high-southern latitudes, including sub-tropical and mid-latitude regions of both hemispheres.
For HCl, we have confirmed the very good agreement found by Froidevaux et al. (2008) between the ACE-FTS and MLS v2.2 data, when including the latest avail-able 2007 coincidences. Related comparison of vmr profiles between 100 and 0.2 hPa 10
(16 to 60 km) indicates very good consistency, with bias lower than 5%, and with no sig-nificant altitude pattern over this broad range of altitudes. Time series of monthly mean vmrs show very good agreement, in latitude, altitude and time. Statistical comparison with 36 HALOE v19 coincident HCl measurements suggests a systematic bias between both instruments, with the ACE-FTS vmrs 10 to 15% larger than those of HALOE over 15
the whole stratosphere. The variability captured by both space instruments is, however, in very good agreement.
ACE-FTS HCl vmr profiles have been further compared with balloon-borne measure-ments. A single coincidence with a SPIRALE high-vertical resolution measurement performed near 67◦N in January 2006 is also included. A good agreement (better than 20
∼20%) is found between retrieved HCl vmrs from 16 to 20 km and above 23 km. Below 16 km and around 22 km, we found the largest differences (ACE-FTS being higher), of more than 40%, and thus larger than combined uncertainties of both experiments. The analysis of the PV field does not suggest that large atmospheric inhomogeneities in sounded vortex air account for the observed discrepancies, but the presence of a 25
PSC detected in situ by SPIRALE may explain the disagreement in the height range 20–23 km. Comparison with a single FIRS-2 profile obtained near 68◦N in January 2007 shows large differences, from 0.1 to 0.7 ppbv (i.e., with ACE-FTS always larger
ACPD
8, 3431–3495, 2008 Validation of HCl, HF, CCl3F and CCl2F2 from ACE-FTS Title Page Abstract Introduction Conclusions References Tables Figures ◭ ◮ ◭ ◮ Back CloseFull Screen / Esc
Printer-friendly Version Interactive Discussion
by at least 20%, and up to 65%, relative to FIRS-2) in the 13 to 31 km altitude range. An ACE-FTS zonal mean profile was compared with three MkIV observations obtained in the fall of 2004 and 2005 around 35◦N. Very good agreement to better than ±7% is obtained above 20 km and hence lower than the MkIV estimated uncertainty of ±10%. The agreement is less satisfactory at lower altitudes, where the HCl vmrs decrease 5
rapidly while the corresponding uncertainties for both instruments are rapidly increas-ing.
Finally, comparisons of stratospheric partial columns were performed with NDACC FTIR data, collected over a wide range of latitudes. Considered together and restricted to coincident measurements taken less than 24h and 500 km apart, we found a com-10
pact correlation between ACE-FTS and gb-FTIR data, with a correlation coefficient (R) of 0.95 and a slope of 0.98. The intercept of 1.82×10¹⁴molecules/cm2 suggests that ACE-FTS is slightly biased high, which is confirmed by the mean fractional difference of (3.6±1.4)% (standard error), obtained from the same group of points.
The same set of coincident measurements from ACE-FTS and HALOE was used for 15
HF comparisons. On average, they indicate that ACE-FTS provides similarly shaped profiles, but larger by 5 to 20% in the 15–49 km range, which is in line with earlier HALOE-related intercomparisons discussed in Sect. 3.2. Both instruments show fur-ther evidence of larger HF variability around 30 km, which is believed to be a real geophysical characteristic of the data sets used here. Similarly to the HCl compari-20
son, the FIRS-2 vertical distribution systematically shows lower vmr values for HF (0.2 to 0.6 ppbv), with relative differences exhibiting similar vertical structure but lower am-plitudes, generally between 20 and 50%. In contrast, zonal mean comparisons with MkIV data yield good agreement above 19 km, the relative differences being smaller than ±10%, i.e., in line with the 10% error associated to these balloon-borne measure-25
ments.
ACE-FTS and gb-FTIR HF partial columns have also been compared. The whole data set consisting of 108 pairs of simultaneous measurements (within 24 h and 1000 km) has a mean relative difference of (7.4±1.1)% (standard error). The scatter


![[PDF] Introduction à Prolog : opérations, récursivités et Bases de données | Formation informatique](data:image/gif;base64,R0lGODlhAQABAIAAAP///wAAACH5BAEAAAAALAAAAAABAAEAAAICRAEAOw==)