Distinct roles for inhibitory neuron subtypes in cortical circuits:
An examination of their structure, function, and connectivity
by
Caroline A. Runyan
B.S. Neuroscience Allegheny College, 2004
SUBMITTED TO THE DEPARTMENT OF BRAIN AND COGNITIVE SCIENCES IN PARTIAL FULFILLMENT OF THE REQUIREMENTS FOR THE DEGREE OF
DOCTOR OF PHILOSOPHY IN NEUROSCIENCE AT THE
MASSACHUSETTS INSTITUTE OF TECHNOLOGY
JUNE 2012
@ Massachusetts Institute of Technology. All rights reserved
RC
ARCHIVS
Signature of Author:
i
I
Department of Brain and Cognitive Sciences
i April 20,2012
Certified by:
Mriganka Sur, PhD Paul E. Newton Professor of Neuroscience Thesis Supervisor Accepted by
Earl K. Miller, PhD Picower Professor of Neuroscience Director, Department Graduate Program
Distinct roles for inhibitory neuron subtypes in cortical circuits:
An examination of their structure, function, and connectivity
by
Caroline A. Runyan
Submitted to the Department of Brain and Cognitive Sciences on
April 20, in Partial Fulfillment of the Requirements for the Degree
of Doctor of Philosophy in Neuroscience
ABSTRACT
Parvalbumin-containing (PV+) neurons and somatostatin-containing (SOM+) neurons are
two key cortical inhibitory cell classes that are poised to play distinct computational roles
in cortical circuits: PV+ neurons form synapses on the perisomatic region near the spike
initiation zone of target cells, while SOM+ neurons form synapses on distal dendrites. The
goals of this thesis are to better understand the functional roles of these two cell types with
four major lines of questioning. 1) When and how do PV+ and SOM+ neurons respond to
visual stimuli? 2) How do inhibitory neurons obtain their response selectivity? 3) How do
PV+ and SOM+ neurons affect the responses of their targets? and 4) What are the targets of
PV+ and SOM+ neurons? We used Cre-lox recombination to introduce either fluorescent
protein or channelrhodopsin to PV+ or SOM+ neurons, targeting these cells for two-photon
targeted physiological recording and morphological reconstruction, or selectively
stimulating the population of PV+ or SOM+ neurons or stimulating single PV+ or SOM+
neurons. We find diverse response properties within both groups, suggesting that further
functional subclasses of PV+ and SOM+ neurons may exist. Furthermore, orientation
selectivity was strongly correlated to dendritic length in PV+ neurons, whose orientation
preferences matched the preferences of neighboring cells, implying that inhibitory neurons
may obtain selectivity by spatially limiting their sampling of the local network. When we
stimulated PV+ and SOM+ neurons, we found that they perform distinct inhibitory
operations on their targets: PV+ neurons divide responses while SOM+ neurons subtract.
Even single PV+ and SOM+ neurons were capable of suppressing responses of other cells in
the local network, but their functional targeting was sparse and followed different rules of
wiring: PV+ neurons functionally suppressed a higher percentage of cells that shared their
own tuning, while SOM+ neurons seemed to target other neurons independently of their
preferred orientations. By studying the response properties and functional impacts of PV+
and SOM+ neurons in the intact primary visual cortex, we have gained insight into what
information these cells are carrying and how they contribute to the response properties of
other cells, which apply to cortical circuits in general.
Acknowledgments
Chris Baker, for his unwavering encouragement, support, humor, patience, and positivity -it's impossible to imagine the last six years without him. My parents, Charles and Diane, for their loving support; they always ensured I had every opportunity to pursue science and math. My brothers: Albert, John-Paul, and Simon. My huge, loving, extended family,
especially my godparents Hal and Ann. My friends, especially Kaylin and Liz, and BCS 2006 classmates. The members of the Sur laboratory, past and present, particularly Travis Emery and the outstanding scientists I was lucky enough to closely collaborate with and learn from: James Schummers, Audra Van Wart, and especially Nathan Wilson, whose fresh perspective, incredible engineering skills and amazing optimism made our long experiments fun. My committee members: Chris Moore, as colleague in the field and caring mentor within the BCS program; Emery Brown, who has made himself easily available anytime I needed help with my analyses; and Ann Graybiel, whose mentorship, encouragement, and discussions have been invaluable. And last but certainly not least, my advisor Mriganka Sur, whose enthusiasm, open-mindedness, intellect, support, and true kindness enable outstanding work to go on in his laboratory everyday, and have shown me the ideal on which to model my own career.
Table of Contents
C h a p te r 1 : In tro d u ctio n ...
9
1.1 Background... 9
1.2 O rganization of Thesis ... 12
1.3 R eferences...12
Chapter 2: Response features of parvalbumin-expressing and
somatostatin-expressing interneurons suggest precise roles for subtypes
o f in h ib itio n in v isu a l co rtex ...
. 1 7
2.1 Sum m ary...172.2 Introduction ... 17
2.3 Experim ental Procedures...20
2.4 R esults...26
2.5 D iscussion ... 44
2.6 R eferences...51
Chapter 3: Tight coupling of structure and function in cortical inhibitory
n e u ro n s ...
5 7
3.1 Sum m ary ... 573.2 Introduction ... 57
3.3 Experim ental Procedures...59
3.4 R esults...64
3.5 D iscussion ... 76
3.6 R eferences...80
Chapter 4: Division and subtraction by distinct cortical inhibitory
n etw o rk s in vivo ...
8 3
4.1 Sum m ary ... 834.2 Introduction ... 83
4.3 Experim ental Procedures...85
4.4 R esults...96
4.5 D iscussion ... 111
4.6 R eferences...113
Chapter 5: Mapping the functional targeting of single cortical inhibitory
n eu ro n s in vivo ...
1 1 9
5.1 Sum m ary ... 1195.3 Experim ental Procedures...121
5 .4 R e su lts ... 1 2 7 5.5 Discussion ... 144
5.6 References...147
Chapter 6: D iscussion ...
... 149
6.1 W hat inform ation are specific inhibitory cell classes carrying?...149
6.2 How do inhibitory neurons obtain their response properties?...151
6.3 How do inhibitory neurons affect sensory processing in their targets?...152
6.4 Functional connectomics: What are the target cells of PV+ and SOM+ neurons?...154
6.5 Conclusion...156
Chapter 1: Introduction
1.1 Background
Inhibitory interneurons, which are primarily local circuit neurons that release GABA upon firing, comprise roughly 30% of the neuronal population of the cerebral cortex
(DeFelipe and Farifias, 1992). Many critical roles have been proposed for inhibition in cortical circuits, falling within two general categories: (1) balancing excitation and (2) controlling the timing of spiking in other neurons. Maintaining excitation levels within the proper dynamic range for information transfer is a delicate process - runaway excitation leading to saturation of signals and even seizure must be prevented, but also excitation must not be overly suppressed so that smaller yet relevant signals do not pass through. Therefore, inhibition may be involved in setting the response threshold in its targets, determining which stimulus strengths elicit supratheshold responses (sharpening the response selectivity of target cells). Indeed, blocking GABAA receptors decreases stimulus selectivity of cells at many levels of sensory processing (Sillito, 1979; Tsumoto et al., 1979; Sato et al., 1996; Crook et al., 1997; Chen and Jen, 2000; Wang et al., 2000a; 2000b). Inhibition also maintains the proper dynamic range of activity (response gain), allowing target cells to maintain sensitivity across varying levels of drive (Katzner et al., 2011). Regarding timing, inhibition can prevent prolonged responses or precisely control the timing of spikes (Pouille and Scanziani, 2001; Berger, 2003; Pouille et al., 2009), or through rhythmic behavior synchronize the spiking within local areas or even across brain regions (Whittington et al., 1995; Whittington and Traub, 2003; Cardin et al., 2009). The results presented in this thesis are primarily related to the first category of inhibitory functions, the role of inhibition in balancing excitation.
The cortical inhibitory neuron population includes a vast diversity of cell types that vary across many dimensions, including axon targeting, dendritic span, firing pattern, and neurochemical composition (Gonchar and Burkhalter, 1997; Kawaguchi and Kondo, 2002; Markram et al., 2004; Burkhalter, 2008; Helmstaedter et al., 2009a; 2009b). For instance,
predominantly fast-spiking, responding to intracellular current injection with a barrage of narrow spikes (Kawaguchi and Kubota, 1997; 1998). Morphologically, they include basket cells that preferentially form synapses on the perisomatic region of their targets and chandelier cells that target synapses to the axon initial segment (Markram et al., 2004). On the other hand, inhibitory neurons that express the neuropeptide somatostatin (SOM) never express PV (Gonchar and Burkhalter, 1997; Gonchar et al., 2007; Xu et al., 2010), and include Martinotti cells and bipolar cells that target their synapses to the dendrites (Kubota et al., 1994; Kawaguchi and Kondo, 2002; McGarry et al., 2010). PV+ and SOM+ neurons can be further subdivided based on their physiological properties and their expression of other calcium binding proteins, neuropeptides, ion channel subunits, and neuromodulators and their receptors (Kubota et al., 1994; Kawaguchi and Kubota, 1996; 1997; Chow et al., 1999; Gonchar et al., 2002; Ma et al., 2006; Gonchar et al., 2007; McGarry et al., 2010). Still other subclasses can be defined that express neither PV nor SOM (Gonchar et al., 2007; Xu et al., 2010). These highly specialized subtypes have probably developed to perform unique functions.
However, in order to further our understanding of what functional roles different inhibitory cell classes might play, it is important to focus on subclasses defined in computationally relevant terms. Dendrite-targeted inhibition and soma-targeted inhibition, such as that provided by SOM+ and PV+ neurons, respectively, are likely to have unique impacts on the firing of the postsynaptic cell, as compartment-dependent distributions of GABAergic currents exist in many pyramidal cells (Connors et al., 1988; Gonchar et al., 2001), and the relative distances between the inhibitory synapses, excitatory synapses and the spike-initiation zone affect the impact of inhibition -determining whether it directly affects the efficacy of single excitatory synapses, or defines the size of the temporal window of input integration (Pouille and Scanziani, 2001; Berger, 2003; Spruston, 2008; Kanemoto et al., 2011).
The work described in this thesis attempts to determine the potential roles played by subtypes of inhibitory neurons in cortical circuits, in the context of the mouse primary visual cortex (V1). V1 is an ideal system in which to study the contributions of subtypes of neurons to computations performed by cortical circuits. It is there that orientation selectivity emerges, as the circular receptive fields encoded by thalamic inputs are
transformed to the receptive fields of V1 neurons that respond to edges of light and darkness. Each cell's characteristic orientation tuning curve, contrast response function, and spatial receptive field can be measured with a simple stimulus set, allowing for the rapid characterization of cells' response properties under normal conditions, and when inhibition is being manipulated. The mechanisms underlying the generation of orientation tuning and its contrast invariance have been hotly contested (Somers et al., 1995; Troyer et al., 1998; Ferster and Miller, 2000; Priebe and Ferster, 2008) in the several decades since they were first described by Hubel and Wiesel (1959), and it remains unclear whether inhibition plays any role in shaping response selectivity.
The mouse provides an ideal system in which to probe the properties of genetically-defined cell types, such as PV+ and SOM+ inhibitory neurons, as well as to selectively manipulate them. Cell-type-specific Cre-driver knock-in mouse lines combined with floxed viral constructs allow us to easily introduce fluorescing proteins such as red fluorescent protein (RFP) and optogenetic proteins such as channelrhodopsin-2, a light-sensitive cation channel, to any cell type that can be genetically defined in order to label it or manipulate it in vivo (Kuhlman and Huang, 2008; Cardin et al., 2009; Taniguchi et al., 2011). Such tools are not yet readily available in animal models that have been more traditionally used in visual neuroscience, and the mouse had been historically ignored by the field, being commonly assumed to be inferior due to its lack of well-defined functional maps of orientation preference in V1 (Ohki and Reid, 2007). However, although mice have lower visual acuity, neurons in mouse V1 develop orientation selectivity rivaling that of the cat and primate (Niell and Stryker, 2008), and thus the mechanisms underlying the generation of orientation selectivity may be the same.
All of the experiments in this thesis rely on the genetic capabilities of the mouse model, that have only recently allowed the targeted recording of genetically defined cell classes. In Chapters 2-3, PV+ and SOM+ neurons in mouse V1 are genetically labeled with RFP, and two-photon imaging is used to target these cell classes for cell-attached recordings or calcium imaging. Cell-attached recordings are used for high quality single cell response characterization, while calcium imaging is used to spatially relate the response properties of labeled inhibitory neurons and neighboring neurons. In Chapters
4-5, ChR2 is expressed in PV+ or SOM+ neurons, allowing us to use a blue laser to optically control the firing of these neurons, while measuring the impacts on nearby cells.
1.2 Organization of thesis
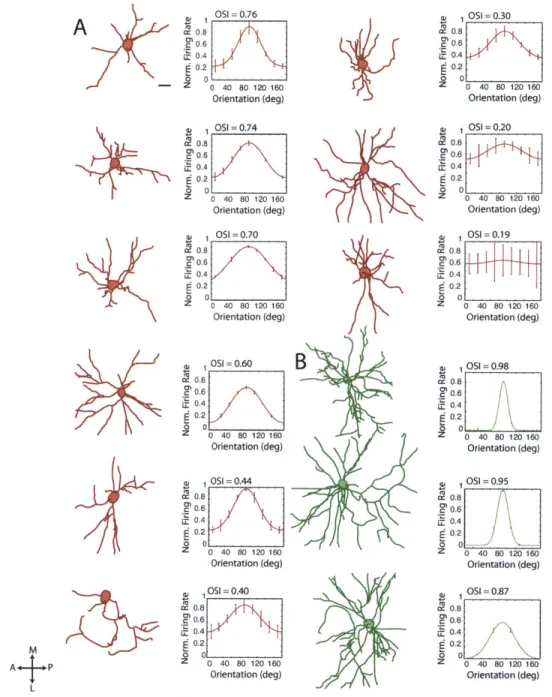
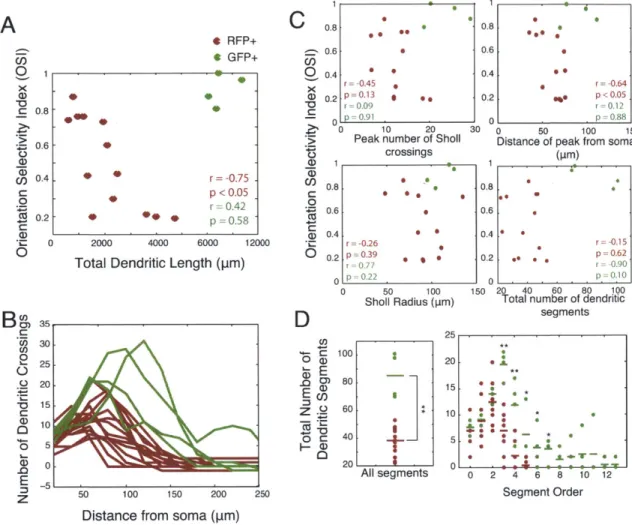
In chapter 2, the response properties of two subtypes of inhibitory neurons, soma-targeting PV+ neurons and dendrite-soma-targeting SOM+ neurons, are described. Both cell types show a range of tuning properties. PV+ cells can be either highly selective or broadly tuned for orientation, suggesting that further functional subclasses of PV+ neurons exist, while SOM+ neurons tend to be more highly selective for orientation, but to respond with a delay at lower firing rates. In chapter 3, the relationship between the response selectivity of PV+ neurons and their dendritic morphology is described, giving clues as to how inhibitory neurons may obtain their response properties. Highly tuned PV+ neurons have shorter, less tortuous dendritic processes, while untuned PV+ neurons have longer dendrites, though not wider dendritic fields. Furthermore, tuned PV+ neurons tend to share the orientation preference of the nearest neighboring cells, suggesting that these cells could obtain selectivity by spatially restricting the number of inputs they receive. In chapter 4, PV+ and SOM+ neurons are selectively activated, while measuring the effects on the visual processing of neighboring V1 neurons. The results show that PV+ soma-targeting inhibition divisively normalizes responses of target cells, while SOM+ dendrite-targeting inhibition subtracts responses. In chapter 5, single PV+ or SOM+ inhibitory neurons are activated while monitoring the activity of neighboring cells. These experiments suggest that PV+ and SOM+ neurons may select specific synaptic targets rather than blanketing neighboring cells with uniform inhibition. In chapter 6, the findings of the preceding chapters are integrated and discussed.
1.3 References
Berger T (2003) Timing and Precision of Spike Initiation in Layer V Pyramidal Cells of the Rat Somatosensory Cortex. Cerebral Cortex 13:274-281.
2:155-167.
Cardin JA, Carl6n M, Meletis K, Knoblich U, Zhang F, Deisseroth K, Tsai L-H, Moore CI (2009) Driving fast-spiking cells induces gamma rhythm and controls sensory responses. Nature 459:663-667.
Chen QC, Jen PH (2000) Bicuculline application affects discharge patterns, rate-intensity functions, and frequency tuning characteristics of bat auditory cortical neurons. Hear Res 150:161-174.
Chow A, Erisir A, Farb C, Nadal MS, Ozaita A, Lau D, Welker E, Rudy B (1999) K(+) channel expression distinguishes subpopulations of parvalbumin- and somatostatin-containing neocortical interneurons.
J
Neurosci 19:9332-9345.Connors BW, Malenka RC, Silva LR (1988) Two inhibitory postsynaptic potentials, and GABAA and GABAB receptor-mediated responses in neocortex of rat and cat.
J
Physiol(Lond) 406:443-468.
Crook JM, Kisvirday ZF, Eysel UT (1997) GABA-induced inactivation of functionally characterized sites in cat striate cortex: effects on orientation tuning and direction selectivity. Visual Neuroscience 14:141-158.
DeFelipe
J,
Farifias 1 (1992) The pyramidal neuron of the cerebral cortex: morphological and chemical characteristics of the synaptic inputs. Prog Neurobiol 39:563-607. Ferster D, Miller KD (2000) Neural mechanisms of orientation selectivity in the visualcortex. Annu Rev Neurosci 23:441-471.
Gonchar Y, Burkhalter A (1997) Three distinct families of GABAergic neurons in rat visual cortex. Cereb Cortex 7:347-358.
Gonchar Y, Pang L, Malitschek B, Bettler B, Burkhalter A (2001) Subcellular localization of GABA(B) receptor subunits in rat visual cortex.
J
Comp Neurol 431:182-197.Gonchar Y, Turney S, Price JL, Burkhalter A (2002) Axo-axonic synapses formed by somatostatin-expressing GABAergic neurons in rat and monkey visual cortex.
J
Comp Neurol 443:1-14.Gonchar Y, Wang
Q,
Burkhalter A (2007) Multiple distinct subtypes of GABAergic neurons in mouse visual cortex identified by triple immunostaining. Frontiers in neuroanatomy 1:3.Helmstaedter M, Sakmann B, Feldmeyer D (2009a) L2/3 interneuron groups defined by multiparameter analysis of axonal projection, dendritic geometry, and electrical excitability. Cereb Cortex 19:951-962.
Helmstaedter M, Sakmann B, Feldmeyer D (2009b) The relation between dendritic geometry, electrical excitability, and axonal projections of L2/3 interneurons in rat barrel cortex. Cereb Cortex 19:938-950.
Hubel DH, Wiesel TN (1959) Receptive fields of single neurones in the cat's striate cortex.
J
Physiol (Lond) 148:574-591.Kanemoto Y, Matsuzaki M, Morita S, Hayama T, Noguchi
J,
Senda N, Momotake A, Arai T, Kasai H (2011) Spatial Distributions of GABA Receptors and Local Inhibition of Ca2+ Transients Studied with GABA Uncaging in the Dendrites of CA1 Pyramidal Neurons Tell F, ed. PLoS ONE 6:e22652.Katzner S, Busse L, Carandini M (2011) GABAA Inhibition Controls Response Gain in Visual Cortex. J Neurosci 31:5931-5941.
31:277-287.
Kawaguchi Y, Kubota Y (1996) Physiological and morphological identification of
somatostatin- or vasoactive intestinal polypeptide-containing cells among GABAergic cell subtypes in rat frontal cortex.
J
Neurosci 16:2701-2715.Kawaguchi Y, Kubota Y (1997) GABAergic cell subtypes and their synaptic connections in rat frontal cortex. Cereb Cortex 7:476-486.
Kawaguchi Y, Kubota Y (1998) Neurochemical features and synaptic connections of large physiologically-identified GABAergic cells in the rat frontal cortex. Neuroscience
85:677-701.
Kubota Y, Hattori R, Yui Y (1994) Three distinct subpopulations of GABAergic neurons in rat frontal agranular cortex. Brain Res 649:159-173.
Kuhlman SJ, Huang ZJ (2008) High-resolution labeling and functional manipulation of specific neuron types in mouse brain by Cre-activated viral gene expression. PLoS ONE 3:e2005.
Ma Y, Hu H, Berrebi AS, Mathers PH, Agmon A (2006) Distinct subtypes of somatostatin-containing neocortical interneurons revealed in transgenic mice.
J
Neurosci 26:5069-5082.Markram H, Toledo-Rodriguez M, Wang Y, Gupta A, Silberberg G, Wu C (2004) Interneurons of the neocortical inhibitory system. Nat Rev Neurosci 5:793-807.
McGarry LM, Packer AM, Fino E, Nikolenko V, Sippy T, Yuste R (2010) Quantitative classification of somatostatin-positive neocortical interneurons identifies three interneuron subtypes. Front Neural Circuits 4:12.
Niell CM, Stryker MP (2008) Highly Selective Receptive Fields in Mouse Visual Cortex.
J
Neurosci 28:7520-7536.
Ohki K, Reid RC (2007) Specificity and randomness in the visual cortex. Curr Opin Neurobiol 17:401-407.
Pouille F, Marin-Burgin A, Adesnik H, Atallah BV, Scanziani M (2009) Input normalization by global feedforward inhibition expands cortical dynamic range. Nat Neurosci 12:1577-1585.
Pouille F, Scanziani M (2001) Enforcement of temporal fidelity in pyramidal cells by somatic feed-forward inhibition. Science 293:1159-1163.
Priebe NJ, Ferster D (2008) Inhibition, spike threshold, and stimulus selectivity in primary visual cortex. Neuron 57:482-497.
Sato H, Katsuyama N, Tamura H, Hata Y, Tsumoto T (1996) Mechanisms underlying
orientation selectivity of neurons in the primary visual cortex of the macaque.
J
Physiol (Lond) 494 ( Pt 3):757-771.Sillito AM (1979) Inhibitory mechanisms influencing complex cell orientation selectivity and their modification at high resting discharge levels.
J
Physiol (Lond) 289:33-53. Somers DC, Nelson SB, Sur M (1995) An emergent model of orientation selectivity in catvisual cortical simple cells. J Neurosci 15:5448-5465.
Spruston N (2008) Pyramidal neurons: dendritic structure and synaptic integration. Nat Rev Neurosci 9:206-221.
Taniguchi H, He M, Wu P, Kim S, Paik R, Sugino K, Kvitsani D, Fu Y, Lu J, Lin Y, Miyoshi G, Shima Y, Fishell G, Nelson SB, Huang ZJ (2011) A Resource of Cre Driver Lines for Genetic Targeting of GABAergic Neurons in Cerebral Cortex. Neuron 71:995-1013. Troyer TW, Krukowski AE, Priebe NJ, Miller KD (1998) Contrast-invariant orientation
tuning in cat visual cortex: thalamocortical input tuning and correlation-based intracortical connectivity.
J
Neurosci 18:5908-5927.Tsumoto T, Eckart W, Creutzfeldt OD (1979) Modification of orientation sensitivity of cat visual cortex neurons by removal of GABA-mediated inhibition. Exp Brain Res 34:35 1-363.
Wang
J,
Caspary D, Salvi RJ (2000a) GABA-A antagonist causes dramatic expansion of tuning in primary auditory cortex. Neuroreport 11:1137-1140.Wang Y, Fujita I, Murayama Y (2000b) Neuronal mechanisms of selectivity for object features revealed by blocking inhibition in inferotemporal cortex. Nature Publishing Group 3:807-813.
Whittington MA, Traub RD (2003) Interneuron diversity series: inhibitory interneurons and network oscillations in vitro. Trends Neurosci 26:676-682.
Whittington MA, Traub RD, Jefferys
JG
(1995) Synchronized oscillations in interneuron networks driven by metabotropic glutamate receptor activation. Nature 373:612-615. Xu X, Roby KD, Callaway EM (2010) Immunochemical characterization of inhibitory mousecortical neurons: three chemically distinct classes of inhibitory cells.
J
Comp Neurol 518:389-404.Chapter 2: Response features of parvalbumin-expressing and
somatostatin-expressing interneurons suggest precise roles for
subtypes of inhibition in visual cortex.'
2.1 Summary
Inhibitory interneurons in the cerebral cortex include a vast array of subtypes, varying in their molecular signatures, electrophysiological properties, and connectivity patterns. This diversity suggests that individual inhibitory classes have unique roles in cortical circuits; however, their characterization to date has been limited to broad classifications including many subtypes. We used the Cre/LoxP system, specifically labeling parvalbumin (PV) or somatostatin (SOM) expressing interneurons in visual cortex of PV-Cre or SOM-Cre mice with red fluorescent protein (RFP), followed by targeted cell-attached recordings and two-photon imaging of calcium responses in vivo to characterize the visual receptive field properties of these cells. Despite their relative molecular and morphological homogeneity, we find that PV+ neurons have a diversity of feature-specific visual responses that include sharp orientation and direction-selectivity, small receptive fields, and bandpass spatial frequency tuning. SOM+ neurons had weak and delayed but highly selective visual responses. These results suggest that subsets of parvalbumin and somatostatin interneurons are components of specific cortical networks, and that perisomatic inhibition contributes to the generation of precise response properties.
2.2 Introduction
The balance between excitation and inhibition is critical for normal brain development and function. Indeed, disruptions in this balance are associated with a variety of brain disorders, including autism and schizophrenia (Rubenstein and Merzenich, 2003; Hensch, 2005; Lewis et al., 2005). Intracortical inhibition is thought to be important not only for
maintaining an appropriate dynamic range of cortical excitation, but also for shaping the response properties of cells and circuits in sensory cortices (Ferster and Miller, 2000; Monier et al., 2003; Wehr and Zador, 2003; Zhang et al., 2003; Marifio et al., 2005; Poo and Isaacson, 2009). The precise ways in which this is achieved remain unclear, however.
The elucidation of the roles for inhibition in cortical function is complicated by the vast diversity of inhibitory cell types. These cells can be distinguished based on their electrophysiological profiles, their morphologies, and their molecular signatures, suggesting that individual inhibitory cell classes may provide specific forms of inhibition and thus subserve unique functions (Markram et al., 2004; Burkhalter, 2008). For instance, the axons of some inhibitory neuron subtypes, such as calretinin- and somatostatin-positive cells, preferentially target neuron dendrites, while axons of others, such as parvalbumin-positive (PV+) basket cells and chandelier cells target the soma and axon initial segment, respectively (Kisvairday and Eysel, 1993; DeFelipe, 1997; DeFelipe et al.,
1999; Markram et al., 2004). PV+ cells thus represent a distinct morphological subclass of
inhibitory neurons, which are in an ideal position to efficiently suppress the output of their synaptic partners, while dendrite-targeting cells may have more subtle effects on neuronal responses and computations. Based on their wide dendritic geometry and extensive lateral axonal arbors (Kisvarday and Eysel, 1993; Wang et al., 2002; Stepanyants et al., 2009), and role in driving cortical synchrony (Cardin et al., 2009), a reasonable hypothesis is that PV+ cells have large integration fields resulting in relatively unselective responses that act generally to balance excitation. In contrast, based on their radial geometry and intracolumnar connectivity, dendrite-targeting somatostatin-positive (SOM+) interneurons may have small integration fields with feature-selective responses.
An ideal system for dissecting cell-specific roles in cortical information processing is the primary visual cortex (V1), where clear signatures of circuitry such as orientation and spatial frequency tuning arise and can be used to probe the function of specific cell types in
vivo. A number of studies have addressed the general role of inhibition in orientation
tuning, by either measuring the net inhibition impinging on excitatory cells (Ferster, 1986; Ferster et al., 1996; Anderson et al., 2000; Monier et al., 2003; Marinlo et al., 2005), or by manipulating inhibition pharmacologically (Sillito, 1975; Nelson et al., 1994), or electrically (Ferster et al., 1996; Chung and Ferster, 1998). However, to unravel the precise
contributions of inhibitory interneurons and understand the specific roles played by different inhibitory cell types, direct measurement of the tuning properties of each cell type is necessary.
Physiologically identified fast-spiking cells or genetically identified inhibitory interneurons have been characterized in the visual cortex of cats, rabbits, and rodents, but direct measurements of the receptive field selectivity of presumed or confirmed inhibitory neurons have yielded somewhat conflicting results (Hirsch et al., 2003; Swadlow, 2003; Cardin et al., 2007; Sohya et al., 2007; Niell and Stryker, 2008; Nowak et al., 2008; Liu et al., 2009a; Kerlin et al., 2010; Ma et al., 2010; Runyan et al., 2010; Zariwala et al., 2011). Importantly, although fast-spiking behavior has been closely associated with PV+ inhibitory interneurons, the relationship is not one-to-one. Fast-spiking cells can also be somatostatin-positive (SOM+) and PV-, and can include a diverse array of morphologies (Markram et al., 2004; Burkhalter, 2008). Likewise, not all PV+ neurons are fast-spiking (Blatow et al., 2003). Furthermore, excitatory fast-spiking cells have been reported in sensory cortex (Dykes et al., 1988; Gray and Mccormick, 1996), so that the precise nature of blindly recorded cell types often remains unclear. Thus, more definitive experimental approaches were needed to characterize the physiological properties of specific cell classes.
Several recent studies, using knock-in mice expressing the GAD67-GFP (Aneo) transgene, have characterized the orientation tuning of inhibitory neurons (Sohya et al., 2007), and inhibitory neurons subclassified electrophysiologically into fast-spiking and regular-spiking inhibitory neurons (Liu et al., 2009a), or immunohistochemically into PV,
SOM or vasoactive intestinal peptide (VIP) containing neurons (Kerlin et al., 2010). These studies found that inhibitory cells of all subtypes are broadly tuned for orientation, contradicting the findings of many studies in higher mammals (Hirsch et al., 2003; Cardin et al., 2007; Nowak et al., 2008), as well as more recent studies using other genetic methods to target inhibitory subtypes for recordings in mice (Ma et al., 2010; Runyan et al., 2010; Zariwala et al., 2011), which have shown the existence of inhibitory neurons that are as sharply tuned as excitatory neurons. Importantly, the GAD67-GFP (Aneo) knock-in mice develop with significant deficits in GABA production (Tamamaki et al., 2003), which is
findings thus need to be verified in mice with wild-type inhibitory circuitry, where the properties of subclasses of inhibitory neurons would be more faithfully expressed, before it is concluded that the properties of inhibitory neurons are different between mice and higher mammals.
We have used recently developed genetic-labeling techniques combined with in vivo two-photon guided cell-attached recording and calcium imaging to reveal the visual response properties of the PV+ soma/axon-targeting inhibitory neurons in layers 2/3 of visual cortex. Our measurements demonstrate that PV+ interneurons have a range of response features, and include a significant proportion of cells with precisely tuned responses, small receptive fields and bandpass spatial frequency tuning characteristics. We suggest that these cells are components of, and contributors to, highly specific networks that shape the selectivity of neuronal responses. Furthermore, we have compared the orientation selectivity and response latency of PV+ and SOM+ subtypes, finding that SOM+ neuron responses are weak and delayed, but that both cell types include
highly tuned neurons.
2.3 Experimental Procedures
2.3.1 Mice
Experiments were carried out in mice under protocols approved by MIT's Animal Care and Use Committee and conformed to NIH guidelines. Heterozygous PV-Cre knock-in driver mice, which express Cre in over 90% of PV+ neurons, and SOM-Cre knock-in mice were backcrossed into a C57BL/6 line (Hippenmeyer et al., 2005; Taniguchi et al., 2011). Mice heterozygous for the GAD67-GFP (Aneo) allele (Tamamaki et al., 2003) were maintained on a C5713L/6 background; only mice older than 8 weeks were used.
2.3.2 Viral Construct and Injection
RFP was expressed specifically in Parvalbumin+ (PV+) or Somatostatin+ (SOM+) interneurons in the visual cortex of PV-Cre or SOM-Cre mice by infection of the viral
construct shown in Figure 2.1A. The LS2L-RFP construct (Figure 2.1A) was packaged into adeno-associated virus (AAV, serotype 2/9) as described previously (Kuhlman and Huang, 2008). Six-week old PV-Cre mice were initially anesthetized with 4% isoflurane in oxygen, and maintained on 2% isoflurane. The skull was thinned along a 1mm line at the rostral edge of V1, and the remaining skull and dura were carefully punctured using a glass micropipette filled with the virus. Two injections were made at each site, one at 500[tm below the cortical surface, and one at a depth of 250[tm. A volume of 0.25ptl of virus was injected at 10 l1/min at each depth. After each injection, the pipette was held in place for five minutes prior to retraction to prevent leakage.
2.3.3 Animal Preparation
Two weeks post-injection, mice were anesthetized with a cocktail containing Fentanyl (0.05mg/kg), Midazolam (5mg/kg), and Medetomidine (0.5mg/kg), supplemented with isoflurane. The eyes were protected with ophthalmic ointment during the surgery, and moistened afterward with saline. A metal headplate was attached to the skull using superglue and dental acrylic, and a 2mm x 2mm craniotomy was performed over the primary visual cortex region (area 17). The exposed area was then covered with a thin layer of 2% agarose in ACSF (140mM NaCl, 5mM KCl, 2mM CaCl2, 1mM MgCl2, .01mM
EDTA, 10mM HEPES, 10mM Glucose, pH 7.4).
Mice were then transferred to a custom-built two-photon microscope (Majewska et al., 2000), where the headplate was screwed into a moveable stage, and 0.5% isoflurane in oxygen was supplied through a tube, and Fentanyl/Medetomidine was injected every hour. The body temperature was maintained at 37.52C with heating pads. The recording phase of physiology experiments typically lasted for 4-6 hours in calcium imaging experiments, and 8-12 hours in electrophysiology experiments.
2.3.4 Two-photon Microscopy
The microscope was made from a modified Fluoview confocal scanhead (Olympus Optical) and a titanium/sapphire laser providing 100fs pulses at 80MHz (Tsunami; Physics, Menlo Park, CA) pumped by a 1OW solid-state source (Millenia;
Spectra-Physics). Emitted fluorescence was detected using photomultiplier tubes (HC125-02; Hamamatsu, Shizouka, Japan). Imaging was performed through a 20x, 0.95 NA lens (1R2, Olympus Optical) using Fluoview software. We collected images at a 1Hz frame-rate, at depths between 130 and 300[tm below the cortical surface.
2.3.5 Targeted Cell-attached Recording
Glass pipettes with -1.5 tm tip size and 3-7Mfl resistance were filled with Alexa Fluor 488 (5uM, in saline, Molecular Probes, Eugene, OR) and introduced to the pia above the viral injection site at a 21-degree angle using a micromanipulator (Sutter, MP-285) under visual guidance with epifluorescence. Upon entering the brain, the pipette was guided toward RFP+ cells in superficial layer 2/3 of primary visual cortex under two-photon guidance. The laser was tuned to 920nm, which allowed excitation of both the Alexa 488 and RFP fluorophores simultaneously. The pipette was targeted to RFP+ cells while applying constant positive pressure (0.2 psi), which was monitored with a digital pressure gauge (General Tools). When the pipette was just touching the cell surface, positive pressure was released, and sustained negative pressure immediately applied (0.2-0.6 psi) to obtain a loose seal (Joshi and Hawken, 2006). If well-isolated spikes were detected during the display of a drifting grating that randomly changed orientation and direction at 8 Hz, then the cell's receptive field was assessed. Subsequently, current pulses (35 ms, 900-2000 nA) were delivered at 15 Hz for 30-60 seconds to fill the recorded cell. Only RFP+ cells that were distinctly filled during this procedure were included for analysis. In the same experiments, RFP- cells were targeted blindly. As the tip was slowly advanced through the cortex, -0.5 nA current pulses were delivered for 6.3 ms at .55 Hz, and the tip resistance was monitored. When the tip resistance increased substantially, positive pressure was released, and negative pressure immediately applied, as above. The location of the tip was still monitored under two-photon guidance; all RFP- cells were located within the injection site and were filled after recording. Recordings from GFP+ and GFP-neurons in GAD67-GFP mice were carried out similarly. Recordings were made with an Axoclamp-2A amplifier (Axon Instruments) using Clampex software (Axon Instruments, v8.1) at a sampling rate of 30 KHz and filtered between 300 Hz and 10 KHz.
2.3.6 Calcium Imaging
A glass pipette filled with Oregon Green Bapta-1 AM (OGB1-AM, 1.0mM, Molecular Probes, Eugene, OR) and Alexa Fluor 594 (100tM, Molecular Probes, Eugene, OR) was visually guided into the brain and lowered to a depth between 100 and 200ptm below the pial surface, and a small amount of dye was released using a picospritzer. The laser was tuned to 810nm, and one hour later, fluorescence changes in response to visual stimulation were monitored.
2.3.7 Visual Stimulation
Visual stimuli were displayed on a 17-inch LCD monitor placed 15cm from the eyes. Stimuli were generated in Matlab (Mathworks, Natick, MA) using the PsychoPhysics Toolbox (Brainard, 1997). Square wave drifting gratings with 100% contrast were used to test orientation, direction and spatial frequency tuning. Test stimuli were episodically presented, equally alternating with a blank gray screen with 8 or 16 second cycles. For calcium imaging experiments, orientation and direction selectivity was measured with oriented gratings presented at a spatial frequency of 0.05 cycles per degree (cpd), and a temporal frequency of 3 cycles per second (cps). Spatial frequency selectivity was measured at several random orientations (changing at 4Hz) and temporal frequency of 3 cps. For cell-attached recordings, attempts were made to optimize the spatial frequency and temporal frequency parameters of the oriented gratings for each cell's preference, ranging in spatial frequency from 0.01 to 0.05 cpd and in temporal frequency from 1 to 3 cps. Receptive field locations were determined with vertical and horizontal bars that drifted periodically across the screen at 18-second intervals; each bar was 5.1 degrees wide, moved in steps of 1.7 degrees, and contained a checkerboard pattern of white and black squares that reversed sign at 10Hz.
2.3.8 Data Analysis
Analysis of electrophysiological data was carried out with custom-written Matlab scripts. Time traces were imported into Matlab, smoothed with a Gaussian kernel, and spikes were detected offline with custom routines. Spikes were identified by detection of
neuron was measured for 10 seconds preceding visual stimulation for each trial. A neuron was considered visually responsive if its firing rate at the preferred orientation was significantly higher than its spontaneous firing rate, determined with a t-test. The spontaneous firing rate was then subtracted from the response to each orientation, the mean firing rate across the entire 4-second stimulus interval.
Calcium imaging data were also imported into Matlab, where the change in fluorescence from baseline was calculated for each pixel. First, the unstimulated PMT fluorescence intensity was subtracted from the image series, the fluorescence time series was smoothed with a Gaussian kernel, and the change in fluorescence normalized by the baseline fluorescence (AF/F) was calculated for each pixel. The baseline fluorescence was defined as the pixel's fluorescence intensity during the previous blank frame, so that the AF/F for a particular trial was equal to the mean fluorescence intensity during the stimulus presentation minus the baseline, divided by the baseline. This method is thus insensitive to changes in baseline fluorescence intensity that may occur through the course of a particular experiment. For receptive field mapping, stimuli were not episodically presented, and a fixed percentile of fluorescence intensity rather than the baseline intensity was subtracted. Individual neurons were circled manually, and astrocytes were not included. Astrocytes can be easily recognized from neurons in calcium images by their bright, irregular cell bodies, which we have confirmed in other experiments by labeling with the marker Sulforhodamine 101 (data not shown). The AF of the surrounding neuropil was subtracted from the AF of each neuron. The AF/F was then calculated as the mean AF/F within each neuron. Only neurons that were visually responsive, defined as having response values above the surrounding neuropil response for at least 50% of trials, were further considered.
The responses, firing rates or AF/F, were then fit to Gaussian functions (orientation, receptive field size) or a Difference of Gaussians (DOG, spatial frequency). Two measures of orientation selectivity were used: the orientation selectivity index (OSI) was calculated from the AF/F responses or firing rates as the vector average in the preferred direction, and the tuning width was taken as the half-width at half-height from the Gaussian fit (untuned cells that could not be fit with a Gaussian were assigned tuning widths of 90 degrees). The direction selectivity index (DSI) was also calculated from the Gaussian fit as
the difference of the response amplitude in each direction of the preferred orientation, divided by their sum. The half-width at half-height of the receptive field Gaussian was used as a measure of receptive field size. Finally, the preferred spatial frequency and spatial frequency tuning bandwidth were determined from the DOG function. The bandwidth was defined as the ratio of spatial frequencies yielding the half-maximal response (Niell and Stryker, 2008). The inverse Fourier transform of the excitatory and inhibitory components of the DOG then provided an estimate of the relationship between the center excitation and surround inhibition, as shown in the supplementary information (Enroth-Cugell and Robson, 1966, 1984; Shapley and Lennie, 1985).
Statistical comparisons were carried out using the Wilcoxon test, two-tailed t-test, and the Kolmogorov-Smirnoff test and yielded indistinguishable results. Values from the Wilcoxon test are reported under Results.
2.3.9 Immunohistochemistry
Immediately after physiology experiments were completed, mice were overdosed with pentobarbitol, and perfused transcardially with saline followed by 4% paraformaldehyde. The brains were then postfixed in 4% paraformaldehyde, cryoprotected in 30% sucrose, and 40iim sections were thaw-mounted and then immunostained for PV or GABA. Sections were blocked in 10% normal goat serum with 0.1% triton in PBS for 1 hour, incubated overnight in either mouse anti-PV (1:250,
Chemicon, MAB1572), or guinea pig anti-GABA (1:250, Millipore, AB175), then incubated in Alexa Fluor 633 goat anti-mouse or Alexa Fluor 488 goat anti-guinea-pig (1:200, Molecular
Probes, A21052, A11073), and coverslipped with Vectashield Hardset mounting media with DAPI (Vector Labs). Using a confocal microscope (Zeiss LSM 5 Pascal Exciter), z-stacks were obtained through the extent of RFP-labeled cells on sections that had been stained for PV or GABA respectively and these cells were then analyzed for colocalization with either marker. Counts of RFP+/PV+, RFP+/PV-, RFP-/PV+, RFP+/GABA+, RFP+/GABA-, and RFP-/GABA+ cells were made from these image stacks using ImageJ software (National Institutes of Health).
2.4 Results
In order to better understand the role of inhibition provided by PV+ cells in visual cortical circuits, we characterized their visual response properties, including orientation and direction tuning, spatial frequency tuning, and receptive field size. We accomplished this by specifically expressing red fluorescent protein (RFP) in PV+ cells and then performing in vivo two-photon-guided cell-attached recordings, and in parallel experiments, two-photon imaging of calcium responses. We then compared the orientation selectivity of PV+ and SOM+ neurons.
2.4.1 Neurons labeled with RFP are PV+ GABAergic interneurons
We used the Cre/loxP system to selectively label PV+ cells with RFP (Kuhlman and Huang, 2008), by injecting an adenoassociated virus (serotype 2/9) containing a loxpSTOPloxp-RFP construct (Figure 2.1A) into the primary visual cortex (V1) of PV-Cre knock-in mice (Hippenmeyer et al., 2005). To examine the specificity of RFP expression to the PV+ inhibitory population, we perfused the mice and harvested their brains, staining alternate sections for PV or GABA after in vivo functional imaging. Immunostains for PV and GABA (Figure 2.1B,C) demonstrated qualitatively that RFP+ cells are PV+ and GABA+ (though all PV+ cells need not be RFP+, particularly away from the center of the RFP labeled zone). Quantitative analysis of z-stacks of confocal images, through 453 RFP+ cells on sections that had been stained for PV, and 434 RFP+ cells on sections that had been stained for GABA, showed that 97.7% of RFP+ cells were PV+, and 97.9% of RFP+ cells were GABA+. Overall, up to 10% of GABA+ cells at the center of the viral injection site in PV-Cre mice were RFP+, a proportion consistent with estimates of PV+ interneurons in the cerebral cortex (Markram et al., 2004). In addition, we injected the virus into wild-type mice and did not observe RFP+ cells two weeks later, either in vivo or histologically (data not shown). Thus, RFP+ neurons targeted for in vivo recordings are PV+ GABAergic interneurons.
A
p lox STOP loxB
C
Figure 2.1. Specific labeling of PV+ inhibitory interneurons in visual cortex of PV-Cre mice. (A) The viral construct contained a floxed-STOP codon followed by RFP under control of the CMV promoter (Kuhlman and Huang, 2008). (B, C) Immunohistochemical verification of RFP expression. Sections containing virally-infected cells were immunostained for either (B) PV, or (C) GABA. Virtually all RFP+ cells were both PV+ and GABA+. Inset in (B) and images in (C) were taken from the depth at which in vivo recordings were performed (-130-300pm). Scalebars: (B) 100pm, inset: 50[tm, (C) 25im.
2.4.2 Orientation and direction selectivity of RFP+ and RFP- neurons is similar
A large proportion of PV+ neurons includes large basket cells, whose axonal arbors can stretch across many cortical layers and across multiple cortical columns, and preferentially innervate the somata of their targets (Kisvirday and Eysel, 1993; Gupta et al., 2000; Wang et al., 2002). Because of this wide-reaching geometry and soma-targeting output, we expected them to have broadly tuned responses and large receptive fields. However, we were surprised to find a diversity of orientation tuning characteristics in these cells, ranging from cells that responded to a broad range of orientations to others with highly selective responses, that responded only to one orientation (Figure 2.2).
2.4.2.1 Cell-attached Recordings
Under two-photon guidance, we targeted a dye-filled patch pipette to RFP+ and RFP- neurons. After characterizing the receptive field of each neuron, we ensured the identity of the recorded neuron by filling the cell (i.e., its soma and proximal dendrites) at the end of recording. Only RFP+ cells that were successfully and unambiguously filled (Figure 2.2A) were included in this study.
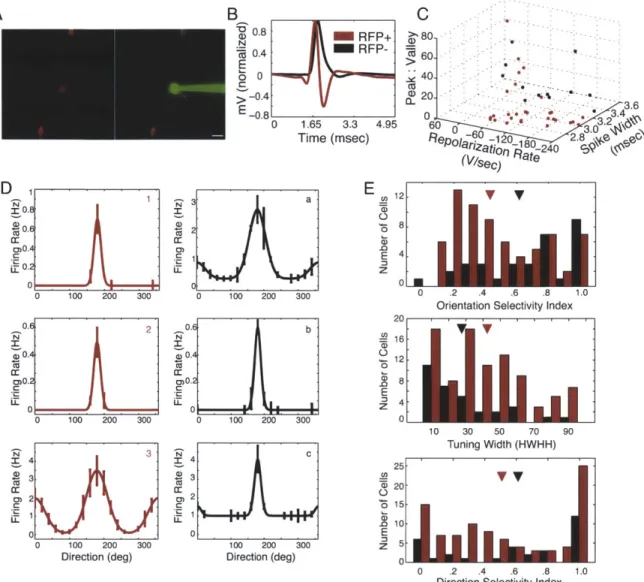
We recorded from 74 visually responsive RFP+ neurons and 34 visually responsive RFP- neurons in 27 PV-Cre mice. The spike shapes of the RFP+ and RFP- neurons were highly distinguishable (Figure 2.2B); the RFP+ neurons had narrower spike widths (RFP+: 3.Omsec + 0.018 s.d.; RFP-: 3.3msec + 0.011 s.d.; p < 0.05, two-tailed two-sample t-test here and below), smaller peak:valley amplitudes (RFP+: 7.91 + 16.81; RFP-: 21.52 + 20.08; p <
0.05), and a nonsignificant trend toward sharper repolarization rates (RFP+: 107.27V/sec +
69.39; RFP-: 105.45V/sec + 75.45, p = 0.76) (see Figure 2.2C). The spontaneous firing rate
was higher in the RFP+ PV+ neurons (RFP+: 1.3Hz + 2.2; RFP-: 0.4Hz ± 0.9; p<0.05), and there was a nonsignificant trend toward higher evoked firing rates in RFP+ PV+ neurons
(RFP+: 7.5Hz + 7.5; RFP-: 5.3 + 8.1; p = 0.13).
Although the spike shapes of the RFP+ neurons are on average different from those of the RFP- neurons, the variability in these waveform characteristics (Figure 2.2C) suggest that PV+ cells are a somewhat diverse electrophysiological population, and possibly include multiple functional subtypes. The measures that best distinguished RFP+ and RFP- cells,
B
.N 0 CC
>180 40 C2 0)20 - 0 * *0. 1.65 3.3 4.95 Time (msec) M cc LLE
12 4 0 0 E z3 3 4 3 2 0 100 200 300 Direction (deg) N I 0) 0) C 4c 3 2 100 200 300 Direction (deg) 20 16 12 8 4 0 -0-0Orientation Selectivity Index
I,',-10 30 50 70 90 Tuning Width (HWHH) 0 E z3 0 .2 .4 .6 .8 1.0
Direction Selectivity Index
Figure 2.2. Two-photon guided cell-attached recordings of PV+ interneurons reveal sharp orientation tuning in a subset of PV+ neurons. (A) RFP+ cells (red) were targeted with a patch pipette containing Alexa 488 dye (green). After the visual responses of each neuron were characterized, the cell was filled to confirm its identity. (B) The spikes recorded from RFP+ neurons and RFP- neurons were averaged and normalized by their maximum voltage. Spikes recorded from the RFP+ neurons show the characteristic shape of fast-spiking PV+ neurons. (C) The spike shapes of RFP+ neurons and RFP- neurons are distinct. The ratio of peak amplitude and valley amplitude (p<.05), repolarization rate (p>.1), and spike width (p<.01) are plotted for RFP+ and RFP- neurons. (D) Examples of orientation tuning curves from three RFP+ and three RFP- cells. The preferred direction was set to 180 degrees for ease of comparison of the tuning among cells. (1) OSI = 1.0, tuning width = 15.8 deg, DSI = 0.8. (2) OSI = 1.0, tuning width = 16.7 deg, DSI = 0.9. (3) OSI = 0.7, tuning width = 30.1 deg, DSI = 0.6. (a) OSI = 0.8, tuning width = 15.0 deg, DSI = 0.7. (b) OSI = 0.8, tuning width = 16.2 deg, DSI = 0.7. (c) OSI = 0.6, tuning width = 10.0 deg, DSI = 0.6. Error bars indicate SEM. (E) Population histograms of the OSI, tuning width, and DSI of RFP+ (red) and RFP- (black) cells. Arrowheads indicate the population means.
A
D_
N; 0, C Li:the spike width, repolarization rate and the peak:valley amplitude, probably reflect the strong colocalization of the Kv3.1 and PV proteins (Chow et al., 1999). The overlap between spike shape measures may additionally reflect the known diversity in expression of potassium channel subtypes in PV+ cells (Chow et al., 1999).
We used two separate measures, the orientation selectivity index (OSI) and the orientation tuning width, to characterize the orientation preference of each neuron. We recorded from low-firing but highly selective cells in both populations that responded to only one orientation in one direction (Figure 2.2D-E). The OSIs of RFP+ and RFP- neurons were statistically different (RFP+: 0.48 + 0.29; RFP-: 0.67 + 0.27; p < 0.01); however, both populations included highly selective neurons with OSIs equal to 1, and the distribution appears bimodal for the RFP+ population (Figure 2.2E). The orientation tuning width, calculated as the half-width at half-height of the best-fit Gaussian function, was also significantly different between the two populations (RFP+: 42.90 degrees + 30.0; RFP-: 30.20 degrees + 28.30; p < 0.05), though again both populations included sharply tuned cells. The direction selectivity index (DSI), computed by dividing the difference in the responses to the preferred orientation in two directions by the sum of the responses (Figure 2.2E), was not statistically different between the RFP+ and RFP- populations (RFP+: 0.51 + 0.38; RFP-: 0.61 + 0.39; p = 0.22).
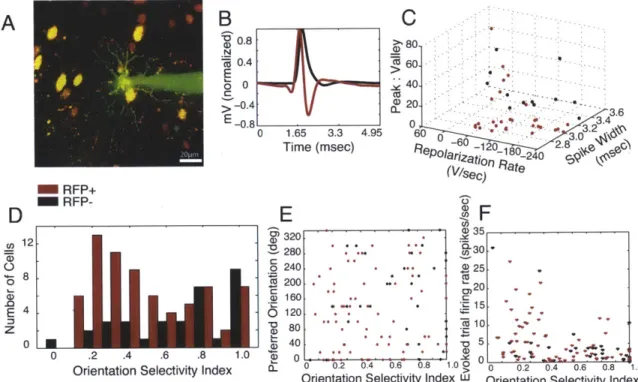
Given the diversity of tuning characteristics in RFP+ cells, we considered whether waveform characteristics, which are known to vary in different types of basket cells and other PV+ inhibitory interneurons (Wang et al., 2002; Blatow et al., 2003), might correlate with orientation selectivity (Figure 2.3). However, high OSIs were found in cells with all waveform characteristics, and there was no significant relationship between any of the spike shape parameters and OSI, within the RFP+ population (Peak:Valley and OSI: r = 0.13, p = 0.49; Spike Width and OSI: r = 0.04, p = 0.85; Repolarization Rate and OSI: r = 0.26, p =
0.16) or the RFP- population (Peak:Valley and OSI: 0.23, p = 0.47; Spike Width and OSI: r =
-0.30, p = 0.34; Repolarization Rate and OSI: r = 0.26, p = 0.41).
In separate experiments, we used two-photon guided cell-attached recording to assess the orientation tuning of GFP+ (GABAergic) neurons and GFP- (non-GABAergic)
Waveform Characteristics and
Orientation Selectivity
X a) "0 C U C 0 2U U) C C 0 C1
0.8 0.6 0.4 0.2 0 -0.2 -0.4 Time (ms) x 0 () U') C 0 C? L-a0 1 . 0. 0. 0. 0. 0. 0.4 0.3 0.2 0.1 0.1 1.0 0 0.9 0.8 0.7 0.6 0.5 0 0.4 0.3 0 0.2 4 0.1 2.7 2 1.0 0.9 0.8 0.7 0.6 0.5 0.4 0.3 0.2 0.1 0 .8 1 10 Peak :Valley 100 r = 0.13 r = 0.23 2.9 3.0 3.1 3.2 3.3 3.4 3.5 3.6 3.7 Spike Width (Ms) r = 0.04 r = -0.30 60 0 -60 -120 -180 -240 Repolarization Rate r = 0.26 (V/sec) r = 0.26Figure 2.3. Diversity of spike shape is not related to orientation tuning selectivity in RFP+ and RFP- neurons. The waveform is plotted against the orientation selectivity index (OSI) for each visually-responsive RFP+ and each RFP- neuron. None of these parameters predicted the strength
of tuning, as neurons with the strongest selectivity could be found with nearly every spike shape.
0 e 0 1 0 5 0 000 * * * . (D .N 0 z E 0. 0 0 0 *0 00 s 0s * * *e e. 0 g0 0 0 ..
2: 0) C *Lr 0 0 2 0 150 250 Direction (deg) C U 03 E GFP+ GFP-V
I
I
I
0 0.2 0.4 0.6 0.8 1Orientation Selectivity Index
0 8 V
0)6 04
z0
--0 20 40 60 80 100
Orientation Tuning Width (deg)
s 0 E 1 z -0 0.2 04 0.6 0.8 1
Direction Selectivity Index
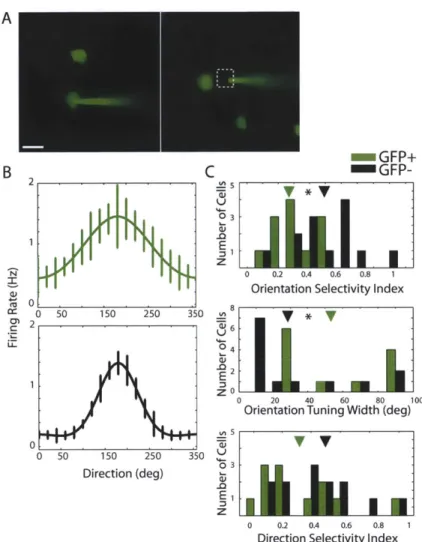
Figure 2.4. GFP+ (GABAergic) neurons are significantly less tuned than GFP- (non-GABAergic) neurons in the GAD67-GFP (Aneo) knock-in mouse line. (A) A patch pipette was targeted to GFP+
neurons (Left) and GFP- neurons (Right) under two-photon guidance, at depths between 100 and 300pm below the pial surface. After the visual response of each neuron shown was characterized, the cell was filled to confirm its identity. Scalebar = 20 ptm (B) Tuning curves of a representative GFP+ neuron (green, OSI = 0.22, tuning width = 87.5 degrees, DSI = 0.54) and GFP- neuron (black, OSI = 0.73, tuning width = 12.2 degrees, DSI = 0.77). Error bars indicate the SEM. (C) Population histograms of the orientation selectivity index (Top), orientation tuning width (Middle), and direction selectivity index (Bottom). Asterisks indicate significant differences (p < 0.05), which were found between GFP+ and GFP- neurons for orientation selectivity index and tuning width. Arrowheads indicate the mean of each population.
A
B
150 250 31
50 1
neurons in adult mice heterozygous for the GAD67-GFP (Aneo) allele (Tamamaki et al., 2003). Replicating earlier findings in these mice (cf. Sohya et al., 2007; Liu et al., 2009a), we found that GFP+ neurons were significantly more broadly tuned than GFP- cells (Figure 2.4), as assessed with OSI (GFP+: 0.33 + 0.13, n=12 cells; GFP-: 0.51 + 0.21, n=13 cells; p
<0.05) and with tuning width (GFP+: 55.19 degrees ± 25.94; GFP-: 33.19 degrees + 31.51; p<0.05). Furthermore, the OSI range of GFP+ neurons (0.1-0.5) were not only different from the OSI range of GFP- neurons (0.1-1) in the same mice but also from that of PV+ neurons in PV-Cre mice (0.1-1; Figure 2.2E) and of fast-spiking neurons in wild-type mice (0.1 -1.0 Niell and Stryker, 2008). That is, inhibitory neurons with the highest orientation selectivity are absent in GAD67-GFP mice, suggesting that the tuning properties of these neurons develop abnormally.
2.4.2.2 Calcium Imaging
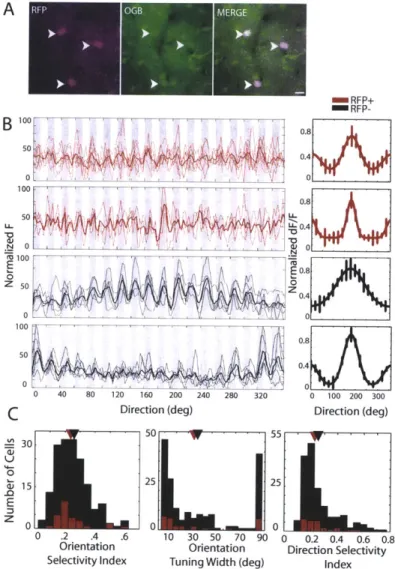
To compare responses in a larger sample of cells, we assessed the orientation tuning properties of RFP+ and RFP- neurons with two-photon calcium imaging (typically 20-30 RFP- neurons and 2-4 RFP+ neurons were recorded simultaneously, Figure 2.5AB).
We imaged 26 RFP+ and 173 RFP- visually responsive cells. The mean OSI in the two populations did not differ significantly (RFP+: 0.25 + 0.12; RFP-: 0.25 + 0.11; p = 0.72) (Figure 2.5C). In addition, the mean orientation tuning width was not significantly different in the two populations (RFP+: 36.02 degrees + 31.89; RFP-: 39.23 degrees + 31.44; p = 0.84). Thus PV+ interneurons displayed a range of orientation selectivity preferences, which was comparable to the rest of the visually responsive population of cells. RFP+ and RFP- cells with comparably sharp tuning were distributed among all animals and at all imaging depths. The mean DSI of the RFP+ cells (0.26 + 0.11) also did not
differ from that of the RFP- cells (0.27 ± 0.13; p = 0.72), although the highest DSIs of the RFP- cells were higher than those of the RFP+ cells.
2.4.3 Spatial frequency tuning and receptive field sizes are comparable in the RFP+ and RFP-populations
A
MERGE RFP+ SRFP-100BZ100
0. 50 0 100 0.8 50 -100 0 40 8 2 6 0 4 8 2 0I 10 20 30 3 5 0 505 -g
' - . E E0.8 0 z 04 0 0Orena ion cton ientaionDirolection ityg
1050
30.
0
00. .4 .60 12000709020 0.1200.60.8
Orientation rie ntaio Direction eit
Selectivity Index Tuning Width (deg) Index
Figure 2.5. In vivo two-photon calcium imaging of RFP+ and RFP- neurons reveals extensive overlap in the orientation tuning properties of PV+ interneurons and the unlabeled population. (A) Two weeks after viral infection, the calcium indicator 0GB was injected into the infected site. The RFP alone, 0GB alone, and merged images are shown. Arrowheads point to the same cells in each image. Scalebar = 10pm. (B) (Left) Calcium indicator responses of representative RFP+ cells (red traces) and RFP- cells (black traces) to episodically-presented oriented gratings at 20-degree intervals; each grating was drifted in a direction orthogonal to the grating orientation (gray shading: ON periods of stimulus presentation, white: OFF). Raw single-trial traces (thin lines) and mean response trace (thick lines) are shown. (Right) Gaussian tuning curves were fitted to the calculated AF/F responses for each stimulus, as described in Methods. The peak response is set to 180 deg for ease of comparison. Top RFP+ cell: OSI 0.23, tuning width = 32 deg, DSI = 0.3. Bottom RFP+ cell: 0SI = 0.53, tuning width = 19 deg, DSI = 0.5. Top RFP- cell: 0SI = 0.13, tuning width = 81 deg, DSI = 0.5. Bottom RFP- cell: OSI = 0.48, tuning width = 12 deg, DSI = 0.5. Error bars denote SEM. (C) Population histograms of the orientation and direction tuning properties of RFP+ (red) and RFP- (black) populations show the extensive overlap between the two cell populations in 0SI, tuning width, and DSI. Arrowheads on histograms mark the mean of each population.
characteristics of cells in the visual pathway, starting with retinal ganglion cells, reflect the spatial extent and magnitude of receptive field 'centers' and 'surrounds' (Enroth-Cugell and Robson, 1966). Responses to different spatial frequencies were recorded either by calcium imaging or cell-attached electrophysiology (Figure 2.6), and then fit to a Difference of Gaussians (DOG) model (Enroth-Cugell and Robson, 1966; 1984; Shapley and Lennie,
1985).
The preferred spatial frequency of cells measured with calcium imaging (Figure 2.6A) did not differ significantly between the RFP+ and RFP- populations (RFP+: 0.031 cpd + 0.019; RFP-: 0.033 cpd + 0.024; p = 0.81). The tuning bandwidth was defined as the ratio
of spatial frequencies with half-maximal responses. The mean bandwidths of the two populations were also similar (RFP+: 5.70 octaves+ 0.67; RFP-: 5.55 octaves + 0.92; p=0.97). The presence of a low frequency roll-off in the spatial frequency tuning curves is consistent with a suppressive receptive field surround mechanism. The demonstration of this roll-off in some PV+ inhibitory neurons indicates that at least some inhibitory cells have suppressive receptive field components (Figure 2.7).
In fact, the spatial frequency tuning curve of a neuron can be interpreted as the Fourier transform of its spatial receptive field (Enroth-Cugell and Robson, 1966). In V1 cells, for instance, significant low spatial frequency roll-offs likely indicate suppressive 'surrounds' to their receptive field 'centers' (Sceniak et al., 1999), consistent with lateral inhibition impinging on these cells or in input pathways to these cells. We were surprised to find that many PV+ cells did in fact have significant suppressive 'surrounds' (Figures 2.6, 2.7).
Although the DOG model is most applicable to circular receptive fields with concentric center and surround regions, we essentially assessed the spatial frequency tuning at the preferred orientation of each neuron, measuring the spatial frequency tuning orthogonal to the long axis of the oriented receptive field. Thus the DOG fit allowed us to estimate the extent of 'center' and 'surround' of each cell orthogonal to the orientation axis (Figure 2.6). The 'surround' inhibition could be supplied by either the subfield antagonism of the OFF flank of a simple cell, or the suppressive surround of a complex cell. We found considerable heterogeneity in the extent of surround inhibition in both the RFP+ and