HAL Id: hal-00317843
https://hal.archives-ouvertes.fr/hal-00317843
Submitted on 15 Sep 2005
HAL is a multi-disciplinary open access
archive for the deposit and dissemination of
sci-entific research documents, whether they are
pub-lished or not. The documents may come from
teaching and research institutions in France or
abroad, or from public or private research centers.
L’archive ouverte pluridisciplinaire HAL, est
destinée au dépôt et à la diffusion de documents
scientifiques de niveau recherche, publiés ou non,
émanant des établissements d’enseignement et de
recherche français ou étrangers, des laboratoires
publics ou privés.
Iceland-Scotland Ridge
C. Carollo, I. Astin, J. Graff
To cite this version:
C. Carollo, I. Astin, J. Graff. Vertical structure of currents in the vicinity of the Iceland-Scotland
Ridge. Annales Geophysicae, European Geosciences Union, 2005, 23 (6), pp.1963-1975. �hal-00317843�
SRef-ID: 1432-0576/ag/2005-23-1963 © European Geosciences Union 2005
Annales
Geophysicae
Vertical structure of currents in the vicinity of the Iceland-Scotland
Ridge
C. Carollo1, I. Astin2, and J. Graff3
1The University of Chicago, Dept of the Geophysical Sciences, Chicago, IL 60637, USA 2The University of Bath, Dept of Electronic and Electrical Engineering, Bath, BA2 7AY, UK 3British Maritime Technology Ltd., Teddington, Middlesex, TW14 8LZ, UK
Received: 20 May 2004 – Revised: 16 March 2005 – Accepted: 23 May 2005 – Published: 15 September 2005
Abstract. An analysis of current profiles carried out on
moored Acoustic Doppler Current Profiler data sets recorded during the Variability of Exchanges In the Northern Seas project is presented here for several locations in three sec-tions in the vicinity of the Iceland-Scotland Ridge: (1) north of the Faroes, (2) in the Faroe-Bank Channel and (3) in the Faroe-Shetland Channel. Total currents have been decom-posed into three components, namely the mean residual flow, tide and surge. The mean residual flow is found to be dom-inant. Results for the major tidal constituents (M2, S2, N2, O1and K1) are shown and discussed. It is found that the pre-dominant tidal harmonic M2becomes steered through depth to align with the bottom topography. The mean residual flow is found to be generally larger than the surge, particularly in the Faroe-Bank Channel below 500 m depth where it is the dominant component. Here tidal rectification, i.e. the to-pographic rectification of tidal currents originating in non-linearities that rectify the oscillatory tidal motion, is identi-fied as the process enhancing the large mean residual cur-rents found. From the current structure, two water masses are identified in the channel: the upper slowing moving in-flow water and the colder outin-flow water characterised by a 3–6-day periodicity. In the Faroe-Shetland Channel the flow is characterised by large tidal currents, particularly in shallow waters. Instead, north of the Faroes none of the component was identified as dominant. The results show that the vari-ability of the current components is strongly dependent upon topography and water depth.
Keywords. Oceanography: Physical (Currents; General
circulation; General or miscellaneous)
1 Introduction
The aim of this study is to understand the vertical and spa-tial variability of tidal and residual currents in three sections Correspondence to: C. Carollo
(ccarollo@geosci.uchicago.edu)
located north of the Faroe Islands, in the Faroe-Bank Chan-nel (FBC) and in the Faroe-Shetland ChanChan-nel (FSC) (Fig. 1) and to relate this to the water movement for the region.
Such an approach for the analysis of current structure through the water column is common in ocean litera-ture (Halpern, 1976; Saunders, 1976; Halpern et al., 1977, 1978; Halpern, 1979; Brink et al., 1980; Godfrey et al., 1980; Halpern, 1980; Jones and Halpern, 1981; Pingree and Mardell, 1981; Heathershaw, 1985; Halpern, 1987a,b). The procedure generally followed is to identify (1) factors influ-encing current speed, (2) the effect of the wind stress on sur-face layers (Halpern, 1976; Jones and Halpern, 1981), (3) the vertical stratification of temperature and salinity (Halpern, 1980), and (4) the influence of the sloping topography on tidal and residual currents, particularly in areas like the shelf-break (Pingree and Mardell, 1981). This list is by no means exhaustive but is included to illustrate the importance of con-sidering the vertical current profiles.
The object of the study here is to identify the current com-ponents that may dominate extremes in ocean currents and to better understand their make-up. It is proved to be necessary prior to the application of the statistical analysis of extreme events to allow for a physical interpretation of the results, as shown in the companion paper.
Evidence of topographic steering and rectification for tidal currents is investigated. Previous work by Allen (1995) stud-ies sub-tidal and tidal currents north of the Faroes in the re-gion of the Iceland-Faroe Front showing the spatial variation of tidal currents due to the bottom topography. The semi-diurnal tide is indicated be the largest in both u and v ve-locity components and can be affected by the meandering of the front. Sherwin and Jeans (1997) analyse tidal currents in the Wyville-Thomson Ridge at the southern end of the FSC section and show that three semi-diurnal components (M2, S2and N2) dominate tidal currents (in agreement with Sherwin (1991)). Similarly Simonsen (1999) describes the semi-diurnal character that dominates tidal currents around the Faroe Islands and indicates the presence of topographical trapped waves along the Scottish and Faroe shelves.
Fig. 1. VEINS deployments in sections N (north of the Faroes), F
(Faroe-Bank Channel), and S (Faroe-Shetland Channel) (modified from Hansen et al. (1999a)).
2 ADCP data
The Variability of Exchanges In the Northern Seas (VEINS) project was set up to evaluate the variability of the fluxes between the North Atlantic and the Arctic Ocean (Hansen et al., 1998; Hansen and Østerhus, 2000; Hansen et al., 2001). To achieve this, long-term upward looking Acoustic Doppler Current Profiler (ADCP) were deployed in several locations around the Faroe Islands (Hansen et al., 1999a,b).
The importance of this area lies in being the connection and the conduit for water mass exchange across the Iceland-Scotland Ridge.
ADCP data consist of u and v current velocity components averaged vertically over 10 m depth bins for shallow water deployments, and 25 m depth bins for deep water deploy-ments and over 20 min time interval (Hansen et al., 1999a).
In the sections considered in this study upward looking ADCP were deployed at 7 standard mooring sites and 3 spe-cial ones (FA, FC and ND) (Hansen et al., 1999a) (see Fig. 1). Measurements were taken from June 1996 to June 1999 from around 40/200 m down to 300/900 m depending on the sea-floor depth at each location. Details of the deployments are given in Table 1.
The recorded current data sets are not continuous in time due to missing data, especially for the near-surface bins that are most distant from the instrument. ADCP records have been quality controlled by the Faroese Fisheries Laboratory by comparing the performance of the instruments and the variation of data with time in relation to neighbouring bins. During the editing process missing data, outliers and data in-cluding large errors were flagged; bins with less than 50% valid data were rejected (Hansen et al., 1999a).
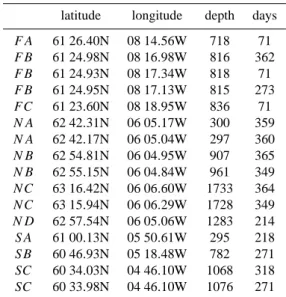
Table 1. Latitude and longitude (degrees), sea-floor depth (in meters) and number of days available for the ADCP time series recorded during the VEINS project.
latitude longitude depth days
F A 61 26.40N 08 14.56W 718 71 F B 61 24.98N 08 16.98W 816 362 F B 61 24.93N 08 17.34W 818 71 F B 61 24.95N 08 17.13W 815 273 F C 61 23.60N 08 18.95W 836 71 N A 62 42.31N 06 05.17W 300 359 N A 62 42.17N 06 05.04W 297 360 N B 62 54.81N 06 04.95W 907 365 N B 62 55.15N 06 04.84W 961 349 N C 63 16.42N 06 06.60W 1733 364 N C 63 15.94N 06 06.29W 1728 349 N D 62 57.54N 06 05.06W 1283 214 SA 61 00.13N 05 50.61W 295 218 SB 60 46.93N 05 18.48W 782 271 SC 60 34.03N 04 46.10W 1068 318 SC 60 33.98N 04 46.10W 1076 271
2.1 Section N: north of the Faroes
North of the Faroe Islands, where the Iceland Faroe Front (IFF) separates warm water masses of Atlantic origin from colder waters produced in the Arctic region, three quasi-permanent mooring sites (NC, NB, NA) plus a shorter de-ployment at a site ND (between NB and NC) (Hansen et al., 1999a), were located on a north-south section (Fig. 1), which traverses the flow (Hansen et al., 1999b). From north to south there is a steep decrease in the bottom depth (from 1700 m to 300 m), i.e. NA is located in shallow waters.
The deployments NA, NB, ND and NC traverse the Faroe Current as it flows eastward (Hansen et al., 1999b). This current is a jet with its core over the slope, where maximum velocity is recorded (Hansen et al., 1998).
This area is characterised by the presence of meanders and eddies of 30–50-km scale that move eastward with the front itself (Hansen and Østerhus, 2000).
2.2 Section F: the Faroe-Bank Channel
In the FBC one quasi-permanent mooring site (FB) plus two shorter deployments (FA and FC) were located on a southwest section across the channel (Fig. 1) (Hansen et al., 1999a). At these sites deep-water instruments were deployed (sea-floor depth around 800 m).
This channel, which separates the Faroe Plateau from the Faroe Bank, is about 20 km wide, has sill depth of about 840 m, and is the deepest passage of the Ridge. It is, there-fore, the main outlet of cold waters from the Nordic Seas that dominate the deepest 200/300 m of this channel (Hansen et al., 1998; Østerhus et al., 1999).
Different water masses are found in the channel as exten-sively described in Hansen and Østerhus (2000):
(1) Modified North Atlantic Water (MNAW) located from the surface to about 250 m, (2) intermediate water, from 250 m to 550 m, is a mixture of the two water masses from above and below, (3) bottom water made up of Norwegian Sea Arc-tic Intermediate Water (NSAIW) and Norwegian Sea Deep Water (NSDW) (Østerhus et al., 1999).
At the central site (FB) cold waters flow northwestward in a current with average velocities exceeding 1 m s−1in its core, centered about 120 m above the bottom (Østerhus et al., 1999). In the channel the flow is strongly steered by the bottom topography; the mean direction is, in fact, 135/315◦ (Saunders, 1990).
2.3 Section S: The Faroe-Shetland Channel
In the southwestern part of the FSC three mooring sites (SA, SB and SC) were located on a southeast section (Fig. 1). The deployment at site SA is a shallow water one; at sites SB and SC deep water instruments were used (Hansen et al., 1999a). There is a steep increase in the sea-floor depth from SA to SC along the section from 295 to 1076 m.
This channel separates the Faroe Plateau from the British Isles. Sea-floor depth is about 1500 m on the northern end, with a minimum of 1000 m, and is just over 600 m on its southern part where it is blocked by the Wyville-Thomson Ridge (Sherwin et al., 1999). Bathymetry dominates current dynamics in this channel, which is one of the most important passage of the region for the overflow.
The water column is characterised by the presence of: (1) two different surface water masses, North Atlantic Wa-ter (NAW) and Modified North Atlantic WaWa-ter (MNAW), (2) two intermediate water masses Arctic Intermediate Wa-ter (AIW) from 400 m to 600 m, and Norwegian Sea Arctic Intermediate Water (NSAIW) from 600 m to 800 m, (3) a bot-tom water mass known as Faroe-Shetland Channel Botbot-tom Water (FSCBW) that is a mix of Norwegian Sea Deep Wa-ter (NSDW) and NSAIW in different percentages (Sherwin et al., 1999). Details can be found in Hansen and Østerhus (2000).
The speed of the along-shore current on the Shetland side of the channel increases off-shore (from 10 cm s−1over 200 m depth to 20 cm s−1 over 500 m depth) (Hansen and Østerhus, 2000).
3 Methodology
3.1 Justification for the paradigm of the methodology It is usual to analyse u and v velocity components separately through a tidal analysis. The difference between raw data and tidal currents gives the non-tidal flow that subsequently is filtered to remove long-term trend. The normal proce-dure (Pugh, 1987) is to make a harmonic tidal analysis of these raw data usually specifying harmonics ≤1 cycle per day (cpd). Following this methodology, long period varia-tions influenced by meteorological effects are not considered and are resolved as a mean residual offset.
0 69 139 208 278 347 −100 −50 0 50 100 time (days) velocity (cm/s) 0 69 139 208 278 347 −100 −50 0 50 100 time (days) velocity (cm/s)
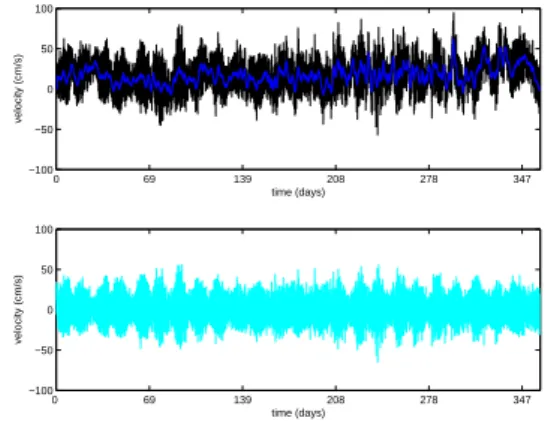
Fig. 2. Linearly interpolated raw data (black), low-passed data
(blue) and high frequency data (cyan) are shown for u component at location NA, 170 m depth.
However, to avoid mistakes in the interpretation of the re-sults a better approach is to pre-filter, i.e. use the filter before applying the harmonic analysis as proposed by Graff (1986). Serious anomalies can arise in applying conventional tidal harmonic analysis in cases where residual drift is in line with the dominant tidal current and is of similar amplitude. For example, in the case of a semi-diurnal dominant current with energy peaks at 2 cpd it becomes rectified into a pseudo di-urnal current (1 cpd) response that contributes to the resolu-tion of pseudo diurnal tidal harmonics that can give a seri-ously false representation of the tidal regime. In this way a “cleaner” time series can then be processed using a tidal har-monic analysis (Graff, 1986) to separate out tide and surge component.
This methodology was followed after the application of the standard methodology to the time-series collected in the FBC showed that the semi-diurnal harmonics reduced dras-tically at about 500 m depth thus suggesting a possible inter-action between the mean flow and the tidal components. It was found that diurnal harmonics increased in value. 3.2 Filtering
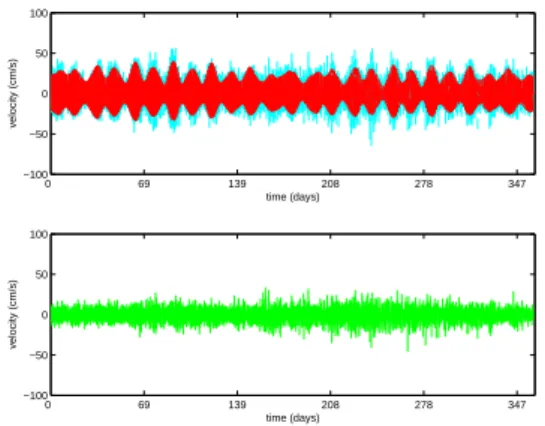
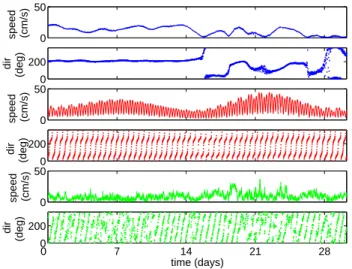
Raw data (divided into v and u component) were pre-filtered using a 39-h centrally averaging Doodson X0 filter with a cutoff of 1 cpd to separate out low frequency data (less than 1 cpd) and high frequency data (tidal and surge component) (Graff, 1986). Any gaps present in the data were interpolated. The high frequency data (Fig. 2) were then subjected to a tidal analysis to resolve the data further into tidal and non-tidal (surge) components (Fig. 3).
3.3 Tidal Analysis
Tides can be expressed as a Fourier sum of tidal harmonic constituents in the form
X(t ) = A0+ X
aNcos(ωNt − φN) , (1)
where A0is the mean flow/level and aN is the amplitude of
0 69 139 208 278 347 −100 −50 0 50 100 time (days) velocity (cm/s) 0 69 139 208 278 347 −100 −50 0 50 100 time (days) velocity (cm/s)
Fig. 3. High frequency data (cyan), tidal data (red) and surge data
(green) are shown for u component at location NA, 170 m depth.
is a phase lag relative to the Equilibrium Tide. Each tidal harmonic has a specific physical origin with dominant ones being of lunar (M2) and solar (S2) semi-diurnal form.
The aim of a tidal analysis is to resolve a sufficient number of tidal harmonics to describe the tidal regime at the place of observation (Pugh, 1987). N depends upon the length and quality of the observed data and complexity of tidal regime (Pugh, 1987).
The POL/PSMSL (Proudman Oceanographic Labora-tory/Permanent Service for Mean Sea Level) Tidal Analysis Software Kit 2000 (Bell et al., 2000) was used for this pur-pose.
Due to the different length of the time-series available 3 sets of tidal constituents were specified. The first set ap-propriate to monthly data sets was made up of 27 major constituents and 8 related constituents. The second set ap-propriate to data sets greater than 6 months was made up of 55 major constituents plus 2 related constituents. The third set, suitable for the analysis of one year or longer data sets, was made up of 58 major constituents including sea-sonal dependence for M2 (Bell et al., 2000). Following the above methodology the long period variations with fre-quency <1 cpd which are influenced by meteorological ef-fects were incorporated into the low frequency data and not considered in the tidal analysis.
From these analyses only the largest 5 tidal constituents were selected and studied: three semi-diurnal harmonics (M2, S2and N2) and two diurnal harmonics (O1and K1).
The matlab functions used to convert amplitude and phase into ellipse parameters and to plot the results were created by Xu (2000).
4 Results
4.1 Section N
4.1.1 Tidal Component
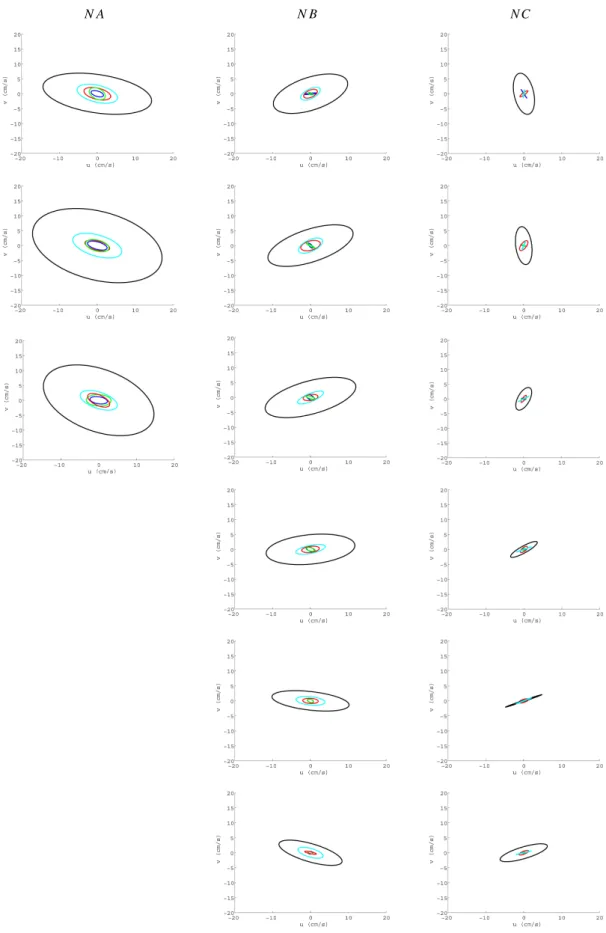
The harmonic constituent M2 (Fig. 4) was found to be the most important in the section north of the Faroes. The
value of the semi-major axis for this constituent generally decreases at corresponding levels from location NA to loca-tion NC (Fig. 4), i.e. with increasing bottom depth, due to the presence of an amphidrome north of NC. The largest values were found at around 200 m depth (18.834 cm s−1at 213 m location NA) where the Faroe Current has its core (Hansen et al., 1998), while minimum values were found at about 300 m depth at location NC (Fig. 4). The same spatial and vertical variations were found for the other two semi-diurnal tidal harmonics S2and N2(Fig. 4). They are smaller than M2 at all depths. The diurnal constituents are generally smaller than the semi-diurnal ones and they do not vary greatly with depth (Fig. 4).
4.1.2 Mean Residual Flow and Surge Component
The amplitude of the mean residual flow decreases with depth (Fig. 5). At location NA the direction of the mean residual flow (100/150◦) is very stable through time and
depth with periodicity of 3 to 6 days. Peaks of about 60/70 cm s−1 were found in surface waters while peaks of 40/50 cm s−1characterise bottom waters. At NB, instead, it is stable (100/150◦) only in the surfacemost measurements, but not all year round. In deep waters there is a strong direc-tionality toward 300◦in some months again with a periodic-ity of 3 to 6 days (Fig. 6). At location NC the directionalperiodic-ity (200◦) is less stable.
In near-surface waters the surge component is smaller than the mean residual flow. Instead at the bottom it is gener-ally larger or of the same amplitude (Fig. 5). This compo-nent shows a preferred direction of flow between 60/90◦– 240/270◦from 50 to 100 m at site NA. The surge does not show any preferred direction at locations NB and NC. Peaks of about 120/140 cm s−1were recorded in surface waters and of about 30/40 cm s−1near the bottom (Fig. 5).
4.2 Section F
4.2.1 Tidal component
M2was found to be the dominant tidal harmonic in the FBC deployments (Fig. 7). The value of the semi-major axis for this constituent generally decreases rapidly with depth and it is does not show great spatial variation at corresponding levels. Largest values were therefore found in the surface-most measurements. Different behaviour is shown by the other two semi-diurnal tidal constituents (Fig. 7). In fact, for these, the largest values were found around 350/400 m or even deeper, though in magnitude smaller than the ones ob-served for M2. This means that while the energy of M2 de-creases through depth it does not vary greatly for S2and N2. The inclination of the semi-major axis for the semi-diurnal constituents changes abruptly at around 500/600 m (Fig. 7) to align with topography providing evidence of topographic steering of tidal flows.
The diurnal constituents increase with depth from the sur-face to about 550/650 m and then decreases in deep waters
N A N B N C
Fig. 4. Variation of tidal constituents (M2black, S2cyan, N2red, O1blue and K1green) with depth (from top to bottom at about 220, 320, 420, 520, 620, and 720 m depth) and space in the section north of the Faroes.
0 20 40 60 80 0 100 200 300 400 500 600 700 800 speed (cm/s) depth (m) 0 20 40 60 80 0 100 200 300 400 500 600 700 800 depth (m) speed (cm/s) 0 20 40 60 80 0 100 200 300 400 500 600 700 800 speed (cm/s) depth (m)
Fig. 5. Vertical profiles of 3 months averaged daily maximum speed
for total currents (black), mean residual flow (blue), surge com-ponent (green) and tide (red) at locations NA, NB and NC from top to bottom. Continuous (–) line stands for average over June– September, dashed (- -) line stands for average over September-December, dotted (...) line stands for average over December– March and dash-dotted (-.-.) line stands for average over March– June.
where their amplitudes are comparable to the semi-diurnal ones or even larger (Fig. 7). The dominant constituents are always aligned with the topography, which suggests that there may be an energy leakage between the diurnal and semi-diurnal co-aligned components. This is not investi-gated.
4.2.2 Mean Residual Flow and Surge Component
In the FBC the presence of a strong residual current was found (Fig. 8), flowing almost continuously over the period analysed along the 315◦ direction (Fig. 9) steered by the bathymetry slope contours and is much stronger at depth,
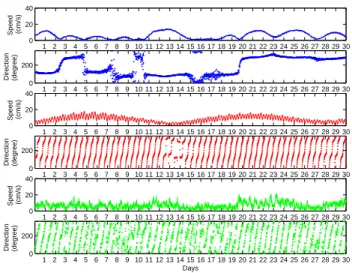
1 2 3 4 5 6 7 8 9 10 11 12 13 14 15 16 17 18 19 20 21 22 23 24 25 26 27 28 29 30 0 20 40 Speed (cm/s) 1 2 3 4 5 6 7 8 9 10 11 12 13 14 15 16 17 18 19 20 21 22 23 24 25 26 27 28 29 30 0 200 Direction (degree) 1 2 3 4 5 6 7 8 9 10 11 12 13 14 15 16 17 18 19 20 21 22 23 24 25 26 27 28 29 30 0 20 40 Speed (cm/s) 1 2 3 4 5 6 7 8 9 10 11 12 13 14 15 16 17 18 19 20 21 22 23 24 25 26 27 28 29 30 0 200 Direction (degree) 1 2 3 4 5 6 7 8 9 10 11 12 13 14 15 16 17 18 19 20 21 22 23 24 25 26 27 28 29 30 0 20 40 Speed (cm/s) 1 2 3 4 5 6 7 8 9 10 11 12 13 14 15 16 17 18 19 20 21 22 23 24 25 26 27 28 29 30 0 200 Direction (degree) Days
Fig. 6. From top to bottom speed (cm s−1) and direction (degrees) of mean-residual, tidal and surge components at location NB, 573 m depth (from 12 October 1997 to 10 November 1997).
though still evident near the surface suggesting a strong co-herence throughout the water column.
The amplitude of the mean residual flow changes with depth, with high speed at the bottom (Fig. 9) and low speed at the surface. Strong mean residual flow at the bottom is in the northwest direction. This flow increases from about 500 m where tide and surge components are very small. The near-bottom mean residual current has peak values in the range 100/150 cm s−1which is greater than the tidal and surge cur-rent together (Fig. 8). Besides, this curcur-rent component has speed peaks with a period of 3 or 6 days of constant direc-tion.
Superimposed on the low frequency mean residual flow there are the tide and surge, particularly the extremes of the surge component (high variation, but small speed). The peri-odicity of the surge component is just a few hours due to the interaction with the topography and storm events (Fig. 9).
The dominant direction of surges can be in phase or up to 90◦out of phase with the dominant direction of the mean
residual flow and tide (Fig. 9). Peaks of about 30/50 cm s−1 in surface waters and 40/60 cm s−1 in deep waters were found.
4.3 Section S
4.3.1 Tidal Component
In the FSC the largest values of tidal currents were found for the study area. The maximum value for the semi-major axis of M2 was found at site SA in near-surface measure-ments (Fig. 10). This harmonic constituent decreases at cor-responding levels from site SA to site SC along the section with increasing sea-floor depth (Fig. 10). At site SA the value of the semi-major axis for the dominant tidal harmonic M2 increases with depth from the surface to about 150 m and then is almost constant and decreases only in bottom waters
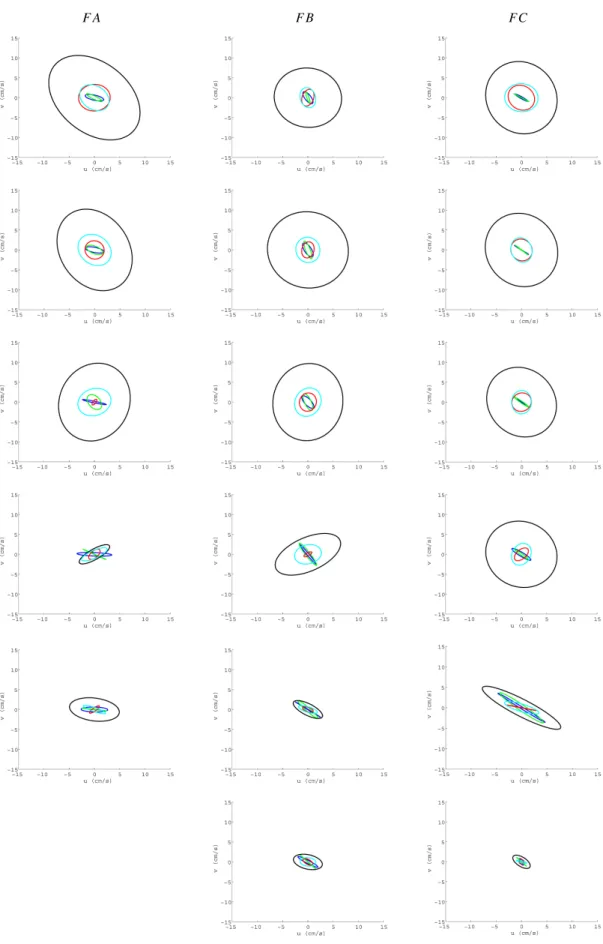
F A F B F C
Fig. 7. Variation of tidal constituents (M2black, S2cyan, N2red, O1blue and K1green) with depth (from top to bottom at about 220, 320, 420, 520, 620, and 720 m depth) and space in the FBC section.
0 20 40 60 80 100 120 140 0 100 200 300 400 500 600 700 800 depth (m) speed (cm/s) 0 20 40 60 80 100 120 140 0 100 200 300 400 500 600 700 800 speed (cm/s) depth (m) 0 20 40 60 80 100 120 140 0 100 200 300 400 500 600 700 800 speed (cm/s) depth (m)
Fig. 8. Vertical profiles of 3 months averaged daily maximum speed
for total currents (black), mean residual flow (blue), surge com-ponent (green) and tide (red) at locations FA, FB and FC from top to bottom. Continuous (–) line stands for average over June-September, dashed (- -) line stands for average over September– December, dotted (...) line stands for average over December– March and dash-dotted (-.-.) line stands for average over March– June, only for location FB (mid plot). Instead continuous line stands for monthly averaged daily maxima over July–August and dashed line stands for monthly averaged daily maxima over August-September for locations FA and FC (top and bottom plots) where only 71 days long time series are available.
(Fig. 10). At location SB and SC a continuous increase of the semi-major axis is found from surface to deep waters, where it gets stable (Fig. 10).
The other analysed components are smaller than M2 (Fig. 10). The harmonics N2, O1and K1show very small
0 50 100 speed (cm/s) 0 200 dir (deg) 0 50 100 speed (cm/s) 0 200 dir (deg) 0 50 100 speed (cm/s) 0 7 14 21 28 0 200 dir (deg) time (days)
Fig. 9. Speed (cm s−1) and direction (degrees) of the mean-residual (blue), tidal (red), and surge (green) components at location FB, 524 m depth (from 14 November 1997 to 14 December 1997).
variations with depth and their inclinations suggest along-channel flows (Fig. 10).
Tidal current ellipses exhibit relative uniformity in the ver-tical such that the tidal current near the bottom is comparable in amplitude to that found near the surface.
4.3.2 Mean residual flow and surge component
The mean residual flow decreases through depth while in-creasing along the section from SA to SC (Fig 11). It does not present a very stable or fixed directionality but in some months it shows a tendency of flowing along the 200◦
di-rection (Fig. 12). In these locations the mean residual flow shows changes in direction when great changes in speed occur (Fig. 12). Periodicity of 3 to 6 days and peaks of 40/50 cm s−1in surface waters (Fig. 12) and of 20/30 cm s−1 in near bottom measurements were found.
The surge component decreases slightly with depth but it is generally constant along the section at corresponding lev-els (Fig 11). It is smaller than the tide (the dominant com-ponent in this section) and mean residual flow (Fig 11). It shows a preferred direction of flow at SA (30/90◦–210/270◦) from 48 to 148 m, but not at SB (Fig. 12) or SC. Peaks of 80–130 cm s−1 in surface waters and 30-40 cm s−1 in deep waters were found.
5 Discussion
Some of the results showed above are similar to the ones ob-tained by the Faroese Fisheries Laboratory (Hansen et al., 1999a) that carried out tidal analyses in the same area, though different results particularly in surface measurements can be affected by the linear interpolation carried on in the present study before filtering.
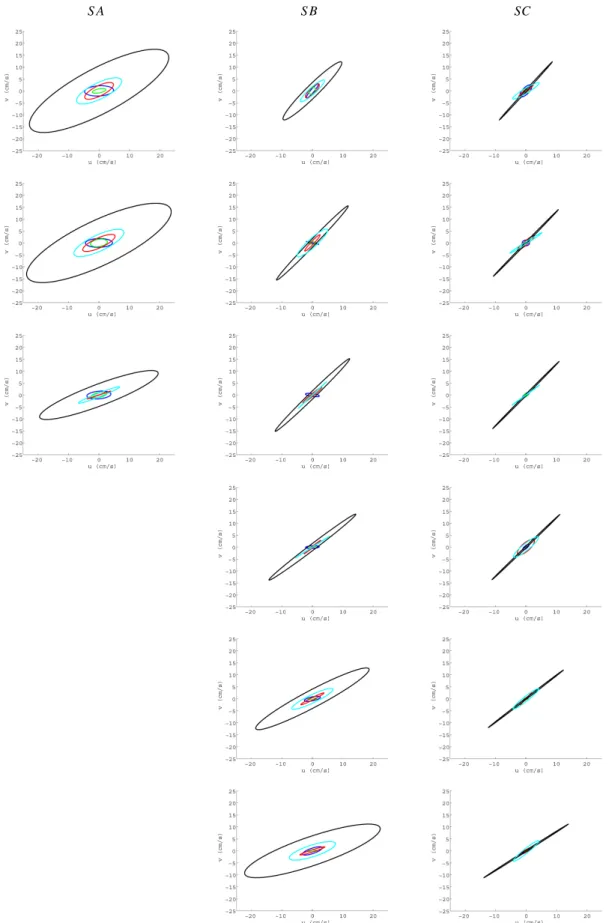
SA SB SC
Fig. 10. Variation of tidal constituents (M2black, S2cyan, N2red, O1blue and K1green) with depth (from top to bottom at about 220, 320, 420, 520, 620, and 720 m depth) and space in the FSC section.
0 10 20 30 40 50 60 70 80 90 0 100 200 300 400 500 600 700 800 speed (cm/s) depth (m) 0 10 20 30 40 50 60 70 80 90 0 100 200 300 400 500 600 700 800 speed (cm/s) depth (m) 0 10 20 30 40 50 60 70 80 90 0 100 200 300 400 500 600 700 800 speed (cm/s) depth (m)
Fig. 11. Vertical profiles of 3 months averaged daily maximum
speed for total currents (black), mean residual flow (blue), surge component (green) and tide (red) at locations SA, SB and SC from top to bottom. Continuous (–) line stands for average over June-September, dashed (- -) line stands for average over September– December, dotted (...) line stands for average over December– March and dash-dotted (-.-.) line stands for average over March– June.
The spatial and vertical variations of tidal currents were analysed in a previous study (Larsen et al., 2000). The au-thors investigate the behavior of M2in the FBC and its reg-ular variation with depth in sections N and S. A clockwise rotation of the major-axis of the tidal ellipse with depth is seen more consistent north of the Faroes (as shown in Fig. 4). They propose a two layer system for the semi-diurnal con-stituents with a more complicated pattern for the diurnal ones. They also find that tidal ellipses generally rotate clock-wise. This is confirmed by the results of the present study
0 50 speed (cm/s) 0 200 dir (deg) 0 50 0 200 0 50 speed (cm/s) 0 7 14 21 28 0 200 dir (deg) time (days) speed (cm/s) dir (deg)
Fig. 12. From top to bottom speed (cm s−1) and direction (degrees) of mean-residual, tidal and surge components at location SB, 588 m depth (from 14 October 1998 to 12 November 1998).
particularly for the semi-diurnal constituents in sections F and N.
The area north of the Faroe Islands is dominated by great changes in topography and bathymetry due to the Faroe Shelf and the warm and cold water masses that meet in this area. From south to north, the water depth is increasing and this feature strongly influences ocean currents. Also, the pres-ence of an amphidrome north of the section makes tidal cur-rents small at deployment NC.
Allen (1995) describes strong tidal currents dominating the velocity field in the IFF region. In the present study in-stead only at site NA is the tidal component larger than the surge and mean residual flow throughout the water column. At the other sites of section N the tide decreases with depth (Fig. 5). The surge is smaller than the mean-residual flow in near-surface waters, but in bottom waters it gets larger than the other two components. This discrepancy in results com-pared to the previous study is due to the fact that Allen (1995) made use of short time-series (only 29-day records) at only one depth (252 m).
Saunders (1990) found that in the FBC the tidal
com-ponent M2 is the dominant one and its amplitude is
about 10 cm s−1with larger speed in shallow waters (about 30 cm s−1). The results found here show that in this channel (1) the tide is smaller than the other two components at all depths (Fig.8) and (2) in deep measurements total currents are dominated by the mean-residual flow. The tide, surge and mean residual component are constant in the surface-most measurements. The tide gets smaller through depth; the mean residual flow increases rapidly, while the surge does not show large changes. The oscillatory phenomenon of the mean residual flow with period of 3 to 6 days (Fig. 9) looks like a sort of pumping mechanism or flow rectification due to the presence of the slope and particularly to the non-linear interaction of tides with bottom topography. This is
in agreement with literature studies (Loder, 1980; Robinson, 1981; Wright and Loder, 1985; Tang and Tee, 1987; Loder et al., 1997; White and Bowyer, 1997; Shi et al., 2002) inves-tigating the topographic rectification of tidal currents origi-nating in nonlinearities that rectify the oscillatory tidal mo-tion. This phenomenon occurs when two current components interact nonlinearly provided that both are in phase and thus correlate over a tidal cycle (Robinson, 1981; Clarke, 1991). As the continental shelf and slope form a large perturbation to the nearly constant-depth bottom topography, the deep-sea ocean tide can be severely distorted over this topography (Clarke, 1991). The major factors influencing tidal rectifica-tion over sloping topography are described to be topographic features, density structures and flow interaction; these can all contribute to give rise to the phenomenon also in the FBC. This is described in the literature to play an important role all year-round as it is found in the present study.
In the FSC tides are larger than the surge and mean-residual flow, and dominate the velocity field at site SA (Fig.11). This can be due to the effect of the Wyville-Thomson Ridge on the currents flowing parallel to the Scot-tish Shelf (Sherwin et al., 1999). At SB and SC the tidal component has magnitude larger than the surge from the sea-surface to the sea-floor; the mean-residual component de-creases with depth to become smaller than the other two com-ponents in bottom waters.
The semi-diurnal harmonics dominate throughout the wa-ter column. In general the clockwise component of these har-monics is larger than the anticlockwise component. Because of this structure the direction of the major axis of the tidal el-lipse turns clockwise with depth (Figs. 4, 7, and 10) (Prandle, 1982). In contrast, the clockwise component is smaller than the anticlockwise component of the diurnal constituents, par-ticularly in the FBC. As a result no rotation of the tidal ellipse with depth occurs.
The oscillatory period (3 to 6 days) that characterises the mean residual flow at almost all depths and deployments (Fig. 12) is similar to the results found by White and Bowyer (1997) for the shelf-edge current northwest of Ireland, where variability of 2–5 days is seen. The authors find that the in-crease in mean current speed is due to the slope angle, and near-bottom currents are influenced by topographic steering. The direction of the mean residual flow alternates between periods where it is constant for many days and 24-h peri-ods during which it moves through 360◦ at a constant rate (Fig. 6 and Fig. 12). This exactly matches the behavior of shelf waves as highlighted by Gordon and Huthnance (1987). Consequently, following Gordon and Huthnance (1987), we postulate that the long periods of constant current direction observed in Figs. 6 and 12 appear to be due to a quasi-steady response caused by long duration surface winds, whereas the single day current rotation anomaly is a response to storms lasting less than 12 hours (Gordon and Huthnance, 1987).
6 Conclusion
The results obtained in this work show that for the predomi-nant tidal constituent M2the major axis of the ellipse is gen-erally aligned with the topography and along-channel tidal currents are found.
The inclination of the semi-major axis of the most impor-tant constituents is strongly related to the bottom topogra-phy and the bathymetry of the analysed sections. In fact, the tidal ellipses for both diurnal and semi-diurnal tides and mean-residual flow are oriented approximately parallel to the local topography. Besides, in this region tidal currents give rise to strong residual currents due to nonlinear interactions with the bottom topography. In fact, where the distribution of tidal currents in deep waters differs significantly from the sea-surface one, the frictional effects and tidal rectification should be taken into consideration to explain the decrease of amplitude and change of inclination in bottom currents. As found in Lam et al. (2004) the effects above create an intensi-fication of the along-channel flow that is bottom-trapped due to stratification.
The changes identified at about 500 m depth in section F for the semi-diurnal tidal constituents and mean residual flow can be due to a difference in water masses found above and below this level (as described in Sec. 2.2), thus indicating a two-layer structure for the FBC.
Largest tidal currents were found in the shallower water deployment in the FSC. Elsewhere the mean residual flow was found to be generally larger than the surge and tides and therefore the major component in determining total currents, and particularly the extremes of total currents.
The results show that the largest mean residual flow was found near sea-bed in the FBC deployments. Its 3 to 6 days periodicity is probably due to the effect of tidal rectification on shoaling topography. In this section, the amplitude of the mean residual component is such that in deep waters it dom-inates the flow field and masks the tide and surge.
The analysis of the directionality of the flow shows that in the passages of the Iceland-Scotland Ridge the currents follow the general pattern described in the published re-sults. The main flow that comes from the North Atlantic Ocean trough the North Atlantic Current crosses the FBC going northwestward to flow through the Iceland-Faroe Gap and reach the region north of the Faroe Islands. Here the flow concentrates in the Faroe Current that splits into two branches: the first flows northward; the second, of interest here, crosses the FSC on the Faroe side. Part of this water goes through the Wyville-Thomson Ridge, in the southern part of the FSC, and the other part turns northwest to cross the FBC and return to the North Atlantic. In deep waters, the overflow comes from the Arctic Ocean, flows through the FSC enters the FBC and reaches the North Atlantic Ocean (Hansen and Østerhus, 2000) as North Atlantic Deep Water (NADW).
Acknowledgements. This study has been partly sponsored by the
University of Reading Research Endowment Trust Funds (RETF) and the Environmental Systems Science Centre (ESSC), University of Reading. A special thank to the Proudman Oceanographic Lab-oratory and particularly to P. Woodworth who provided the authors with TASK 2000 for the analysis of tides and to Z. Xu, who wrote the MATLAB software used in this study.
Topical Editor N. Pinardi thanks D. Prandle for his help in eval-uating this paper.
References
Allen, J. T.: Subtidal and tidal currents in the vicinity of the Iceland-Faroes Front, J. Atmos. Ocean. Tech., 12, 3, 567–588, 1995. Bell, C., Vassie, J. M., and Woodworth, P. L.: POL-PSMSL Tidal
Analysis Software Kit 2000 (TASK-2000), Proudman Oceano-graphic Laboratory, 2000.
Brink, K. H., Halpern, D., and Smith, R. L.: Circulation in the Pe-ruvian upwelling system near 15◦S, J. Geophys. Res., 87, C7, 4036–4048, 1980.
Clarke, A. J.: The dynamics of barotropic tides over the Continental Shelf and slope (Review), in: Tidal Hydrodynamics, edited by: Parker, B. B., John Wiley and Sons Inc., New York, 79–108, 1991.
Dye, S. R., Bigg, G., and Turrel, W. R.: A time series of flow through the Faroe-Shetland Channel, WOCE Conference Hali-fax, Canada 24–29 May 1998.
Godfrey, J. S., Cresswell, G. R., and Boland, F. M.: Observations of low Richardson numbers and undercurrents near a front in the East Australian Current, J. Phys. Ocean., 10, 301–307, 1980. Gordon, R. L. and Huthnance, J. M.: Storm-driven continental shelf
waves over the Scottish continental shelf, Cont. Shelf Res., 9, 1015–1048, 1987.
Graff, J.: The distribution of current meter measurements due to unusual hydraulic phenomena, International Conference on Measuring Techniques of Hydraulics Phenomena in Offshore, Coastal and Inland Waters, Paper A3, London, England 9–11 April 1986.
Halpern, D.: Structure of a coastal upwelling during July 1973, Deep-Sea Res., 23, 495–508, 1976.
Halpern, D.: Observations of upper ocean currents at Domes Sites A, B, and C in the Tropical Central North Pacific Ocean during 1975 and 1976, Marine Geology and Oceanography of the Pa-cific Manganese Nodule Province, 43–82, 1979.
Halpern, D.: A Pacific Equatorial temperature section from 172◦E to 100◦W during winter and spring 1979, Deep-Sea Res., 27A, 931–940, 1980.
Halpern, D.: Observations of annual El Ni ˜no thermal and flow vari-ation at 0◦, 110◦W and 0◦, 95◦W during 1980–1985. J. Geo-phys. Res., 92, C8, 8197–8212, 1987.
Halpern, D.: Comparison of upper Ocean VACM and VMCM ob-servations in the Equatorial Pacific, J. Atmos. Ocean Techn., 4, 1, 84–93, 1987.
Halpern, D., Smith, R. L., and Mittelstaedt, E.: Cross-shelf circu-lation on the Continental Shelf off the northwest Africa during upwelling, J. Geophys. Res., 83, C3, 1366–1372, 1977. Halpern, D., Smith, R. L., and Reed, R. K.: On the California
Un-dercurrent over the Continental Slope off Oregon. J. Marine Res., 35, 4, 787–796, 1978.
Hansen, B. and Østerhus, S.: North Atlantic-Nordic Seas ex-changes, Prog. Oceanog., 45, 109–208, 2000.
Hansen, B., Larsen, K. M. H., and Kristiansen, R.: ADCP deploy-ments in Faroese Waters 1997–1999, Technical Report No. 99-07, The Faroese Fisheries Laboratory, 1999.
Hansen, B., J ´onsson, S., Lundberg, P., et al.: Exchanges of wa-ter, heat and salt between the Arctic Mediterranean and the World Ocean through the Iceland-Scotland Gap measured in the Nordic WOCE Programme, Poster at the World Ocean Circu-lation Experiment (WOCE) conference, Halifax, Canada, May 24–29 1998.
Hansen, B., Østerhus, S., Kristiansen, R., et al.: The Iceland-Faroe inflow of Atlantic Water to the Nordic Seas, CM1999/L:21, 1999.
Hansen, B., J ´onsson, S., Quadfasel, D., et al.: Monitoring the At-lantic inflow and the Iceland-Scotland overflow, ASOF Meeting, Washington, November 2001.
Heathershaw, A. D.: Some observations of internal wave current fluctuations at the shelf-edge and their implications for sediment transport, Cont. Shelf Res., 4, 4, 484–493, 1985.
Jones, B. H. and Halpern, D.: Biological and physical aspects of a coastal upwelling event observed during March-April 1974 off northwest Africa. Deep-Sea Res., 28A, 71–81, 1981.
Lam, F-P. A., Maas, L. R. M., and Gerkema, T.: Spatial structure of tidal and residual currents as observed over the shelf break in the Bay of Biscay, Deep-Sea Res. Pt I, in press, 2004.
Larsen, K. M. H., Hansen, B., Kristiansen, R., et al.: Internal tides in the waters surrounding the Faroe Plateau, ICES 2000 Annual Conference, CM2000/L:09, 2000
Loder, J. W.: Topographic rectification of tidal currents on the sides of Georges Bank, J. Phys. Ocean., 10, 1399–1416, 1980. Loder, J. W., Shen, Y., and Ridderinkhof, H.: Characterisation
of three-dimensional lagrangian circulation associated with tidal rectification over a submarine bank, J. Phys. Ocean., 27, 1729– 1742, 1997.
Østerhus, S., Hansen, B., Kristiansen, R., et al: The deep over-flow through the Faroe Bank Channel, ICES 1999 Annual Sci-ence ConferSci-ence, CM1999/L:19, 1999.
Pingree, R. D. and Mardell, G. T.: Slope turbulence, internal waves, and phytoplankton growth at the Celtic Sea Shelf-break. Philo-sophical Transcriptions of the Royal Society London, A382, 663–682, 1981.
Prandle, D.: The vertical structure of tidal currents and other oscil-latory flows. Cont. Shelf. Res, 2, 191–207, 1982
Pugh, D. T.: Tides, surges and mean sea level, A handbook for engineers and scientists, John Wiley & Sons, 1987.
Robinson, I. S.: Tidal vorticity and residual circulation, Deep-Sea Res. Pt I, 28, 3, 195–212, 1981.
Saunders, P. M: Near-Surface current measurements. Deep-Sea Res., 23, 249–257, 1976.
Saunders, P. M.: Cold outflow from the Faroe-Bank Channel, J. Phys. Ocean., 20, 1, 29–43, 1990.
Sherwin, T. J.: Evidence of a deep internal tide in the Faroe-Shetland Channel, in: Tidal Hydrodynamics, edited by: Parker, B. B., John Wiley & Sons Inc., New York, 469–488, 1991. Sherwin, T. J. and Jeans, D. R. G.: Offshore technology
re-port: An investigation of mesoscale and internal wave activ-ity in the Faroe-Shetland Channel, Health and Safety Executive, OTO97056, 1997.
Sherwin, T. J., Turrell, W. R., Jeans, D. R. G., et al.: Eddies and a mesoscale deflection of the slope current in the Faroe-Shetland Chennel, Deep-Sea Res Pt I, 46, 415–438, 1999.
Shi, M., Chen, C., Xu, Q., et al.: The role of Qiongzhou Strait in the seasonal variation of the south China Sea circulation. J. Phys.
Ocean., 32, 103–121, 2002.
Simonsen, K.: Tides and tidal simulation in the area around the Faroe Islands, Nansen Environmental and Remote Sensing Cen-ter, Technical Report No. 166, 1999.
Tang, Y. and Tee, K. T: Effect of mean and tidal current interaction on the tidally induced residual current, J. Phys. Ocean., 17, 215– 230, 1987.
White, M. and Bowyer, P.: The shelf-edge current north-west of Ireland, Ann. Geophys., 15, 1076–1083, 1997,
Sref-ID1432-0576/ag/1997-15-1076.
Wright, D. G. and Loder, J. W.: A depth-dependent study of topo-graphic rectification of tidal currents, Geophys. Astro. Fluid, 31, 169–220, 1985.
Xu, Z.: Ellipse parameters conversion and velocity profiles for tidal currents in Matlab, documentation and programs available at http://sea-mat.whoi.edu/, 2000.