A DROP-IN CONCEPT FOR DEEP BOREHOLE CANISTER EMPLACEMENT By
Ethan Allen Bates
SUBMITTED TO THE DEPARTMENT OF NUCLEAR SCIENCE AND ENGINEERING IN PARTIAL FULFILLMENT OF THE REQUIREMENTS FOR THE DEGREES OF
BACHELOR OF SCIENCE IN NUCLEAR SCIENCE AND ENGINEERING AT THE
MASSACHUSETTS INSTITUTE OF TECHNOLOGY and
MASTER OF SCIENCE IN NUCLEAR SCIENCE AND ENGINEERING ARCHNES
A T THE MAASSACHUSETTS INSTITUTE
MASSACHUSETTS INSTITUTE OF TECHNOLOGY FT1KCHNOLOGY
JUNE 2011
JUL 2
212
Copyright C 2011 Massachusetts Institute of Technology (MIT) L
7 RA R I ES
All rights reserved
Signature of Author:
Department of Nuclear Science I '
and Engineering May 8, 2011
Certified by:
Prof. opo uongi o - Thesis Co-Supervisor Associate Profe sor of Nucl rSience and Engineering
Certified by:
Prof. Michael (lriscoll - Thesis Co-Supervisor Professor Emeritus of 'uclear Science and Engineering
Accepted by:
Mujid S. Kazimi
TEPt'rofessor of Nuclear Engineering Chairman, Department Committee on Graduate Students
A DROP-IN CONCEPT FOR DEEP BOREHOLE CANISTER EMPLACEMENT By Ethan Allen Bates
Submitted to the Department of Nuclear Science and Engineering on May 8, 2011 in partial fulfillment of the requirements for the degrees of Bachelor of Science in Nuclear Science and
Engineering and Master of Science in Nuclear Science and Engineering
Abstract
Disposal of high-level nuclear waste in deep boreholes drilled into crystalline bedrock (i.e., "granite") is an interesting repository alternative of long standing. Work at MIT over the past two decades, and more recently in collaboration with the Sandia National Laboratory, has examined a broad spectrum of design aspects associated with this approach. For emplacement, past reports suggest using steel cables to lower each canister into the borehole. This process would require many years to complete and precise control to safely lower the canisters thousands of meters. The current study evaluated a simple, rapid, "passive" procedure for emplacement of canisters in a deep borehole: free-fall release into a water-flooded borehole. The project involves both analytic modeling and 115th scale experiments on a laboratory mockup. Experiments
showed good agreement and validated the model. Depending on the inputs used for the mass and dimensions of the full scale canister and the viscosity of water, the model predicted terminal velocities of 2.4-2.6 m/s (4.5-5.8 mph). Further experiments showed that this could be reduced
by 50% by making the surface hydraulically rough. Based on these predictions and a structural
analysis, there seems to be little risk of damage when a canister reaches the bottom of the
borehole or impacts the stack of previously loaded canisters. For reference, dropping the canister in air from a height of only 0.3 m (1 ft) would result in an impact velocity of 2.44 m/s. Cost estimates for the conventional drill string based method were developed, and the drop-in method was concluded to reduce emplacement costs and time by a minimum of 70%, down to $700,000 per borehole. It is concluded that a simple drop-in procedure deserves serious consideration for adoption as a standard procedure for borehole loading.
Thesis Co-supervisor: Prof. Michael J. Driscoll
Title: Professor Emeritus of Nuclear Science and Engineering Thesis Co-supervisor: Prof. Jacopo Buongiorno
Acknowledgments
Professor Driscoll and Professor Buongiorno were ever-present, and their vast knowledge, continuous support and experience kept me motivated to tackle a wide variety of issues on the intriguing and crucial research area of waste disposal. Without a fellowship and financial support from the Nuclear Science and Engineering department, this research would not have been possible, and for that I am extremely grateful. Dr. Thomas McKrell assisted me with my initial familiarization with experimental procedures and safety, and was always a source of positivity and support. Professor Barbara Hughey was instrumental in providing experimental design advice and sensor hardware. Schlumberger Doll Research Center and Albert Perez have my appreciation for furnishing free use of their confocal microscope to the Department of Nuclear Science and Engineering. I'd also like to thank the support that Sandia has given to
deep borehole research at MIT, as it enabled me to travel to conferences to share my research. Daniela Cako, and my twin brother Richard Bates provided indispensible and dedicated moral and technical support during the many hours of derivation, experimentation and explanation of this thesis. Finally, I want to thank my family for raising me in such a supportive and
intellectually stimulating environment, allowing me to attend and truly enjoy my experience at MIT.
Table of Contents
Abstract... .. ---...---.---... 2 Acknowledgments...--- . -...-... 3 Table of Contents... 4 List of Figures...--..-... 6 List of Tables...10 1. Introduction...- ... ... 121.1. Objective of the Thesis ... 12
1.2. Topic M otivation... 12
1.2.1. Open Fuel Cycle and DOE Contractual Obligation ... 12
1.3. Overview of Deep Borehole W aste Disposal (DBW D) ... 13
1.4. Arrangement of the Thesis... 15
2. Emplacement Issues... 17
2.1. Chapter ... 17
2.2. Previously Suggested Emplacement in Shallow M ined Repositories ... 17
2.2.1. Yucca M ountain... 17
2.2.2. Discussion and Comparison to Deep Boreholes ... 20
2.3. Previously Suggested Emplacement Methods for DBW D ... 20
2.3.1. SKB Emplacement in Very Deep Holes (VDH) ... 20
2.3.2. M IT Emplacement M ethod Issue- Structural... 26
2.3.3. M IT Emplacement M ethod Issue- Speed... 29
2.4. Chapter Summary ... 33
3. Proposed Emplacement M ethod... 34
3.1. Chapter Introduction... 34
3.2. Drop-in M ethod Description... 34
3.3. Reference Canister Design ... 34
3.4. Suggested Handling Procedure... 36
3.5. Chapter Summary ... 39
4. Analytical Modeling of Proposed Emplacement Method ... 40
4.1. Chapter Introduction ... 40
4.2. Assumptions and Equations... 40
4.2.1. Closed Boundary Condition... 41
4.2.2. Open Boundary Condition...42
4.3. Discussion of Solutions ... ... 44 4.4. Dimensional Analysis ... ... 44 4.5. Chapter Summary l n.. ... 46 5. Experiments ... ... 47 5.1. Chapter Introduction ... 47 5.2. Design Considerations... ... 47 5.2. 1. Controlled Variables...47 5.2.2. Canister Size...47
5.2.3. M aterials and Fluids... ... 50
5.2.4. Instrumentation and Procedure... 51
5 .3 . R esu lts...54
5.3.2. Effect of the Archimedes Number (Ar) on Reynolds Number (Re)... 55
5.3.3. Analytical M odel Verification ... 57
5.4. Additional Investigations ... 59
5.4.1. Effect of Drag Inducing Features ... 59
5.4.2. Effect of Surface Roughness ... 61
5.5. Chapter Sum m ary ... 64
6. Feasibility of Proposed Em placem ent M ethod ... 65
6.1. Chapter Introduction ... 65
6.2. Therm al Issues ... 65
6.3. Structural Issues ... 69
6.4. Drag Inducing Features at Full Scale... 73
6.5. Backfill Process ... 75
6.6. Econom ics... 76
6.7. Retrievability... 78
6.8. Chapter Sum m ary ... 80
7. Sum m ary, Conclusions and Recom m endations ... 81
7.1. Sum m ary... 81
7.2. Conclusions... 81
7.3. Recom m ended Future W ork ... 82
7.3.1. Discounted Economic Analysis of Borehole Construction and Emplacement 82 7.3.2. Comparison of Radiation and Handling Risks with Other Repository Designs... 83
References... 85
Appendix A. Derivation of Canister Velocity Solutions ... 89
A .1 Introduction... 89
A .2 Force and M om entum Balance ... 89
A .3 Closed Boundary Condition... 91
A .4 Open Boundary Condition ... 94
A .5 Dim ensionless Solution for the Closed Boundary Condition ... 106
A.6 Numerical Integration of Acceleration (Closed Boundary Condition)... 108
Appendix B. Experim ental Results... 110
B.1 Introduction ... 110
B.2 Canister Density and Fluid Temperature Variation (Ar)... 110
B.3 Results of Added Form Loss and Surface Roughness ... 114
B.4 M easurem ent of Surface Roughness ... 115
B.5 Error Analysis ... 116
Appendix C. Thermal Analysis of Canister During Emplacement ... 121
C.1. Introduction... 121
C.2. Surface Temperatures ... 121
List of Figures
Figure 1-1. Cross section of the deep borehole concept [12][13]... 14
Figure 2-1. Breakdown of costs for the Yucca Mountain repository (with originally defined capacity of 70,000 metric tons) in Billions of year 2000 dollars [12]... 17
Figure 2-2. Emplacement equipment and transfer dock to emplacement gantry [20]... 18
Figure 2-3. Proposed design for the Yucca mountain waste package emplacement gantry[20]. 19 Figure 2-4. MIT depth dependent (MITDD) drilling cost index, adjusted for inflation to year 2003 US $, using the GDP deflator index (1977=100) [24]... 22
Figure 2-5. MIT drilling cost index vs. crude oil and natural gas prices[24]-[28]. Prices and the drilling index are both adjusted for inflation using the GDP deflator index (1977=100). ... 23
Figure 2-6. Fitted and extrapolated MITDD drilling cost index based on Eq. (2-1) for a borehole depth of 4572-5333 m, plotted against the historical MITDD index data given in [24]. ... 24
Figure 2-7. Schematic of canister emplacement tools described by SKB's engineering feasibility study[29]. The lower drawing depicts two canisters with longitudinal fins attached to each other. ... 2 6 Figure 2-8. Cross sectional diagram of a standard drill string threaded connection and finite element analysis (FEA) model of stress distribution [31]. ... 27
Figure 2-9. Depiction of mean contact stresses experienced by individual pipe threads. Obtained by analytical and finite element analysis in ANSYS models of an American Petroleum Institute (API) 88.9 mm round threaded drillstring connection [34]. ... 28
Figure 2-10. Overview of total emplacement costs ($M) calculated using various assumptions on the lowering speed and number of canisters connected... 32
Figure 3-1. Cross sectional view of the proposed emplacement method, based on Hoag's design for the pipe lining and canister dimensions [12] Not to scale. Note that the gap between the canister and the lining is an annulus with a thickness of 2.35 cm. ... 35
Figure 3-2. An illustration of the Yucca Mountain waste package closure system, robotically w elding a w aste package lid in place [41] ... 37
Figure 3-3. Diagram of the lifting step of a proposed emplacement method. ... 38
Figure 3-4. Diagram of intermediate step of a proposed emplacement method... 38
Figure 4-1. Depiction of gravitational, shear and pressure based forces that act on the canister as
it falls at term inal velocity. ... 40
Figure 4-2. Diagram of all variables required to calculate the terminal velocity of the canister
falling in a pipe of fluid. Variables are defined in Table 4-1... 45
Figure 5-1. Materials and relevant dimensions of the initially designed experimental setup... 49 Figure 5-2. Results of numerical integration of force balance equations for a 14.79 kg canister
with diameter of 0.067 m, length of 0.983 m and lining diameter of 0.07632 m dropped in water.
... 4 9 Figure 5-3. Log-log plot demonstrating of the effect of fluid choice on Archimedes and
Reynolds numbers (and thus terminal velocity) for the reference, experimental scale canister... 50 Figure 5-4. Photos of the Vernier rotary motion sensor used in the experiments... 52
Figure 5-5. Conceptual design of the experimental setup... 53
Figure 5-6. Photo of the attached pulleys, rotary motion sensor and insulated acrylic pipe. ... 53
Figure 5-7. Experimental results from the first set of experiments on May 14, 2010 using a 14.79 kg canister. Note that run #1 was recorded at 80 hz, run #2 was recorded at 20 hz, and run #3 w as recorded at 100 hz... 55 Figure 5-8. Summary of all 62 borehole drop experiments completed to investigate the
relationship between the Reynolds number and Archimedes number for the fluid flow. ... 56
Figure 5-9. Plot of the experimental drop data demonstrating the underlying relationship of ln(Ar) vs. ln(Re). Data obtained through a total of 62 drop tests with variation of water
temperature between 22.50 and 920 C, and canister density between 2363 and 4264 kg/m3. ... 5 8 Figure 5-10. Drag inducing feature (plug) of the simulated borehole canister, showing the
diameter and the axial distance from the canister... 59
Figure 5-11. Plot of the experimental drop data demonstrating the underlying relationship of ln(Ar)vs ln (Re), with the effect of an added form loss. Drag inducing data obtained through 6 drop tests with variation of water temperature between 72.5.5* and 770 C, with a canister density 4 3 3 5 k g/m 3. ... 6 0 Figure 5-12. Average particle size and relative roughness (ks/Dh) as a function of sandpaper grit
(ANSI 74 standards), for the experimental scale canister. Particle sizes compiled from [47],[48]
Figure 5-14. Experimental result, averaged from 6 drop tests of a 15.025 kg canister with 60 grit
sandpaper and drag inducing plug attached. Note that the sandpaper increased the diameter of the canister slightly to 6.80 cm . ... 63 Figure 5-15. Experimental result, averaged from 7 drop tests of a 14.963 kg canister with 60 grit
sandpaper attached. Note that the sandpaper increased the diameter of the canister slightly to
6 .8 0 cm ... 6 4
Figure 6-1. Schematic of the geometry and materials for the proposed emplacement radiation
shield (cask), containing the canister and fuel assembly. Not to scale... 66 Figure 6-2. The linear decay heat, maximum fuel centerline temperature, cask surface
temperature and (homogenized) assembly surface temperature as a function of time in years. .. 67
Figure 6-3. Temperature profiles within the assembly, canister and cask for a range of fuel ages
betw een 10 and 40 years... 68
Figure 6-4. Additional designed safety features of a DOE SNF canister [51]... 70 Figure 6-5. Deformed end of a DOE SNF canister after a drop test from 9 meters at an angle of
4 5 d egrees [52 ]... 7 1
Figure 6-6. Predicted full scale terminal velocity vs. relative roughness for various commonly
u sed m etals [4 3]... 73
Figure 6-7. Predicted full scale terminal velocity vs. relative roughness and form loss coefficient (k )... 7 4 Figure 6-8. Depiction of pipes used to grout casings into a borehole [23]... 76 Figure 6-9. Overview of total emplacement costs ($M) calculated using various assumptions on
the lowering speed and number of canisters connected, compared to the drop- method. ... 77
Figure 6-10. Dose rate at one meter from a Westinghouse PWR assembly with 50 GW-d/MTU
burnup, as a function of time discharged from a reactor [58]... 80 Figure 7-1. Estimated number of drops during the loading of a 100 MTHM deep borehole
respository, assuming a binomial distribution of failures and a failure rate of 1 x 10 -5... 84 Figure A-1. Definition of canister and water velocities and control volume, with a stationary
frame of reference. Vfl, Vp, are the average velocities of the fluid at reference point 1 and 2, resp ectiv ely . ... 9 0
Figure A-2. Velocities in the frame of reference where the constant, terminal velocity is
Figure B-1. Experimental results from 10 drop experiments, completed on September 20, 2010,
using a 8.188 kg, reference sized canister. Velocity recorded at 100 hz. ... 111
Figure B-2. Experimental results from 11 drop experiments, completed on October 7 2010,
using a 10.388 kg, reference sized canister... 111
Figure B-3. Experimental results from 9 drop experiments, completed on October 10 2010,
using a 12.588 kg, reference sized canister... 112
Figure B-4. Confocal microscopic contour plot of 60 grit sandpaper, with height exaggerated. ... 1 1 5 Figure B-5. Confocal microscopic contour plot of 80 grit sandpaper, with height exaggerated.
... 1 1 5 Figure B-6. Velocity data obtained from a drop test using 14.396 kg reference geometry
List of Tables
Table 2-1. General Requirements imposed on the Yucca Mountain emplacement gantry [22].. 19 Table 2-2. Borehole options investigated by SKB and time requirements of each stage [23]... 21 Table 2-3. Borehole options investigated by SKB and overall cost requirements of each stage in
1989 dollars, taken from Appendix 4 of [23]. ... 21 Table 2-4. Tabulated results of Figure 2-6... 24 Table 2-5. Borehole options investigated by SKB and overall cost requirements of each stage in present dollars, adjusted using an extrapolated MITDD drilling cost index. ... 25
Table 2-6. Summary of time and costs included in the SKB engineering study of VDH [29].... 25 Table 2-7. A PI Steel Specifications [35]... 28
Table 2-8. Summary of trip times calculated for varying assumptions of the possible lowering speed of a single canister to an average depth of 3 km... 29
Table 2-9. Estimated billing rates during the emplacement process, assuming an 8 hr work day.
... 3 0
Table 2-10. Summary of total loading times and costs for 400 canisters loaded per hole, with an average value billing rate of $4,852/hr and a 10 minute loading period (with radiation worker billing rate of $10,500/hr) for each canister... 30
Table 2-11. Summary of total loading times and costs for 400 canisters loaded per hole, with 20 canisters connected and lowered together. Assumes the average value billing rate of $4,852/hr and a 10 minute connection period (with radiation worker billing rate of $10,500/hr) for each can ister. ... 3 1 Table 3-1. Reference borehole canister components and masses [12]... 36
Table 4-1. Definition of all relevant variables and their respective dimensions, where M stands for Mass, L stands for Length, and T stands for Time. ... 45
Table 5-1. Summary of independent variables for the borehole emplacement experiment... 47 Table 5-2. Summary of standard pipes and measured dimensions, (+/- 0.021 cm)... 48 Table 5-3. Comparison of alternative fluids lower viscosity than the reference case, room
tem perature w ater... 5 1 Table 5-4. Comparison of parameters between the full scale and experimental scale canisters.. 54 Table 5-5. Dynamic similitude of experimental parameters, during tests that varied Ar. ... 54
Table 6-1. Comparison of canister geometry and material properties between a DBWD canister
and a D O E SN F canister [52]. ... 71
Table 6-2. Comparison of impact parameters between a DBWD canister and a DOE SNF can ister [5 2 ]. ... 72
Table 7-1. Summary of various estimates of failure probabilities during handling of spent fuel. ... 8 3 Table B-1. Canister components for the fully loaded 14.79 kg canister... 110
Table B-2. Summary of drop tests completed to investigate the effect of Ar on Re. ... 113
Table B-3. Canister components for the canister with added form loss (plug)... 114
Table B-4. Summary of experiments that varied form loss and surface roughness... 114
Table B-5. Summary of roughness parameters produced by the confocal microscope. ... 116
Table B-6. Rotational motion sensor deviations from origin after 15 drop tests. Analysis completed for drop tests completed on February 10, 2011... 117
Table B-7. Measured values for the canister diameter... 120
Table C-1. Assumed material and thermal parameters for analysis of the shielded canister temperature distributions[12] and from Table A.3 [64] ... 125
1. Introduction
1.1.Objective of the Thesis
This project develops and experimentally verifies an affordable, expedient and reliable method of deploying nuclear waste canisters into deep boreholes. An analytical model based on fluid mechanic first principles aided design of a dimensionally similar experiment, and the results validate the model. Various methods to further increase drag forces and reduce canister velocity were also investigated and successfully integrated into an analytical model. Estimates for the reduction in time and costs associated with the simplified process are made in relation to the overall feasibility of a vertical borehole repository.
1.2.Topic Motivation
1.2.1. Open Fuel Cycle and DOE Contractual Obligation
The unresolved issues of long term nuclear waste disposal in the United States remain a limiting factor in the expansion of nuclear power- a proven and carbon free energy source. Work on the Yucca mountain repository has been suspended, and a Blue Ribbon Commission appointed to recommend a new path forward. Secretary of Energy, Steven Chu, stated that Yucca Mountain would not be considered as one of the alternatives [1]. In the meantime, Finland, Sweden, and
Switzerland have successfully pursued repositories in granite, currently scheduled to open in 2020 in Finland and 2025 in Sweden [2].
Despite this change in policy, the truth remains that the U.S government is contractually responsible for removing spent fuel from reactor sites and disposing all commercial nuclear waste [3]. Without a solution by 2020, the government (taxpayers) will have to pay an estimated $12 billion dollars in damages to compensate the utilities for the cost of storing the waste, and further pay $500 million per year after 2020 [4]. Centralized storage has been suggested as an interim solution, but without amending the Nuclear Waste Policy Act (NWPA) of 1982, the DOE cannot legally construct a storage facility until authorization of the final geologic repository. Additionally, under current law the facility could only contain a maximum of 10,000 metric tons of spent fuel, a small fraction of the 60,000 metric tons that is already in spent fuel pools at reactor sites.
In the longer term, closed-fuel cycles could reduce the quantity of high level waste requiring disposal; however, recent MIT and Harvard studies[5]-[8] conclude that a closed fuel cycle will not be economically feasible over the next 50 years or more, and point out that long time scales are required to change the fuel cycle. An MIT study proposes, "the highest priority in fuel cycle analysis, research, development, and demonstration, deserving first call on available funds, lies with efforts that enable robust deployment of the once-through fuel cycle...We believe deep boreholes, as an alternative to mined repositories, should be aggressively pursued" [8].
Therefore, to deal with the volumes of waste generated from the once-through fuel cycle, the quick development of the alternative to mined repositories-deep boreholes- is crucial and justified.
1.3. Overview of Deep Borehole Waste Disposal (DBWD)
DBWD has been proposed as an attractive alternative to shallow mined repositories. The deep borehole disposal strategy involves drilling and lining a borehole a few kilometers (e.g. 4 km) down into a region of the Earth's crust which mainly consists of granite. The feasibility of drilling to such depths has improved over the years with the interest in enhanced geothermal systems (EGS), which can require boreholes to depths greater than 10 km [9][10]. The current estimates of costs for drilling a vertical 0.5 m diameter, 4 km deep hole are between 10-20 million dollars [11 ][12]. The metric of drilling cost has typically been considered the driver for borehole repository economics. However, detailed cost evaluations of the subsequent operations
such as emplacement are quite scarce and not well defined.
Canisters containing spent nuclear fuel are stacked in the lower 2 km of the hole, while the upper region is sealed off with a multilayer plug (bentonite clay,asphalt, and cement for example). A schematic of the DBWD concept is shown in Figure 1-1.
0 L D,=0.387 m Crystalline bedrock(granite) 2 Waste Canister Properties
3
D = 0.34 m C m= 2000-3500 kg 1= 5 mShell Material: Steel or
Well Design Concept Cast Iron
Depth (km) (not to scale)
Figure 1-1. Cross section of the deep borehole concept [12][13].
This disposal technique is promising for a number of reasons. Waste in boreholes is significantly deeper and further away from water sources compared to typical shallow mined repositories. This naturally results in better isolation of radionuclides from the surface and humans. Deep granite rock is typically a chemically reducing environment, which reduces radionuclide solubility and decreases their mobility. These geologic conditions with reduced water flow are the main component of the added safety of deep boreholes [14]. The average age of these basement rocks is on the order of billions of years [13]. The performance does not depend as heavily on engineered barriers, which have greater long term uncertainties associated with them. Preliminary performance assessments of DBWD have estimated the peak radioactive dose to a human to be many orders of magnitude less than the internationally recommended limits for post-closure dose [14]. Furthermore, since solid granite formations are relatively common at depths of 2-5 km in the United States, DBWD increases the number of potential sites for waste repositories. Increasing the possible number of sites that can volunteer or spreading the nation's
waste inventory over a number of disposal sites may help reduce political tensions associated with licensing repositories while reducing transportation costs and concerns.
Granite is also being seriously considered as a medium for geologic disposal by several other nations such as China, Japan, and the U.K. [2]. DBWD is a widely researched alternative to mined repositories and has had substantial attention from researchers at Sheffield University in
the UK, SKB in Sweden and MIT in collaboration with Sandia National Laboratory[
11],[15]-[17] The main areas for improvement to the deep borehole disposal concept are site selection
criteria, borehole fill materials, emplacement details and performance risk assessments. A discussion of the emplacement facility and systems is needed to demonstrate the viability of DBWD, but also represent an opportunity for DBWD to make significant savings over shallow mined repositories such as Yucca mountain[13].
1.4. Arrangement of the Thesis
Chapter 2: Emplacement Issues
This chapter deals with the loading issues associated with the Yucca Mountain repository and past proposals by SKB and MIT for emplacement methods in deep boreholes. The feasibility, time, risks and unresolved factors of each study are compared and discussed. The baseline emplacement scenario (that the proposed method is contrasted against) is investigated in this chapter.
Chapter 3: Proposed Emplacement Method
In this chapter, a simple drop-in method is proposed and a reference canister and scenario is defined. Finally, the equipment and facilities required for such an operation are illustrated.
Chapter 4: Analytical Modeling of Proposed Emplacement Method
This chapter details the assumptions and basis for predicting the canister velocity in a flooded borehole. It also outlines other down-hole conditions that could alter the canister's velocity. A
dimensional analysis is completed on the pertinent variables, and confirms the functional form of the analytically derived expression for terminal velocity.
Chapter 5: Experiment
This chapter begins with the approach to experimental design, in which a number of constraints were established and met. The experimental apparatus, sensors, materials, and procedure are defined. Discussions of design and results focus heavily on dimensionless variables and frequent comparison to analytical solutions, and consistency of the results is clearly shown, through regression of the data. Alternative methods of reducing the canister velocity are tested and confirmed within the framework of the analytically derived solution.
Chapter 6: Feasibility of Proposed Emplacement Method
The logistical issues of the drop-in method are discussed in this chapter. The primary concerns are thermal, structural, economic and regulatory. Thermal issues are addressed to ensure that the previously defined analytical model applies at the elevated temperatures that the canister surface
achieves prior to emplacement. The model and experimental data are used to make velocity predictions for the full scale canister, and the consequences of impact are analyzed.
Emplacement economics are discussed in comparison to the previously suggested methods using drilling rigs and strings. The issues of retrievability and its lack of clear definition within current
U.S policy are discussed in relation to its implications for DBWD and repository choice in
general.
Chapter 7: Summary, Conclusions, and Recommendations
In closing, the results from the analytical modeling, experimental work, and feasibility analysis are presented for the drop-in method. Future topics that will be crucial to an objective and comprehensive comparison of DBWD to other repository designs are suggested.
2. Emplacement Issues
2.1. Chapter Introduction
To give perspective and background on the complexity and challenges posed by emplacement of waste, a discussion of the well documented techniques for emplacement of nuclear waste is given based on the now suspended Yucca Mountain repository in the U.S. The Swedish (SKB) feasibility assessments and emplacement operation details for deep boreholes are reviewed and an analysis is completed to present the cost estimates in current dollars. Finally, the
emplacement methods suggested at MIT are discussed on the basis of structural, time and cost issues.
2.2.Previously Suggested Emplacement in Shallow Mined Repositories
2.2.1. Yucca Mountain
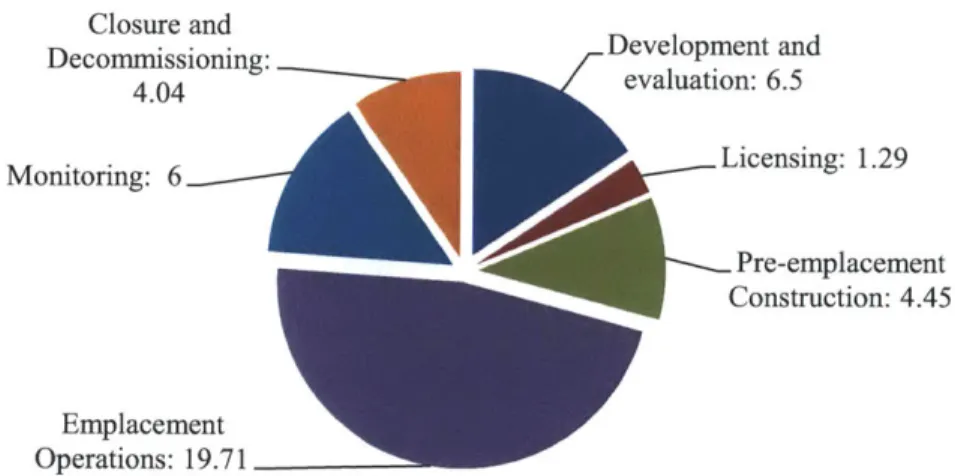
Emplacement, the act of deploying and fixing the canisters in their final destination is a complex and crucial process that must be outlined in detail to fully understand the feasibility of a disposal method. In the case of the Yucca Mountain shallow mined repository, emplacement procedures constituted the most expensive phase in the entire disposal process. Figure 2-1 shows a
breakdown of costs for the Yucca Mountain repository.
Costs for Yucca Mountain Repository ($B, year 2000)
Closure andDeeomnad Decommissioning: Development 6and 4.04 Monitoring: 6 Licensing: 1.29 Pre-emplacement Construction: 4.45 Emplacement Operations: 19.71
Emplacement in shallow mined repositories is complicated by a number of constraints: presence of human workers underground with ventilation, radiation and possibly drainage issues, low visibility in dusty environments, integrity of rails and evacuation routes, spatial, weight and mobility restrictions for emplacement machines with sufficient lifting capabilities [18] [19]. Transport of the waste package from the surface facility to the emplacement drift requires a human operated, electrically powered transport locomotive, shown in Figure 2-2.
TRANS
~ ~17i
[,C---Figure 2-2. Emplacement equipment and transfer dock to emplacement gantry [20]
The human operated transport locomotive travels at 1.78 m/s (4 mph) [21]. The total distance traveled by the waste package between the surface facilities and emplacement panel is 3.54 km, while the distance from the emplacement panel to drift is conservatively approximated to be
1.964 km [21]. Thus, the minimum locomotive time is approximately 3 hours, while the worker is exposed to a low radiation field (2.5 mrem/hr) for almost 2 hours per round trip.
An emplacement gantry, capable of lifting and lowering an unshielded waste package must be transported and installed into a drift before the final filling process can occur. After being installed, the emplacement gantry can receive the waste packages from the shielded transporter. Remote operation via camera and other sensors during the final emplacement process prevents further radiation doses but does not eliminate the risk of human error and accidental drop [22]. Overall, the maximum total individual dose to an emplacement crew
worker was conservatively estimated to be 1890 mrem/year [21]. Risk of derailing, delivery of power (battery), loss of vehicle control, contamination of equipment surfaces and loss of rail integrity (debris on the railways) were also design basis safety issues. Restrictions on the waste emplacement gantry designed for Yucca Mountain repository are listed in Table 2-1 and a conceptual design of the gantry is shown in Figure 2-3.
Table 2-1. General Requirements imposed on the Yucca Mountain emplacement gantry [22] Operational and Environmental Requirement Metric
Maximum weight of waste packages 73.02 metric tons (161,000 lbs)
Maximum traveling length along drift 808 meters (2651 ft)
Drift diameter 4.8768 meters (16 ft)
Maximum speed of equipment 0.76 rn/s (1.7 mph)
Maximum hoist speed of waste package* 0.0305 n/s (6 ft/min)
Maximum ambient temperature (with ventilation) 50 OC (122 OF)
Radiation field at package surface 600.7 rem/hr
Radiation field at bottom lid of package 1290 rem/hr
*Slow hoist speed designated for loads between 70 and 99 tons
BALSRWDRIVE CLUTCH ABTEFRY
BALL SCREW BOX
DRIVE BEARING\ 90' BEVEL-. GEAR BOX ELCTRONIC AOUIPMENT --- BALL SCREW JACKING POINT PAN/I IL I/ZOOM
CMRAL IH HIGH FAIL-SAFE MOTOR BRAKE
ELECTRICAL CAB1NET-DRVMTR
90* BEVEL GEAR BOX
COOL ING UNIT
TOW HOOK THIRD RAIL COLLECTORS
LIFT FRAME
The maximum speed of the remote controlled emplacement gantry is quite small (0.76 m/s) and the maximum distance traveled by the vehicle within the emplacement drift is -800 meters). Thus, the emplacement gantry movement adds at least another half hour to the loading process. It should be noted that at the time of repository closure (50 years after emplacement and
ventilated cooling), the entire loading process must be repeated for the titanium drip shields, which are individually linked together above the waste packages using a similar machine to the emplacement gantry.
2.2.2. Discussion and Comparison to Deep Boreholes
Overall, including inspections and maintenance it was estimated to take between four and eight hours to emplace or retrieve a single waste package (21 PWR assemblies) [21]. This is consistent with a maximum emplacement rate of 600 waste packages per year using two emplacement crews with four workers each. Therefore an estimate of the average loading time for Yucca mountain is one assembly every 10-20 minutes.
The single trip distance traveled in Yucca Mountain is slightly greater than the distance that the waste packages must travel in deep boreholes (3 km). However, 21 (PWR) assemblies are contained in a single waste package, whereas with DBWD, each assembly is loaded into an individual canister, which greatly increases the total number of packages to be emplaced.
Another large factor to consider is that emplacement within deep boreholes is a hoisting process, and therefore would be more accurately described by the 0.0305 m/s vertical speed designated for heavy loads. Emplacement at an average depth of 3 km at this rate would take 27 hours for a single trip down.
2.3. Previously Suggested Emplacement Methods for DBWD
2.3.1. SKB Emplacement in Very Deep Holes (VDH)
A 1989 SKB feasibility study of the VDH concept estimates the time and costs required to
emplace canisters in various borehole designs [23]. The process involves using the original drilling rig to force the canister through a viscous "deployment mud". As seen in Table 2-2, the minimum total drilling and deployment time occurs with a borehole drilled with a diameter of
Table 2-2. Borehole options investigated by SKB and time requirements of each stage [23].
Option Max. Emplacement Hole Time for Time for Time for Total depth zone length diameter at drilling of investigation deployment time (km) (km) emplacement hole of drilled (days) required
zone (mm) (days) hole (days) (days)
A 4 2 800 435 100 365 900
B 5.5 2.5 375 319 100 365 784
C 4 2 375 200 100 365 665
The SKB paper estimated the costs for these options, taking into account rig mobilization, construction materials, billing rates, engineering contingency funds and fuel costs. The results are summarized in Table 2-3.
Table 2-3. Borehole options investigated by SKB and overall cost requirements 1989 dollars, taken from Appendix 4 of [23].
of each stage in
Option Daily cost for Daily cost for Total cost for Total Cost for Total drilling and deployment drilling and deployment cost investigation period investigation period ($M)
period M($M)
A $77,769 $57,329 41.606 21.925 60.532
B $48,061 $32,563 20.137 11.885 32.023
C $48,061* $32,563* 14.418 11.885 26.304
*The calculations for Option C are not explicitly shown in the reference, but for this table it is assumed that the daily costs would be the same as for Option B, which is the same diameter.
Adjusting these estimates to present dollars is complex because of the opposing effects of inflation, drilling technology improvement, and fuel prices on the cost of drilling and lining boreholes. With the intent to improve the accuracy of predictions based on EGS well costs, MIT surveyed deep drilling projects (in oil and natural gas fields) and developed a drilling cost index; however the indices are only reported up to 2003 [24]. The index takes into account the key metric of depth, and the cost data is smoothed using a 3 year moving average. Figure 2-4 shows the historical trend of the MIT depth dependent (MITDD) drilling cost indices, adjusted for inflation.
200
180 Aaiusiea for infation
160
x 140
100
-80
60 Depth Intervals (Feet)
-+- 1250-2499 + 2500-3749 40 3750-4999 5000-7499 7500-9999 +10000-12499 20 12500-14999 - 15000-17499 17500-19999 1975 1980 1985 1990 1995 2000
Year
Figure 2-4. MIT depth dependent (MITDD) drilling cost index, adjusted for inflation to year 2003 US $, using the GDP deflator index (1977=100) [24].
The price of fossil fuels, which affects the demand and operating cost for rigs, has a strong correlation with the cost of drilling and emplacement operations, as shown in Figure 2-5.
-4-MIT Composite Drilling Index
160 .- 1)60 1-MITDD Drilling Cost Index (4572-5333 m)
35
-*-Natural Gas Well Head Price
140 -*- Crude Oil Price 30
120 25 100 20 4- 10 20 0 0 1977 1980 1983 1986 1989 1992 1995 1998 2001 2004 2007 2010 Year
Figure 2-5. MIT drilling cost index vs. crude oil and natural gas prices[24]-[28]. Prices and the
drilling index are both adjusted for inflation using the GDP deflator index (1977=100).
The MIT composite drilling cost shown in Figure 2-5 is a composite of all the depth dependent indices. However, the MITDD index for holes drilled to depths between 4572-5333 meters is the most relevant index for this deep borehole study. The current drilling cost index was estimated using a linear correlation between the inflation adjusted crude oil and natural gas prices with the inflation adjusted drilling index. The MITDD drilling cost index was shown to be well fitted by the first-order multiple regression shown in Equation (2-1),
MITDD(t) = NG(t) - 2.438 + OIL(t) -4.019 + 13.7429 (2-1)
where MITDD (t) is the inflation adjusted drilling cost index for a given year, NG(t) is the inflation adjusted (to 1977) price of natural gas at the wellhead in tens of thousands of $/ft3,
OIL(t) is the inflation adjusted (to 1977) price of crude oil in $/barrel. The accuracy of the
regression is graphed in Figure 2-6 and tabulated in Table 2-4.
- MITDD Drilling Cost Index (4572-5333 m)
- -Fitted, Extrapolated MITDD Drilling Cost Index
rA P* PC rA PC-P.m Ow 250 200 150 100 50 0 Year
Figure 2-6. Fitted and extrapolated MITDD drilling cost index based on Eq. (2-1) for a borehole
depth of 4572-5333 m, plotted against the historical MITDD index data given in [24].
Table 2-4. Tabulated results of Figure 2-6.
Year MITDD (4572-5333m) MITDD (4572-5333m), extrapolated using Eq. (2-1) 1989 81.61713 76.13355 1990 82.78544 84.1852 1991 74.1574 74.97812 1992 63.47384 72.03206 1993 50.08678 69.47312 1994 48.51939 64.00517 1995 53.83501 61.85471 1996 60.08529 73.46802 1997 68.24467 71.27343 1998 69.16327 56.57291 1999 72.41705 65.98714 2000 74.61545 97.21308 2001 90.7573 92.18686 2002 94.18135 81.08706 2003 94.38468 104.2887 2004 123.1865 2005 158.9213 2006 160.0463 2007 162.7703 2008 209.63 2009 123.8824 2010 149.4246 2011 182.2067 1977 1980 1983 1986 1989 1992 1995 1998 2001 -I 2004 2007 2010
The current (April 2011) price in 2011 $ of crude oil is $106/barrel, while the price of natural gas is $40.8/ ten thousand ft3, and those prices are expected to stay level or rise over the next year, due to increasing demand from developing countries and supply shocks resulting from unrest in Middle East and North African countries[25],[27],[28]. A comparison of the index
between the years of 1989 to 2011 show that the costs for drilling wells deeper than 1000 m have trended to be much higher. The ratio of the extrapolated MITDD index for 2011 to the MITDD index for 1989 is 2.23. Using the cost index multiplier, the results from Table 2-3 can be adjusted to present estimates for the drillings costs, shown in Table 2-5.
Table 2-5. Borehole options investigated by SKB and overall cost requirements of each stage in
present dollars, adjusted using an extrapolated MITDD drilling cost index.
Option Daily cost for Daily cost for Total cost for Total cost for Total drilling and deployment drilling and deployment cost
investigation period investigation period ($M)
period ($M) ($M)
A $173,424.87 $127,843.67 $92.78 $46.66 $139.45
B $107,176.03 $72,615.49 $44.91 $26.50 $71.41
C $107,176.03 $72,615.49 $32.15 $26.50 $58.66
A more recent SKB engineering study conducted in year 2000 [29] estimates a significantly
lower drilling time and cost for an Option C type borehole to 4 km (with a more than doubled diameter of 838.2 mm). This discrepancy might result from the fact that it does not include contingency funds or accurately take into account the fuel costs for operating the rig. The study assumed a billing rate of 20,500 E (year 2000)/day, which is approximately equal to $20,500/day (year 2000 $). Adjusting these prices using the MITDD values using Table 2-4 the billing rate becomes $50,063/day. Table 2-6 presents the cost conclusions of the engineering study [29].
Table 2-6. Summary of time and costs included in the SKB engineering study of VDH [29].
Period Time Required Costs
Drilling (including drill bits, 137 days 4.65 M E, year 2000
foam, casing costs) (11.355 M $, adjusted using MITDD)
Time for logging testing or Not included Not included
For deployment, the study details a similar technique as previously described by SKB. First the borehole is drained of the drilling foam (liquid used during the drilling phase to facilitate the removal of drilled rock and debris). Then the borehole is completely filled with deployment mud. The deployment mud was described to have as high density as possible so that it functions as a buffer. Using the original drilling rig, the canisters (with Kevlar or plastic longitudinal fins attached) are connected to the drill rod and forced through deployment mud until they reach the 4km deep deployment zone. Eight shearing pins, used to ensure that accidental release is impossible, break when the rig provides the appropriate set down weight of 18 metric tons thereby releasing the canisters. Special grease is inserted into the canister's fishing neck, to ensure that retrieval is possible using the same method. This study did not go into the details of time or cost for this process. Figure 2-7 presents an engineering design drawing of the proposed canister emplacement mechanisms.
Figure 2-7. Schematic of canister emplacement tools described by SKB's engineering feasibility
study[29]. The lower drawing depicts two canisters with longitudinal fins attached to each other.
2.3.2. MIT Emplacement Method Issue- Structural
Evaluations completed at MIT [12],[17], consistent with oil and natural gas experience and previous investigations of DBWD [30] , suggested the use of steel cables to lower canisters into the borehole. The theses assume that all 400 canisters would be connected and lowered as a single 2 km drill string, and this results in small loading times for each lateral (<50 days), compared to SKB's estimates for an equivalent length of waste emplacement. Additional engineering margins and structural issues involved for this technique may be an issue. For example, assuming the canisters are connected via threaded connections (as drill string sections typically are) the tensile stresses calculated in Gibb's thesis [17] do not take into account stress
concentration factors in fittings. Considerable research has been conducted on the stress
concentration profiles resulting in drill string connections, because failure of borehole casings is extremely risky and costly to the oil industry[3l]-[34]. The studies report that 80% of accidents and failures occur from the stresses in the threaded region, and highlight it as the weakest point in oil tubing and casing. The analyses indicate maximum stress concentration factors (SCF) under axial loading vary within a range of 3.29 to 8.56, depending on the pin or box thread profile. Figure 2-8 displays the standard thread profiles of interest and depicts the distribution of stresses. Pin LET ZIR R Z Box LET
Figure 2-8. Cross sectional diagram of a standard drill string threaded connection and finite
element analysis (FEA) model of stress distribution [31].
Another variable determining the failure of the threads is the torque sustained by the connection of pipes, a scenario analyzed in Figure 2-9.
700 600 | -*-Analytical Method J 500 -~300 200 100 0 0 1 2 3 4 5 6 7 8 9 10 11 12 13 14 15 16 17 18 19 Thread Number
Figure 2-9. Depiction of mean contact stresses experienced by individual pipe threads. Obtained by analytical and finite element analysis in ANSYS models of an American Petroleum Institute
(API) 88.9 mm round threaded drillstring connection [34].
Note that at higher thread numbers, the mean contact stress exceeds the minimum yield strength of the most API steels, resulting in partial deflection of the innermost threads. Table 2-7 presents the material properties of standardized steels used in oil wells.
Table 2-7. API Steel Specifications [35]
Grade Minimum Yield Strength Minimum Tensile Strength
(MPa) (MPa) H40 276 414 J55 380 520 K55 380 655 N80 550 690 L80 550 655 C90 620 690 T95 655 725 P110 760 860
Other SCF's to consider result from the welding of lids to the canisters [36][37]. The process of welding the metal container to maintain a seal is required for any repository canister design, and
furthermore, residual stresses can result from the differential cooling of the welded metals. Overall, SCF's from joints, welds and additional thermal stresses all contribute to reduce the
maximum theoretical length of a waste string based on tensile stress. These SCF's on the threaded connections would also apply when calculating the crushing strength or compression
limits of the waste canister column, a significant and limiting factor in the deep borehole canister design (it was one of the initial motivations for the Gibb's multi branch design) [17].
2.3.3. MIT Emplacement Method Issue- Speed
Emplacement of canisters requires three steps -loading, lowering and retrieval of the string- each of which can occur at different speeds. The process of loading a canister is similar to loading or attaching a drill bit, which could in theory occur quite quickly given the expertise the oil industry has developed. However, the difficulty of dealing with the radiation fields and heat production should not be underestimated. Gibbs' thesis on multi-branch boreholes assumes a loading rate of
5 canisters/hour, waste lowering speed of 175 m/hr (0.04861 m/s) and a retrieval speed of 350
m/hr (0.08466 m/s) [17], and serves as a lower bound estimate for the winch speed of waste deployment. An upper bound estimate for the speed assumes that individual canisters can be lowered as fast as a high capacity deep ocean winch, which operates at approximately 2 m/s [38].
A summary of estimates for the waste canister trip times based on assumed winch speeds is
shown in Table 2-8, while estimates for the billing rates are shown in Table 2-9.
Table 2-8. Summary of trip times calculated for varying assumptions of the possible lowering
speed of a single canister to an average depth of 3 km.
Assumption Comments Lowering Retrieval Lowering Retrieval Round
Description Speed Speed trip time trip time trip
time
Lower bound Lowering speed 0.04861 m/s 0.0972 m/s 17.14 hrs 8.57 hrs 25.71
on speed of canister string (574 ft/hr) (1148 ft/hr) hrs
assumed in Gibbs' multibranch
thesis [17]
Median Lowering speed 0.08466 m/s 0.08466 m/s 9.84 hrs 9.84 hrs 19.68
estimate on of drill string (1000 ft/hr) (1000 ft/hr) hrs
speed segments, used
by Sandia in an EGS drilling
study [9]
Upper bound Typical Ocean 2.0 m/s 2.0 m/s 0.416 hrs 0.416 hrs 0.833
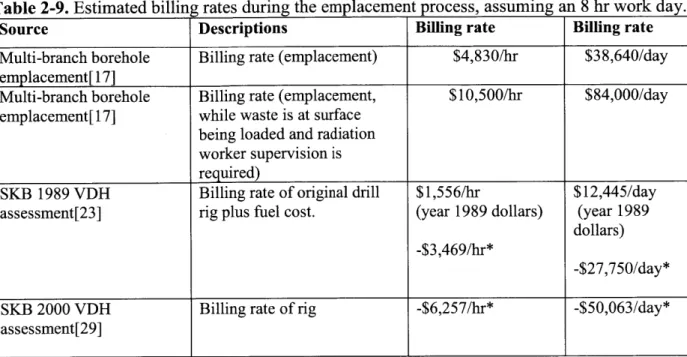
Table 2-9. Estimated billing rates during the emplacement process, assuming an 8 hr work day.
Source Descriptions Billing rate Billing rate
Multi-branch borehole Billing rate (emplacement) $4,830/hr $38,640/day
emplacement[ 17]
Multi-branch borehole Billing rate (emplacement, $10,500/hr $84,000/day
emplacement[17] while waste is at surface
being loaded and radiation worker supervision is required)
SKB 1989 VDH Billing rate of original drill $1,556/hr $12,445/day
assessment[23] rig plus fuel cost. (year 1989 dollars) (year 1989
dollars) -$3,469/hr*
-$27,750/day*
SKB 2000 VDH Billing rate of rig -$6,257/hr* -$50,063/day*
assessment[29]
*(adjusted to present costs using MITDD, Table 2-4)
Overall, the billing rates lie in the range of $3,469/hr to $6,257/hr for normal emplacement operations. The average value of the three estimates is $4,852/hr. Gibbs assumes that a billing rate of $10,500/hr is appropriate during loading of the canister onto the drill string, which requires additional radiation worker supervision. The total time and cost, combining assumed
loading times, winch speeds and billing rates are shown in Table 2-10.
Table 2-10. Summary of total loading times and costs for 400 canisters loaded per hole, with an
average value billing rate of $4,852/hr and a 10 minute billing rate of $10500/hr) for each canister.
loading period (with radiation worker ,
Assumption Total trip Total time Radiation Total Total cost Cost/kg HM Description time loading of worker labor Trip Cost (SM) emplaced
canisters loading cost ($M) ($/kg HM) onto rig Lower Bound 10268 hrs 66 hrs $700,000 50.237 50.937 $254.68 (of lowering speed) Median 7874 hrs 66 hrs $700,000 38.53 39.23 $196.1 estimate (of lowering speed) Upper Bound 333 hrs 66 hrs $700,000 1.94 2.64 $13.20 (of lowering speed)
With the upper bound winch speed of 2.0 m/s, a one-at-a-time approach could require as little as 400 hours to lower 400 canisters into a single borehole. However, the single canister approach may also take as long as 10,353 hours, which when divided by 8 hours for a single work day, is
1285 work days. Using the average value billing rate, the operational cost of loading a single
borehole in this fashion is between $2.64 million and $50.9 million. Even with a conservatively high winch speed, the emplacement cost is still the same order of magnitude as the drilling costs. Dividing the operation cost by the total waste contained in a borehole, the deployment stage cost per unit mass is approximately $13-$254/kg of heavy metal (HM). In total, a single crane would take 11-472 years to stack canisters in all 400 boreholes needed for an 80,000 MTHM capacity repository.
Alternatively, conservatively assume that 20 waste canisters could be connected and disregard the structural and handling difficulties associated with a 100 meter tall, 40 metric ton radioactive column. When lowered as a single drill-string segment (at the lower bound and median speeds, appropriate for drill strings) the total operational loading cost is still on the order
of millions of dollars, as shown in Table 2-11.
Table 2-11. Summary of total loading times and costs for 400 canisters loaded per hole, with 20
canisters connected and lowered together. Assumes the average value billing rate of $4,852/hr and a 10 minute connection period (with radiation worker billing rate of $10,500/hr) for each canister.
Assumption Total trip Total time Radiation Total Total cost Cost/kg HM Description time loading of worker labor Trip Cost ($M) emplaced
canisters loading cost ($M) ($/kg HM)
onto rig Lower Bound 514 hrs 66 hrs $700,000 2.49 3.1957 $15.97 (of lowering speed) Median 393 hrs 66 hrs $700,000 1.9105 2.6105 $13.05 estimate (of lowering speed)
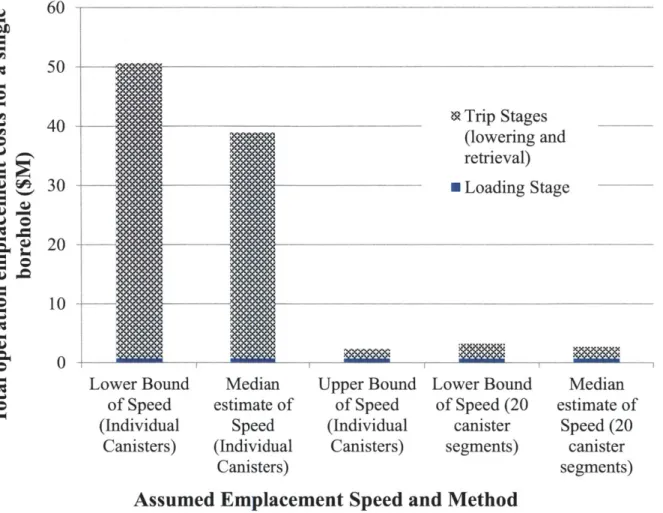
Figure 2-10 compiles the total cost information from Table 2-10 and Table 2-11 and presents it in bar graph form.
u 60 40 40__---_ TrpStages ___ (lowering and retrieval) 30 - Loading Stage 20
Lower Bound Median Upper Bound Lower Bound Median
of Speed estimate of of Speed of Speed (20 estimate of
(Individual Speed (Individual canister Speed (20
Canisters) (Individual Canisters) segments) canister
Canisters) segments)
Assumed Emplacement Speed and Method
Figure 2-10. Overview of total emplacement costs ($M) calculated using various assumptions on
the lowering speed and number of canisters connected.
The conclusion from analyzing the various methods is that 2-3 million dollars is a minimum loading cost for a borehole, using optimistic assumptions for either the lowering speed or capability to connect canisters. If interconnection of canisters is not feasible, and winch speeds are typical of current drill rigs, the costs are increased by an order of magnitude. These costs are similar to those calculated by SKB, which assumed a deployment period of 365 days and a minimum deployment cost of $11.8 million (1989 $). When this cost is converted to present dollars using the extrapolated drilling index, it becomes $26.31 million.
2.4. Chapter Summary
The challenges faced when designing an emplacement method for nuclear waste are exemplified
by the well documented cases of the Yucca mountain repository and SKB's borehole repository,
which are discussed in terms of methods, costs, equipment and logistics. The cost of
emplacement is highly dependent on the billing rate ($/unit time), and a comparison of three studies is made to obtain an average billing rate of $4,852/hr, for a typical drill rig used during deep borehole operations. To accurately convert the cost estimates from the comprehensive- but decades old- SKB feasibility studies on VDH, an extrapolated drilling cost index is developed.
A critical analysis is completed on the structural and time issues inherent in a drill string method
for lowering waste into boreholes. The costs for the drill string method are estimated to be on the order of millions to tens millions of dollars, the same as drilling costs which have recently been focused on as a dominating factor borehole repository economics.
3. Proposed Emplacement Method
3.1. Chapter Introduction
Economics and safety are the two primary driving forces in the nuclear industry. As a result, it is desirable to reduce the cost, complexity and number of components needed for the
emplacement system to operate reliably. A recent study suggested that the DBWD could provide a significant cost reduction over currently accepted disposal strategies (mined repositories), from reduced operation and emplacement costs [13]. This study attempts to improve the expense,
speed and safety of the DBWD program by proposing a much less complex rig and process for the deployment stage.
3.2. Drop-in Method Description
The suggested alternative is fundamentally simple- fill the borehole with water, line up the canister above the column of water, and release the canister in a controlled manner. Water is suggested as a fluid because it is cost effective, abundant, non-toxic, and simple to transport and dispose. Additionally, it is transparent, which allows for the use of cameras (with a light source) for down-hole inspections and operations. Overall the method is suited to a vertical, fully-lined borehole where the diameter and direction of the hole and canister are constant. The certainty in geometric and hydraulic parameters provides certainty in the passively determined drag forces and thus velocity. As a precaution, an unfueled/waste-free canister which reports its velocity and location could be dropped first, to ensure that the borehole has been lined correctly and there are no unexpected angles or obstructions. This confirmation could also be achieved by lowering a wired camera, radar or other measurement device to manually inspect the integrity of the borehole lining. Based on drilling experience, the directional accuracy of the borehole lining is not expected to be an issue. For example, when the KTB borehole- drilled in Germany- reached a depth of 7.5 km, the borehole had only deviated from its original axis by 12 meters [39].
3.3. Reference Canister Design
The optimal canister and borehole design is a function of many factors, such as the cost of drilling, cost of materials, structural factors, corrosion issues, and plug and granite composition and performance. Although the factors involving cost have been estimated and discussed
numerous times previously, the remaining issues require significant research for a borehole design to be finalized. As a starting point upon which to test the feasibility of the drop-in concept, the canister design for a vertical borehole was taken from Hoag's MIT thesis [12]. Sandia National Lab's (SNL) investigation of deep borehole cost and performance also uses Hoag's design as a reference [13]. The most relevant properties of the design are depicted in Figure 3-1. 0.387 m Canister Properties D, (outer) = 0.34 m Thickness= 12.19 mm 5 m M= 2000 kg l = 5 m Material: J55- P110 steel
Figure 3-1. Cross sectional view of the proposed emplacement method, based on Hoag's design for the pipe lining and canister dimensions [12] Not to scale. Note that the gap between the canister and the lining is an annulus with a thickness of 2.35 cm.
Hoag's design is based on structural, thermal and other geometric criteria to comply with oil and nuclear industry standards. Firstly, the diameter of the canister was chosen to be the minimum
diameter standard oil casing that would fit a 303mm diagonally wide, fully intact PWR
assembly. The length is not a limiting factor, and a standard oilfield casing is assumed to be cut in half to be 5 meters long (to contain a 4.059 m or 4.476 m long PWR or BWR assembly, respectively). The constituents and their masses are summarized in Table 3-1.
![Table 2-1. General Requirements imposed on the Yucca Mountain emplacement gantry [22]](https://thumb-eu.123doks.com/thumbv2/123doknet/14753431.581276/19.918.99.805.326.592/table-general-requirements-imposed-yucca-mountain-emplacement-gantry.webp)
![Table 2-2. Borehole options investigated by SKB and time requirements of each stage [23].](https://thumb-eu.123doks.com/thumbv2/123doknet/14753431.581276/21.918.103.797.137.320/table-borehole-options-investigated-skb-time-requirements-stage.webp)
![Figure 2-5. MIT drilling cost index vs. crude oil and natural gas prices[24]-[28]](https://thumb-eu.123doks.com/thumbv2/123doknet/14753431.581276/23.918.117.790.114.495/figure-mit-drilling-cost-index-crude-natural-prices.webp)
![Figure 2-6. Fitted and extrapolated MITDD drilling cost index based on Eq. (2-1) for a borehole depth of 4572-5333 m, plotted against the historical MITDD index data given in [24].](https://thumb-eu.123doks.com/thumbv2/123doknet/14753431.581276/24.918.111.794.106.401/figure-fitted-extrapolated-mitdd-drilling-borehole-plotted-historical.webp)
![Table 2-6. Summary of time and costs included in the SKB engineering study of VDH [29].](https://thumb-eu.123doks.com/thumbv2/123doknet/14753431.581276/25.918.103.805.907.1060/table-summary-time-costs-included-skb-engineering-study.webp)
![Figure 2-8. Cross sectional diagram of a standard drill string threaded connection and finite element analysis (FEA) model of stress distribution [31].](https://thumb-eu.123doks.com/thumbv2/123doknet/14753431.581276/27.918.119.711.356.698/figure-sectional-diagram-standard-threaded-connection-analysis-distribution.webp)
![Figure 3-2. An illustration of the Yucca Mountain waste package closure system, robotically welding a waste package lid in place [41]](https://thumb-eu.123doks.com/thumbv2/123doknet/14753431.581276/37.918.207.702.108.487/figure-illustration-mountain-package-closure-robotically-welding-package.webp)