HAL Id: hal-03243979
https://hal.archives-ouvertes.fr/hal-03243979
Submitted on 31 May 2021
HAL is a multi-disciplinary open access
archive for the deposit and dissemination of
sci-entific research documents, whether they are
pub-lished or not. The documents may come from
teaching and research institutions in France or
abroad, or from public or private research centers.
L’archive ouverte pluridisciplinaire HAL, est
destinée au dépôt et à la diffusion de documents
scientifiques de niveau recherche, publiés ou non,
émanant des établissements d’enseignement et de
recherche français ou étrangers, des laboratoires
publics ou privés.
Discrete Element Simulations of 4-Point Bending
Fatigue Tests of Asphalt Concrete Samples Reinforced
by Fiber glass Grids
Guixian Liu, Georg Koval, Cyrille Chazallon
To cite this version:
Guixian Liu, Georg Koval, Cyrille Chazallon. Discrete Element Simulations of 4-Point Bending Fatigue
Tests of Asphalt Concrete Samples Reinforced by Fiber glass Grids. 9th MairePAV conference, Jul
2020, Dübendorf (on line), Switzerland. �10.1007/978-3-030-48679-2_62�. �hal-03243979�
Discrete element simulations of 4-point bending
fatigue tests of asphalt concrete samples
reinforced by fiberglass grids
G. Liu1 , G. Koval1, * and C. Chazallon11 ICUBE Laboratory, CNRS, National Institute of Applied Sciences of Strasbourg,
24 Boulevard de la Victoire,Strasbourg 67084, France georg.koval@insa-strasbourg.fr
Abstract
This paper studies the fatigue damage of asphalt concrete (AC) under strain controlled load. The 3-phase fatigue life is reproduced by the proposed simulations combining a 2-phase fatigue damage law and the discrete element method (DEM) characterized by discrete force and dis-placement on each contact. The simulation results present good agreements with experiments after the parameter calibrations. The reinforcement effect of fiberglass grids on the fatigue life of asphalt concrete is studied with 4-point bending (4PB) fatigue test. These preliminary results comparing simulations and experiments show the consistency of the proposed 2D model on describing part of the interactions between grids and asphalt concrete.
Keywords: fatigue, damage, discrete element, four-point bending, asphalt concrete
1
Introduction
Repeated traffic loads induce fatigue solicitation of the pavement structure. Accurate predictions of the effect of a very large number of loading cycles (105 − 106) over
the components of the pavements is a major requirement for the optimization and de-sign of transport infrastructures.
At laboratory scale, alternate cyclic bending tests intend to quantify deflection effects. The results of stiffness degradation (𝐸𝑛/𝐸0, 𝐸𝑛 is the present sample modulus and 𝐸0
is the original modulus) with respect to the cycle numbers obtained in a typical cyclic loading test can be divided into three phases (Zheng et al. 2019, Arsenie et al. 2017). In the first phase, the defects exist and micro cracks are created in the matrix between the aggregates. In the second phase, the cracks grow and connect. In the third phase, the cracks interconnect. The sample loses its homogeneity and large cracks appear and propagate unstably with an increasing rate.
The fatigue damage causes large amount of maintenance cost. Thus, the reinforcement of the asphalt concrete (AC) is widely studied by researchers (Guo et al, 2015; Ge et al, 2015; Nguyen et al, 2013). In the last decade, the reinforcement by fiberglass grids
has been applied to improve the mechanical response of pavement structure materials. Hu and Walubita (2009) indicate that fiberglass grid helps to distribute the stress and prevent crack propagation from top to bottom and the opposite direction. They may dissipate stress concentrations due to reflection and fatigue cracks, and work as mois-ture barriers (Nguyen et al, 2013), which significantly reduces the damage and im-proves the service life. However, there is still a lack of research describing how the grid works in AC under fatigue load.
The aim of this research is to analyze laboratory experimental results of Arsenie (2013, 2017), which deals with 4-point bending (4PB) tests of reinforced and non-reinforced AC samples by means of computer simulations. The originality of the study is to im-plement a simple law of 2 regimes proposed by Bodin (2002, 2004) for AC as a contact law in discrete element method (DEM). This modelling approach takes advantage of DEM to reproduce the heterogeneous microstructure and crack development in ce-mented materials (Nguyen et al, 2019).
Section 2 presents the experimental setup. The third section covers the fatigue model description and its implementation in DEM. Section 4 presents the material calibration obtained by the comparison with experimental results. In section 5, the reinforcements are introduced on the model and the numerical results are discussed. Finally, in section 6, the conclusions of the paper are summarized.
2
Experimental setup
During her study, Arsenie (2013, 2017) performed 4-point bending (4PB) fatigue tests intending to quantify the contribution of the fiberglass grids on the fatigue life of as-phalt concrete samples.
The geometry of the specimen is presented in Fig. 1. The standard beam dimensions have been adapted in order to have three warp yarns in the width of the beam. There-fore, the standard beam dimensions have been increased in width, length and thick-ness. Each beam has a length 𝐿 = 630 𝑚𝑚, and a square cross section with height ℎ = 100 𝑚𝑚 and width 𝑤 = 100 𝑚𝑚. The layers are bonded with a bitumen emul-sion. The specimens of experiments are separated into two categories: reinforced as-phalt concrete and non-reinforced asas-phalt concrete. The fiber grids lay between the AC layers in the reinforced beams.
3
A controlled strain condition is applied by the sinusoidal motion of the central supports as described in Fig. 2, which is the typical loading setup in fatigue of asphalt concrete (Partl et al, 2000). The reaction force on the supports 𝐹𝑣 also presents a sinusoidal
response.
Fig. 2 Loading setup of the 4-point bending (4PB) tests performed by Arsenie (2013, 2017).
3
Fatigue model and discrete element implementation
3.1 Local fatigue model
The material fatigue damage 𝐷 is a state variable which characterizes the material me-chanical condition. Its value ranges from 0 to 1 (𝐷 = 0 indicates an intact material, whilst 𝐷 = 1 defines its complete failure).
3.1.1 Rate of damage growth 𝐷̇
The rate of damage growth 𝐷̇ is defined as 𝐷̇ = 𝑓(𝐷)𝜀̃𝛽(𝜀̃̇)
+, (1)
where (𝜀̃̇)+ is the positive value of the rate of increment of the local strain 𝜀̃ (more
details refer to Bodin 2002) and 𝛽 is a variable related to the fatigue slope −1 − 𝛽 in log-log scale. 𝑓(𝐷) is a function of the damage factor, which was proposed by Paas (1990) as
𝑓(𝐷) = 𝐶𝐷𝛼, (2)
where 𝐶 and 𝛼 is a scalar parameter. According to Eq. (1), only a positive increment of strain may induce damage.
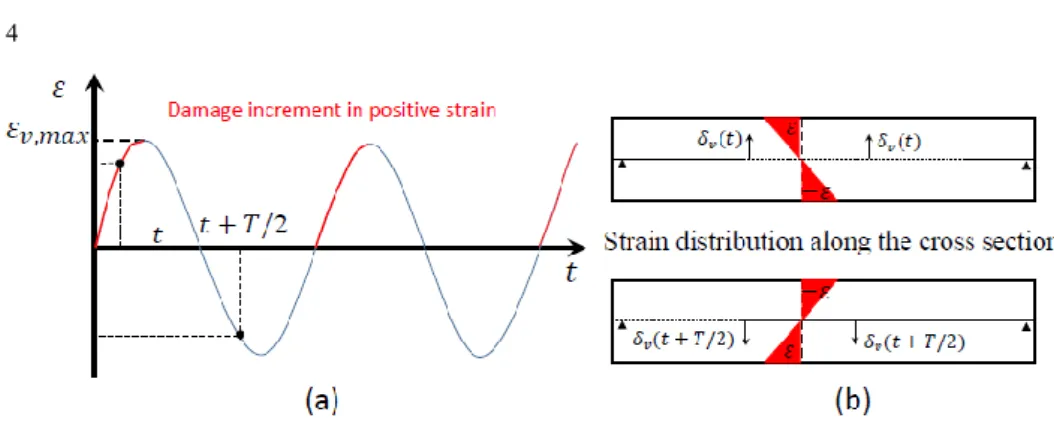
3.1.2 Increment of damage 𝜹𝑫 per cycle
According to Eqs. (1) and (2), the damage is considered to be incremented only in tension and for positive strain rates. For a cyclic loading centered at zero, it represents the segments in Fig. 3 for 𝑁𝐶× 𝑇 ≤ 𝑡 ≤ 𝑁𝐶× 𝑇 + 𝑇/4, where 𝑁𝐶 is the number of
Fig. 3 Loading cycle contribution on damage increment.
Eq. (1) associated to Eq. (2) can be rewritten as 𝐷̇/𝐷𝛼= 𝐶𝜀̃𝛽(𝜀̃̇)
+. (3)
The local strain 𝜀̃ induces damage increment only on the first quarter of the cycle, which means (𝜀̃̇)+= 𝜀̃̇ for 0 ≤ t ≤ T/4. As shown more in detail in Liu (2019), for
constant strain cycles, the evolution of the damage as a function of the number of cycles 𝑁𝐶 can be obtained by integration of Eq. (3) over the range of time 0 ≤ t ≤
𝑁𝐶× 𝑇, which leads to
𝐷(𝑁𝐶)1−𝛼/(1 − 𝛼) = 𝐶 𝑁𝐶𝜀𝑎1+𝛽/(1 + 𝛽), (4)
where D(𝑁𝐶) is the damage at t = 𝑁𝐶× 𝑇 and 𝜀𝑎 corresponds to the amplitude of the
local strain for a sinusoidal cycle. An incremental expression for damage can be ob-tained by derivation of Eq. (4) with respect to the number of cycles 𝑁𝐶
𝛿𝐷/𝛿𝑁𝐶 = 𝐶𝐷𝛼𝜀𝑎1+𝛽/(1 + 𝛽). (5)
The value of damage 𝐷 must be initialized (𝐷 = 0). The value of the damage after the first cycle 𝐷(1) can be obtained from Eq. (4) for 𝑁𝐶= 1 :
𝐷(1) = [𝐶(1 − 𝛼)𝜀𝑎1+𝛽/(1 + 𝛽)] 1/(1−𝛼)
. (6)
3.2 DEM implementation of the fatigue model - Damage and force
calculation
In this study, the equivalent strain 𝜀̃ of the simulation is obtained from the combination of the normal and tangential relative displacements (𝛿𝑛 and 𝛿𝑠) at the contact (for more
details, see Liu, 2019). The amplitude of the local strain is consequently the maximum value of the local strain under cyclic loading 𝜀𝑎= max (𝜀̃).
5
In the first cycle, the damage factor 𝐷 is initialized, being calculated for each contact by Eq. (6). At each new cycle, 𝐷 is modified incrementally, based on a first order solution of Eq. (5) as
𝐷(𝑁𝐶+ ∆𝑁𝐶) = 𝐷(𝑁𝐶) + ∆𝑁𝐶[𝐶𝐷𝛼𝜀𝑎1+𝛽/(1 + 𝛽)], (7)
where ∆𝑁𝐶 is the cycle increment parameter. Any value of ∆𝑁𝐶 > 1 allows a gain of
calculation time, but must be carefully chosen not to induce cumulative errors. After the damage identification, normal and tangential forces can be updated as following
𝑓𝑛= 𝑘𝑛(1 − 𝐷)𝛿𝑛, (8)
𝑓𝑠= 𝑘𝑠(1 − 𝐷)𝛿𝑠,
where 𝑘𝑛 and 𝑘𝑠 are the normal and tangential stiffness of the intact contacts,
respec-tively. The fatigue model was programmed and compiled in C++ language as part of the contact constitutive model implemented on the software PFC. For more infor-mation see reference Itasca (2014).
3.3 Geometry and boundary conditions of 4-point bending (4PB) tests
4PB tests are simulated by discrete element method (DEM). The geometry follows the dimensions of the experiments performed by Arsenie (2013, 2017) as indicated in Fig. 4a with length 𝐿 = 630 𝑚𝑚, height ℎ = 100 𝑚𝑚 and an equal spacing between sup-ports 𝐴 = 200 𝑚𝑚. Experimentally (and numerically), supsup-ports 1 and 2 do not move, whilst supports 3 and 4 are driven by a cyclic centered displacement with an imposed amplitude δ𝑣,𝑚𝑎𝑥. The maximum normal strain level 𝜀𝑚𝑎𝑥 is observed in the middle
section of the beam in upper and bottom positions and can be calculated by the ex-pression (Arsenie, 2013)
𝛿𝑣,𝑚𝑎𝑥= (5/3)(𝐴2/ℎ)𝜀𝑚𝑎𝑥. (9)
The reduced size of the supports, associated to free rotation prevent any undesired bending moment. The elastic distribution of efforts was verified comparing the results of the simulations to bending theory. However, the unrealistic dimensions of the sup-port may induce a concentration of efforts which may lead to an inappropriate accel-eration of the damage of the structure. This effect is avoided by the deactivation of the damage calculation (𝐷 = 0) inside a rectangular zone (10 𝑚𝑚 × 15 𝑚𝑚) around the supports (see Fig. 4b). This assumption does not cause any nonphysical behavior, such as a discontinuity on the damage field, because the supports are located in an area with very low damage during the simulations, as discussed in section 4.
The vertical force 𝐹𝑣, which correspond to the supports reactions, is measured during
Fig. 4 Geometry of the 4PB samples in DEM. (a) Indication of the dimensions over the particle
pack-ing and (b) contact properties by zones.
4
Calibration of the material parameters with experiments
In the 4PB tests of Arsenie (2013, 2017), the strain level is driven by the value of maximum amplitude of the normal strain ε𝑚𝑎𝑥 (obtained on the top and the bottom of
the middle section). ε𝑚𝑎𝑥 is theoretically related to the vertical displacement of the
central supports 𝛿𝑣 by Eq. (9). Respectively, on the simulations the values of 𝛿𝑣 of
76.7 𝜇𝑚 and 90 𝜇𝑚 are adopted. For the discrete element material description, the ra-dius of particles follows a uniform distribution. The average value is 𝑅̅ = 2.9 𝑚𝑚 and the size ratio 𝑅𝑚𝑎𝑥⁄𝑅𝑚𝑖𝑛= 1.6 . The contact stiffness is 𝑘𝑛= 2.0 × 10¹⁰ 𝑁/𝑚 ,
𝑘𝑟= 4.5, corresponding to a Young's modulus 𝐸 = 11 𝐺𝑃𝑎 and a Poisson's ratio ν =
0.34. The numerical results are obtained with an increment of cycles ∆𝑁𝐶 = 100,
which leads to accurate and efficient calculations as presented in Liu (2019). In Fig. 5, the experimental results of the stiffness fraction 𝐹𝑣/𝐹𝑣0 as a function of the
number of cycles 𝑁𝐶 for ε𝑚𝑎𝑥= 135 𝜇𝑚/𝑚 and 150 𝜇𝑚/𝑚 are presented. Here 𝐹𝑣0
is the initial value of the reaction force 𝐹𝑣. The envelope curves with minimum and
maximum values were obtained considering 6 different samples and show the rela-tively large variation of the experimental results. The average curves are the references for the calibration of the parameters of the fatigue model, as follows: 𝐶 = 8.7 × 10⁸,
𝛼 = −2.0 and 𝛽 = 3.0. The average results of the simulations of the 3 different sam-ples are in very good agreement with the experimental results with above parameters. The envelopes of results of the DEM simulations depends on the microstructure of the ensembles (granulometry, void ratio, etc.), which is an important feature of discrete approaches. However, the optimization of these microstructural parameters were not object of the present study.
7
Fig. 5 Stiffness fraction 𝐹𝑣/𝐹𝑣0 as a function of the number of cycles 𝑁𝐶 for (a) ε𝑚𝑎𝑥= 135 𝜇𝑚/𝑚
and (b) ε𝑚𝑎𝑥= 150 𝜇𝑚/𝑚. Comparison between DEM simulations of 4PB tests and experiments of Arsenie (2013, 2017).
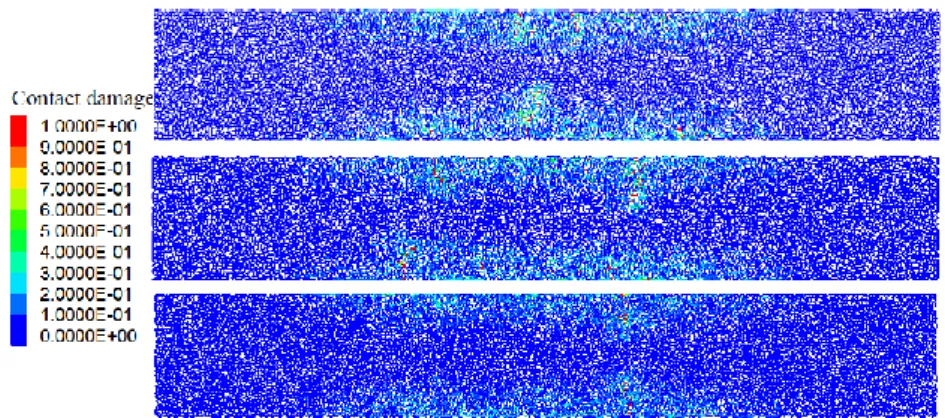
Each of the numerical samples presents different damage evolutions and strain locali-zations due to different particle distribution. The damage maps of each analyzed sam-ple (Fig. 6) bring up some physical elements related to the variation of results. After a roughly homogeneous damage, mostly localized at the central span, the irregularity of the inner structure of the material induces different weak points. These points give rise to concentrated damage zones, physically behaving as cracks. The localization of these damage zones affects the sample response which explains most of the visible differ-ences between the curves 𝐹𝑣/𝐹𝑣0 as a function of 𝑁𝐶.
All damage maps seem continuous near the supports which may indicate a neglectful effect of the deactivation of the damage around them as suggested in section 3.3.
Fig. 6 Damage map for all the three samples for a stiffness fraction 𝐹𝑣/𝐹𝑣0=0.4.
5
Effect of the glass fiber grids in 4PB tests
5.1 Model of the reinforcements
The cross section of the bending samples is presented in Fig. 7a. Considering the lack of precise information about the fatigue behavior of the contact between asphalt crete and fiber glass, a perfect adhesion hypothesis is adopted. Consequently, the con-tribution of the yarns in 2D is taken as elastic axial reinforcements working under tension and compression (bars). The elastic stiffness k𝑓 of one segment 𝑖 of a fiber
glass reinforcement is determined by the expression:
𝑘𝑓𝑖= 𝐸𝑓𝐴𝑓/𝑙𝑖, (10)
where 𝐸𝑓 is the elastic modulus of the fiber grid and 𝐴𝑓 is the total cross section of
fiber grid per layer and 𝑙𝑖 is the length of the segment. The effect of the bars are then
taken into account on the discrete element model as additional contacts (Fig. 7b) con-necting particles located at each layer, as shown in Fig. 7c. The contact properties are simply 𝐸𝑓 and 𝐴𝑓, whilst the length 𝑙𝑖 are automatically calculated based on the
dis-tance between the connected particles.
(a)
Fig. 7 (a) Cross section of the 4PB samples. Representation of the reinforcement bars (b) as additional
9
5.2 Effect of the fiber reinforcements on the fatigue behavior tests
The average evolution of the stiffness factor 𝐹𝑣/𝐹𝑣0 as a function of the number of
cycles 𝑁𝐶 is shown in Fig. 8 for a strain amplitude of ε𝑚𝑎𝑥= 150 𝜇𝑚/𝑚. The results
of 3 samples with fibers compared to the previous results without reinforcements in-dicates an improvement of the fatigue life induced by the reinforcements. However, the global effect of the grids shown by the experiences of Arsenie (2013, 2017) is underestimated by the simulations. The contribution of the reinforcements seems to be more effective for 𝐹𝑣/𝐹𝑣0< 0.7, when damage localized zones cross the fiber layer
as observed by Liu (2019). On the experiments, the fiber grid improves the fatigue response since the beginning of the test, independently to any eventual damage level. This preliminary results suggests that a different mechanism may be associated to the fiber grid behavior, other than a simple axial reinforcement.
Fig. 8 Stiffness fraction𝐹𝑣/𝐹𝑣0 as a function of the number of cycle 𝑁𝐶 in 4PB tests (ε𝑚𝑎𝑥=
150 𝜇𝑚/𝑚). Comparison between DEM simulations and the experiments of Arsenie (2013, 2017).
6
Conclusions
A fatigue damage model for asphalt concrete is adapted and implemented in a discrete element environment. A simple model describing material bulk behavior (phases 𝐼 and 𝐼𝐼) associated to the natural disordered microstructure of the discrete model is shown to be able to describe the entire fatigue behavior (phases 𝐼, 𝐼𝐼 and 𝐼𝐼𝐼) in a sample scale. Phase 𝐼𝐼𝐼 appears as a structure effect, which is characterized by a loss of ho-mogeneity induced by the concentration of defects and a localization of the strain. The contribution of fiber grids as axial reinforcements on 4PB fatigue behavior is in-vestigated. Experimental results points to a general improvement on the fatigue curves, whilst simulations seems to underestimate this effect of the fiber grids. The numerical results indicate that reinforcements are mostly activated when crossed by localized damaged zones.
The differences on experimental and numerical results suggest that grids do not act simply as axial reinforcements in asphalt concrete. Further analysis of the interface
between asphalt concrete and fiber grids may provide more information and improve the modeling as shown in Liu (2019).
Acknowledgements The study is funded by China Scholarship Council.
7
References
Arsenie, I.M. (2013). Etude et modélisation des renforcements de chaussées à l'aide de grilles en fibre de verre sous sollicitations de fatigue. PhD thesis, Université de Strasbourg. Arsenie, I.M, Chazallon, C., Duchez, J.L. (2017). Laboratory characterisation of the fatigue
behaviour of a glass fibre grid-reinforced asphalt concrete using 4PB tests. Road Materials
and Pavement Design 18(1), 168-180.
Bodin D., Pijaudier-Cabot, G., De La Roche, C., Piau, J.M., and Chabot, A. (2004). Continuum damage approach to asphalt concrete fatigue modeling. J. Eng. Mech. 130(6), 700-708. Bodin, D. (2002). Modele d'endommagement cyclique: Application à la fatigue des enrobés
bitumineux. PhD, University of Nantes (In French).
Ge, Z., Wang, H., Zhang, Q., and Xiong, C. (2015). Glass fiber reinforced asphalt membrane for interlayer bonding between asphalt overlay and concrete pavement. Construction and
Building Materials 101, 918-925.
Guo, Q., Li, L., Cheng, Y., Jiao, Y., and Xu C. (2015) Laboratory evaluation on performance of diatomite and glass fiber compound modified asphalt mixture. Materials & Design
(1980-2015) 66, 51-59.
Hu, X. and Walubita, L.F. (2009) Modelling tensile strain response in asphalt pavements: Bot-tom-up and/or top-down fatigue crack initiation. Road Mater. Pavement Des.10(1), 125-154. Liu, G. (2019) Discrete element modelling of asphalt concrete reinforced with fiber glass grids.
PhD thesis, University of Strasbourg, France.
Nguyen, M.L., Blanc, J., Kerzreho, J.P., and Hornych, P. (2013). Review of glass fibre grid use for pavement reinforcement and apt experiments at ifsttar. Road Materials and Pavement
Design 14(sup1), 287-308.
Nguyen, N.H.T., Bui, H.H, Kodikara, J, Arooran, S., and Darve, F. (2019). A discrete element modelling approach for fatigue damage growth in cemented materials. International Journal
of Plasticity 112, 68-88.
Paas, M.H.J.W. (1990). Continuum damage mechanics with an application to fatigue. PhD the-sis, Eindhoven University of Technology, The Netherlands.
PFC 5.0 Itasca. (2014). User manual. In Itasca Consulting group, Inc. Washington DC, US. Zhang, J., Shen, W.Q., Oueslati, A., and De Saxce, G. (2017). Shakedown of porous materials.
International Journal of Plasticity 95, 123-141.
Zheng, M., Li, P., Yang, J. (2019). Fatigue character comparison between high modulus asphalt concrete and matrix asphalt concrete. Construction and Building Materials 206, 655-664.