Physiological and proteomic responses to single and repeated hypoxia in juvenile
Eurasian perch under domestication e Clues to physiological acclimation and
humoral immune modulations
Jessica Douxfils
a,*, Mélissa Deprez
a, S.N.M. Mandiki
a, Sylvain Milla
a, Emilie Henrotte
a, Cédric Mathieu
a,
Frédéric Silvestre
a, Michaël Vandecan
b, Carole Rougeot
b, Charles Mélard
b, Marc Dieu
c, Martine Raes
c,
Patrick Kestemont
aaResearch Unit in Environmental and Evolutionary Biology (URBE), NARILIS, University of Namur (FUNDP), Rue de Bruxelles, 61, B-5000 Namur, Belgium bAquaculture Research and Education Centre (CEFRA), University of Liège (Ulg), Chemin de la Justice, 10, B-4500 Tihange, Belgium
cResearch Unit in Cellular Biology (URBC), NARILIS, University of Namur (FUNDP), Rue de Bruxelles, 61, B-5000 Namur, Belgium
a r t i c l e i n f o
Article history: Received 5 January 2012 Received in revised form 28 June 2012
Accepted 13 August 2012 Available online 12 September 2012 Keywords: Hypoxia Proteomics Immunity Domestication Fish a b s t r a c t
We evaluated the physiological and humoral immune responses of Eurasian perch submitted to 4-h hypoxia in either single or repeated way. Two generations (F1 and F5) were tested to study the poten-tial changes in these responses with domestication. In both generations, single and repeated hypoxia resulted in hyperglycemia and spleen somatic index reduction. Glucose elevation and lysozyme activity decreased following repeated hypoxia. Complement hemolytic activity was unchanged regardless of hypoxic stress or domestication level. A 2D-DIGE proteomic analysis showed that some C3 components were positively modulated by single hypoxia while C3 up- and down-regulations and over-expression of transferrin were observed following repeated hypoxia. Domestication was associated with a low diver-gence in stress and immune responses to hypoxia but was accompanied by various changes in the abundance of serum proteins related to innate/specific immunity and acute phase response. Thus, it appeared that the humoral immune system was modulated following single and repeated hypoxia (independently of generational level) or during domestication and that Eurasian perch may display physiological acclimation to frequent hypoxic disturbances.
! 2012 Elsevier Ltd. All rights reserved.
1. Introduction
Most of the organisms need molecular oxygen to support major metabolic processes. Predominantly, oxygen serves as the final electron acceptor in oxidative phosphorylation resulting in ATP formation inside mitochondria. Ten to 15% of total intracellular oxygen is also consumed in numerous cellular reactions catalyzed by mono- and di-oxygenases, oxidases or peroxidases[1]. There-fore, exposure to hypoxic conditions may adversely affect a wide variety of biochemical and physiological processes. In comparison to terrestrial animals, oxygen availability is more problematic for aquatic organisms given that water oxygen capacitance and oxygen diffusion are only 1/30th and 1/10000th of those measured in air at the same partial pressure respectively[2]. Oxygen availability in water can change rapidly compared to the terrestrial environment.
Fish are thus interesting model animals to study acclimation mechanisms to changes in environmental oxygen level.
Farmed fish regularly experience acute decreases in water oxygen concentration, especially during feeding and when reared at high density[3]. In many fish species, sub-lethal hypoxia causes a complex sequence of neural, behavioral and physiological modi-fications through the primary and secondary stress responses (i.e. allostasis) in an attempt to re-establish homeostasis[4]. Energeti-cally, there are costs associated with allostatic mechanisms and particularly under conditions of repeated and chronic stress[5]. In the long-term, the reallocation of energy away from some energy-demanding functions may be needed to still ensure efficient
stress-coping physiological responses [4,5]. Accordingly, stressful
husbandry conditions may indirectly affect growth, reproduction and the immune system[6e16]. Innate and acquired immunity are of particular importance for the host resistance to infectious diseases. This is particularly true in breeding environments where spatial restriction limits the fish opportunities to select areas associated with lower infectious potential and where fish-to-fish
*Corresponding author. Tel.: þ32 0 81 72 42 84; fax: þ32 0 81 72 43 62. E-mail address:jessica.douxfils@fundp.ac.be(J. Douxfils).
Contents lists available atSciVerse ScienceDirect
Fish & Shellfish Immunology
j o u r n a l h o m e p a g e : w w w . e l s e v i e r . c o m / l o c a t e / f s i
1050-4648/$ e see front matter! 2012 Elsevier Ltd. All rights reserved.
http://dx.doi.org/10.1016/j.fsi.2012.08.013
proximity facilitates the spreading of pathogens between individ-uals[17,18]. Up to now, only one study reported immunosuppres-sive effects and increased susceptibility to high doses of Edwardsiella ictaluriin channel catfish Ictalurus punctatus subjected to short-term sub-lethal hypoxia[4].
Domestication could be defined as a micro-evolution process during which captive animals acclimate and adapt to the enclosed environment and human care[19,20]. Domestication thus implies gradual changes in behavior, morphology and/or physiology over generations so that captive populations progressively fit to the breeding environment[21]. In captivity, fish are usually confronted to repetitive and chronic stress situations (e.g. confinement, crowding, hypoxia or handling) from which they cannot escape, and have no other option than acclimation/adaptation to husbandry stressors. Consequently, modulation of stress sensitivity and/or stress-coping responses might be expected to be part of domestication. The Eurasian perch is a recently domesticated fish compared to some ancient farmed salmonid and cyprinid species. In perch, studies already reported that some traits related to growth, stress response and immune status may be modified after only four generations in captive conditions[22,23]. In other fish species, domestication also rapidly influenced stress physiology, growth, reproduction and behavior after less than 7 generations
[24e28]. To date, no information is available regarding stress and immune responses to hypoxia in fish under domestication.
By providing information about gene expression at the protein level, proteomics appears as one of the strategies which can be used to get a better overall comprehension of underlying mechanisms and to complement the data obtained at higher levels of biological
organization [29,30]. Up to now, proteomic studies have been
performed in some fish species to evaluate the effects of variations in dissolved oxygen level (e.g. anoxia, hypoxia, hyperoxia)[31e33]. However, none of these studies examined changes in the serum proteome and whether they may be modulated along domestication.
This study aimed to investigate the physiological response to single or repeated hypoxia and subsequent effect on humoral immunity in the Eurasian perch (Perca fluviatilis), a percid species currently undergoing domestication. To evaluate whether domes-tication may imply changes in stress and humoral immune responses to hypoxia, captive fish from first and fifth generations were examined for usual stress markers (serum cortisol and glucose levels, spleen somatic index, muscle lactate concentration) and immune function (serum lysozyme activity and alternative complement pathway). Additionally, two-dimensional Differential In-Gel Electrophoresis (2D-DIGE) was used to resolve serum proteins. This work is the first to report changes in protein abun-dance in the serum of domesticated fish exposed to a hypoxic environment.
2. Materials and methods
The present protocol (FUN06/067) has been carried out in agreement with the local Ethics Committee for Animal Experi-ments in accordance with the European guidelines concerning animal welfare.
2.1. Fish generations and culture conditions
In the current experiment, we decided to compare only two filial generations (Filial 1:F1 versus Filial 5: F5) of one-year old juveniles. Firstly, we assume that comparison of a wild-close population versus a top-captive generation with a relatively long farming history can be representative of the changes occurring along domestication process. Besides, studies about the influence of
domestication on fish biological functions and behavior often
appeal to two contrasted domestication levels [24,25,34e36].
Secondly, covering all generational levels (i.e. F1, F2, F3, F4 and F5) was not an option because too many experimental conditions would have been included (limited facilities). Fish from the fifth generation (F5) originated from the reproduction of the fourth captive generation of breeders (F4) maintained under natural conditions in outdoor tanks. Those F4 breeders originated from successive reproductions of wild individuals (F0) from the Meuse River and their related captive offspring (F1, F2 and F3) in captivity. To obtain the first generation of captive fish (F1) used in the present study, another group of wild breeders (F00) was captured from the
Meuse River and allowed reproducing synchronously to the F4 breeders in the same photo-thermal conditions (Fig. 1). There are two reasons explaining the use of this new batch of wild breeders (F00). Firstly, we wanted to compare fish which have been reared for
several generations in captivity to fish obtained from wild indi-viduals with a very short captive-life history (i.e. wild breeders captured at the onset of the reproductive period and spawning for the first time in captivity). In this context, the F0 fish were no longer suitable to produce the F1 progeny because they have been main-tained for several years in the facility and were thus probably acclimated to captivity conditions. Secondly, a major part of the F0 breeders died after spawning in captivity so that we had to capture new fish from the wild at the time of producing the F1 juveniles. As a result, the F1 and F5 generations used in this study initially derived from two different groups of wild fish but which have been captured at an identical location (i.e. the “Tailfer” backwater) on the Meuse River in Belgium. According to Nesbo et al. (1999) [37], European populations of Eurasian perch showed very little genetic differentiation within drainages and regions and high levels of structuring only across drainages and regions. In view of the above, genetic background is expected to be similar between both generations at the start of the domestication process. From the fingerling stage, both generations were reared in duplicate under similar standardized conditions (4 m2tank, 15 kg/m3, 23"C, 16L:8O,
O2>7ppm) and fed once a day.
2.2. Experimental design of the single or repeated hypoxia Whatever the type of hypoxia, four conditions were compared: F1 under normoxia, F1 submitted to hypoxia, F5 under normoxia, F5 submitted to hypoxia. For each of these experimental conditions, fish (n ¼ 35 per tank; mean weight ¼ 68 $ 28 g) were held in triplicate in 100 L tanks. Progressive hypoxia was induced by removal of the airstone and complete arrest of water inflow. As soon as the oxygen level reached the pre-established threshold (2 mg L% 1), hypoxia was maintained during 4 h via slight
re-adjustments of water inflow. Dissolved oxygen concentration was continuously monitored and the current procedure allowed the stabilization of the hypoxic condition to 2.0 mg L% 1$ 0.5 mg L% 1
throughout each hypoxia session. The normoxic condition was
Fig. 1. This figure illustrates the way we obtained our captive F1 and F5 generations. Dotted arrows indicate capture of wild fish at the onset of the spawning period. Bold arrows indicate reproduction giving birth to the following progeny.
characterized by a stable dissolved oxygen level of 7.44 $ 0.37 mg L% 1throughout the experimental period.
2.2.1. Single hypoxia
Just after the first 4-h hypoxia period (Fig. 2), 5 fish per tank were harvested and anesthetized in an ethyl 3-aminobenzoate methane sulfonic acid salt 98% (MS-222, Sigma) solution (180 mg/L). Blood was rapidly collected from the caudal vein (within 5 min) to avoid the release of handling-induced cortisol. Blood was allowed to clot at 4"C prior to centrifugation (7500 & g,
5 min) and aliquoted serum was then stored at % 20 "C until
measurements of cortisol, glucose, lysozyme and alternative complement pathway haemolytic activities and 2D-DIGE proteo-mic analysis. Spleen and a piece of dorsal white muscle were dissected. Fresh spleen was weighed and muscle tissue stored at % 80"C until lactate measurement was carried out.
2.2.2. Repeated hypoxia
Fish were submitted to a 4h-period of hypoxia twice a week during 46 days (i.e. 12 hypoxic stress sessions) (Fig. 2). On Day 46 and just after the last 4-h hypoxia was applied, 5 fish per tank were sampled in the same way as for the single hypoxia test to evaluate the response to repeated hypoxic stress using the same bio-indicators.
2.3. Cortisol and glucose assays
Serum cortisol was assayed in duplicate using a cortisol ELISA kit (DRG, EIA-1887) and following the manufacturer’s instructions. The intra-assay coefficient of variation was 4.2%, the inter-assay coef-ficient of variation was 6.6% and the assay dynamic range was
between 0 and 800 ng ml% 1. Serum glycemia was determined
colorimetrically based on the glucose oxidase/peroxidase method described by Trinder (1969)[38].
2.4. Serum lysozyme activity
Lysozyme activity was evaluated in serum samples following the method of Siwicki and Studnicka (1987)[39]and Fatima et al. (2007)[40]with some modifications. Briefly, serum samples (7ml)
were mixed with 130 ml Micrococcus luteus (Sigma) solution
(0.6 mg/ml 0.05M sodium phosphate buffer e pH 6.2). Lysozyme assay was performed in triplicate. Absorbance was measured at 450 nm every 5 min during 30 min at room temperature. Lysozyme activity (Units.ml% 1.min% 1) in serum was defined as the amount of
enzyme causing a decrease in turbidity of 0.001. 2.5. Hemolytic activity of the alternative complement pathway (ACH50)
Following the method of Sunyer ant Tort (1995)[41]adapted by Milla et al. (2010)[42], ACH50 was evaluated using rabbit red blood
cells (RRBC, Biomerieux, Craponne, France) as targets. Briefly, serial dilutions (from 1/3 to 1/300) of serum in veronal buffer (Bio-merieux, Craponne, France) were performed and subsequently mixed with 10ml of 3% RRBC suspension in veronal buffer (total volume per well ¼ 70ml). Plates were incubated for 100 min at 27"C
and centrifuged at 2000 g for 10 min at 4"C. The spontaneous
hemolysis was obtained by adding 60ml of veronal buffer to 10ml of RRBC and total lysis was obtained by replacing veronal buffer by distilled water. Absorbance was measured at 405 nm. Alternative complement activity was expressed as the 50% lysis dilution calculated by linear regression.
2.6. Spleen-somatic index (SSI)
SSI was calculated according to the following formula: SSI (%) ¼ fresh spleen weight (g)/total fish weight (g) & 100. 2.7. Muscle lactate concentration
For muscle lactate extraction, 1 ml 0.9N perchloric acid was added to 200 mg of muscle tissue. Muscle was homogenized with Potter-Elvehjem homogenizer, pH was adjusted to 8e10 with potassium carbonate (1 M) and tissue was 20 times diluted in ice-cold phosphate buffer (100 mM; pH 7.4). Homogenates were centrifuged at 10 000 g for 5 min at 4"C and supernatants stored at
% 20"C until lactate assay was performed. Lactate concentration
was measured using anL-lactic acid kit (BoehringereMannheim) following the manufacturer’s instructions. Lactate concentration was expressed as mg g% 1muscle tissue.
2.8. Statistical analysis of physiological variables
Kolmogorov and Smirnov’s test was used to assess the normality of data sets (p < 0.05) and Bartlett’s test was conducted to evaluate variance homogeneity (p < 0.05). Results from single hypoxia and from repeated hypoxia were separately analyzed with two-way ANOVA (p < 0.05) taking dissolved oxygen (normoxia or hypoxia) and domestication level (F1 or F5) as two-modality factors. For both single and repeated hypoxia, the amplitude of glucose and SSI responses in F1 and F5 fish was further calculated as: D glucose ¼ Glucose level(hypoxia) e glucose level(control) and
DSSI ¼ SSI level(control)eSSI level(hypoxia)Values were then analyzed
using a two-way ANOVA (p < 0.05) with domestication level (F1 and F5) and stressor frequency (single or repeated) as two-modality factors. When significant, means were compared according to Tuckey’s HSD post-hoc test (p < 0.05).
2.9. 2D-DIGE proteomic analysis of serum samples 2.9.1. Protein extraction and CyDye minimal labeling
For either single or repeated hypoxia experiment, serum samples from 4 fish per tank were uniformly pooled and proteomic analysis was conducted with triplicate gels (one gel per tank; 12 tanks). All serum pools (n ¼ 24) were 6 times diluted in DLA buffer (7 M Urea, 2 M thiourea, 4% CHAPS, 30 mM Tris, pH 8.5) and centrifuged for 15 min at 12 000 g. Protein concentration of each diluted serum pool was determined using a Bradford protein assay with BSA as a standard. Using appropriate amount of 50 mM NaOH, pH was adjusted to 8.5 and protein concentration was measured again with the Bradford protein assay. For CyDye labeling, 200 pmol of fluorescent CyDye (GE Healthcare) were added to 25mg proteins. Cy3 and Cy5 were both used to label replicates of each experi-mental condition. A mixed sample composed of equal amounts of all pools (n ¼ 24) was minimally labeled with Cy2 and used as an internal standard. Labeling was performed on ice in the dark and
Fig. 2. Experimental protocol of single and repeated hypoxia. SINGLE hypoxia: the first hypoxia period was conducted on day 0 and fish (n ¼ 5 per tank, 3 tanks per condition) were immediately sampled at the end of the 4-h period. REPEATED hypoxia: Fish were exposed to 4-h hypoxia, twice a week during 46 days. The last hypoxic stressor was conducted on day 46 and fish (n ¼ 5 per tank, 3 tanks per condition) were immediately sampled at the end of the 4-h period.
quenched with 1 mM lysine for 10 min on ice. For each gel (n ¼ 12), the three labeled mixtures were combined and total proteins (75mg) were added to an equal volume of reduction buffer (7 M urea, 2 M thiourea, 2% CHAPS, 2% DTT, 2% IPG4-7buffer) for 15 min
at room temperature.
2.9.2. Protein separation by 2D-DIGE
Prior to electrofocusing, IPG strips (pH 4e7; 24 cm; GE Healthcare) were rehydrated overnight into 450ml of a standard rehydration solution (7 M urea, 2 M thiourea, 2% CHAPS, 0.28% DTT, 0.5% IPG buffer pH 4e7 and a trace amount of bromophemol blue). The twelve sample sets containing the labeled mixtures were cup-loaded onto the strips and isoelectric focusing was run on an Ettan" IGPphor II unit (GE Healthcare) with the following elec-trophoresis conditions: 20"C, 300 V for 3 h, 1000 V for 6 h, 8000 V
for 3 h, and finally 8000 V for 6 h for a total of 68 000 V-h. After-wards, focused IPG strips were reduced (1% DDT) and alkalized (2.5% iodoacetamide) in equilibration buffer (6 M urea, 30% glyc-erol, 2% SDS, 0.002% bromophemol blue, 50 mM Tris pH 8.8) just before loading on 10% 24 cm, 1-mm-thick, SDS-PAGE gels. The strips were overlaid with 0.5% agarose in SDS running buffer (25 mM Tris, 192 mM glycine, 0.1% SDS) and run at a constant voltage (0.5 W/gel) during 17 h at 15"C in an Ettan" DALTsix
electrophoresis unit (GE Healthcare) until the blue dye front reached the bottom of the gels.
2.9.3. Software image analysis and statistical tests
Labeled CyDye gels were scanned with a Typhoon 9400 scanner (GE Healthcare) at CyDye-specific wavelengths (488 nm, 532 nm and 633 nm for Cy2, Cy3 and Cy5 respectively). Resolution was 100mm. Image analysis was carried out using the Decyder v5.0 software (GE Healthcare). At first, the DIA module detected and quantified the protein spots in each image using the internal standard sample as a reference to normalize the data. Second, the BVA module allowed multiple gel comparisons and ratio calcula-tions by conducting a gel-to-gel matching of the internal standard spot map on each gel. The mean number of spots detected in the 12 gels was 1280 $ 94 and the mean number of spots matched across the gels was 939 $ 161. Representative gel for an overview of the 2D-DIGE is illustrated inFig. 3. Results were analyzed by a two-way
ANOVA (p < 0.05) and the multiple comparisons Tuckey Post-hoc test as previously described.
2.9.4. Mass spectrometry and protein identification
Preparative gels loaded with 250 mg of proteins of mixed
samples were run following the protocol described above except they were post-stained with Krypton" protein stain (N" 46630,
Pierce) following the manufacturer’s protocol. Preparative gels were scanned with the Typhoon 9400 scanner (GE Healthcare). Spots were excised from preparative gels using the Ettan" Spot Picker (GE Healthcare), and proteins were digested with trypsin by in-gel digestion. The gel pieces were twice washed with distilled water and then shrunk with 100% acetonitrile. The proteolytic digestion was performed by the addition of 3ml of modified trypsin (Promega) suspended in 50 mM NH4HCO3cold buffer. Proteolysis
was performed overnight at 37"C. The supernatant was collected
and the eluates were kept at % 20"C prior to analysis.
Peptides were analyzed by using nano-LC-ESI-MS/MS maXis UHR-TOF coupled with a 2D-LC Dionex UltiMate 3000 (Bruker, Bremen, Germany). The digests were separated by reverse-phase liquid chromatography using a 75mm & 150 mm reverse phase Dionex column (Acclaim PepMap 100 C18) in an Ultimate 3000 liquid chromatography system. Mobile phase A was 95% of 0.1% formic acid in water and 5% acetonitrile. Mobile phase B was 0.1% formic acid in acetonitrile. The digest (15ml) was injected, and the organic content of the mobile phase was increased linearly from 5% B to 40% in 35 min and from 40% B to 100% B in 5 min. The column effluent was connected to an ESI nano Sprayer (Bruker). In survey scan, MS spectra were acquired for 0.5 s in the m/z range between
50 and 2200. The 3 most intense peptides ions 2þ or 3þwere
sequenced. The collision-induced dissociation (CID) energy was automatically set according to the mass to charge (m/z) ratio and charge state of the precursor ion. MaXis and Dionex systems were piloted by Compass HyStar 3.2 (Bruker).
Peak lists were created using DataAnalysis 4.0 (Bruker) and saved as XML file for use with ProteinScape 2.0 (Bruker) with Mascot 2.2 as search engine (Matrix Science). Enzyme specificity was set to trypsin, and the maximum number of missed cleavages per peptide was set at one. Carbamidomethylation was allowed as fixed modi-fication, oxidation of methionine and Gln e pyro-Glu were allowed as variable modification. Mass tolerance for monoisotopic peptide window was 7 ppm and MS/MS tolerance window was set to 0.05 Da. The peak lists were searched against the full NCBInr database (12852489 sequences downloaded on February 2011).
Scaffold (version Scaffold-2_06_01, Proteome Software Inc., Portland, OR) was used to validate MS/MS based peptide and protein identifications. All MS/MS samples were analyzed using Mascot (Matrix Science, London, UK; version 2.2) and X! Tandem (The GPM,thegpm.org; version 2007.01.01.). Peptide identifications were accepted if they could be established at greater than 95% probability as specified by the Peptide Prophet algorithm [43]. Protein identifications were accepted if they could be established at greater than 99% probability and based on preferentially more than one identified peptide. Protein probabilities were assigned by the Protein Prophet algorithm[44]. When a protein spot could not be assigned to a single protein identification or if similar peptides were shared between several proposed proteins, all the protein hits were grouped to fit with the parsimony principle.
3. Results and discussion
3.1. Stress and immune responses to single hypoxia
In the present study, serum cortisol was used as a usual stress marker to evaluate whether Eurasian perch was sensitive to the
Fig. 3. Representative 2D-gel of serum proteome in Eurasian perch. Numbers assigned by Decyder software indicate identified protein spots with significant changes in intensity.
tested hypoxic conditions. Serum cortisol did not display significant differences with single hypoxic disturbance (Table 1). All treat-ments considered, cortisol concentration ranged from 10.28 to 21.54 ng ml% 1and was similar to levels observed for unstressed
Eurasian perch in previous studies[22,23,42,45]. Similarly, Muusze et al. (1998)[46]investigated the effects of progressive and step-wise hypoxia in Amazon fish (Astronotus ocellatus) and detected no differences in cortisolemia while significant effects on other phys-iological parameters (lactate concentration and metabolic rate) were observed. Conversely, other studies on Siberian sturgeon (Acipencer baeri) and spotted wolffish (Anarhichas minor) reported rapid (after 30 min and 2 h 30 respectively) and significant cortisol
elevation following a severe hypoxic disturbance [47,48]. In
Eurasian perch, it has been demonstrated that cortisol peaked earlier than 1 h following an acute stressor and rapidly returned to pre-stress level within 1e6 h[11,42,45]. In the current study, we hypothesized that cortisol may not return to basal value throughout the hypoxic course since fish were continuously exposed to hypoxia during 4 h and immediately sampled after this period. However, we did not observe any prolonged cortisol increase in fish following a single 4-h hypoxia. In turbot, Pichavant et al. (2002)[49]did not observe any cortisol elevation during a 6-h period of slight or moderate hypoxia but an increase of cortisolemia was seen under severe hypoxia throughout the 6-h period and up to 6 h after recovery in normoxic water. Thus, the severity of hypoxic stress may be an important contributing factor of the cortisol release. Our results either suggest the absence of a cortisol response (which may be related to the intensity of hypoxic stress) or indicate that cortisol rise following hypoxia was of short dura-tion (less than 4 h) and was not detected because it preceded blood sampling. We however detected elevated glycemia (p < 0.01) in the serum of single-stressed fish (Fig. 4A). As mentioned above, it is possible that we missed a rapid and transient cortisol rise which may be the trigger of such hyperglycemic response. For future research, it might be of interest to evaluate cortisol concentration as a function of time during hypoxia (e.g. 0.5, 1, 2, 3 and 4 h). An alternative explanation would be that hyperglycemia was induced by catecholamines. Several studies already demonstrated that situations like hypoxia requiring modulation of cardiocirculatory function and mobilization of energy reserves elicit catecholamine secretion[48e50]. Therefore, it might be interesting to measure the level of adrenalin/noradrenalin in Eurasian perch confronted to environmental hypoxia although this may be technically difficult. Indeed, use of cannulated fish would be required to perform proper sampling because of the very short time lag existing between stressor exposure and catecholamine release. More specific stress
markers such as the hypoxia-inducible factor (HIF) 1amay also be assessed to reveal hypoxic stress in Eurasian perch[51]. When hypoxic conditions are severe, measures to maintain blood oxygen supply and to conserve energy (e.g reduced locomotion or feeding behavior) may not be sufficient. This can lead to the slowing-down of ATP production through aerobic respiration, forcing the animal to use anaerobic pathways to contribute to its energy requirements
[49]. But anaerobic metabolism is not as efficient as aerobic respi-ration and a considerable increase in the glycolytic flux is needed to avoid a detrimental fall in cellular ATP[52,53]. As a result, blood glucose level increases for anaerobic fuel supply in many teleosts subjected to environmental and functional hypoxia and anaerobic metabolism further results in lactate accumulation in muscle tissue
[49,53e55]. Interestingly in the present study, muscle lactate did not accumulate in muscle tissue (Table 1) while blood glucose concentration increased following exposure to the single hypoxic period. Perhaps hyperglycemia was not linked to the activation of anaerobic metabolism (see below: metabolism of erythrocytes) in the hypoxic conditions tested or lactate did not accumulate in muscle tissue. Literature supports the hypothesis that fish could be categorized as lactate “releasers” (i.e. lactate transfer from muscle tissue into the circulation) and “non releasers”, depending on the species considered and the type/intensity of stressors[55,56]. It is not currently known if Eurasian perch belongs to the “releaser” category. To our opinion, it is essential to confirm any possible induction of anaerobic metabolism in Eurasian perch because this might bring important information on the tolerance level of this species to environmental hypoxia. Another possible cause for this hyperglycemic response would be linked to changes in the cellular compartment of the blood as suggested by SSI data. Indeed, SSI decreased (p ¼ 0.0002) after a single hypoxia, indicating
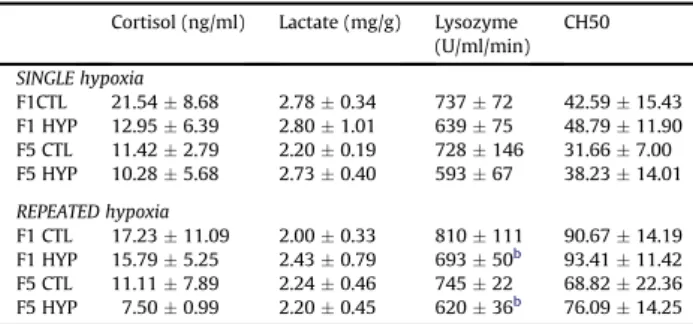
Table 1
Physiological stress indicators and immune parameters measured subsequently to single and repeated hypoxia in F1 and F5 generation.a
Cortisol (ng/ml) Lactate (mg/g) Lysozyme (U/ml/min) CH50 SINGLE hypoxia F1CTL 21.54 $ 8.68 2.78 $ 0.34 737 $ 72 42.59 $ 15.43 F1 HYP 12.95 $ 6.39 2.80 $ 1.01 639 $ 75 48.79 $ 11.90 F5 CTL 11.42 $ 2.79 2.20 $ 0.19 728 $ 146 31.66 $ 7.00 F5 HYP 10.28 $ 5.68 2.73 $ 0.40 593 $ 67 38.23 $ 14.01 REPEATED hypoxia F1 CTL 17.23 $ 11.09 2.00 $ 0.33 810 $ 111 90.67 $ 14.19 F1 HYP 15.79 $ 5.25 2.43 $ 0.79 693 $ 50b 93.41 $ 11.42 F5 CTL 11.11 $ 7.89 2.24 $ 0.46 745 $ 22 68.82 $ 22.36 F5 HYP 7.50 $ 0.99 2.20 $ 0.45 620 $ 36b 76.09 $ 14.25
aCTL, control treatment; HYP, hypoxia treatment (n ¼ 3).
bIndicates significant differences between respective control and hypoxia
treatments.
Fig. 4. Glucose response in the serum of Eurasian perch exposed to single or repeated hypoxia (n ¼ 3). A) Total glucose level (mg/ml). C ¼ control fish, H ¼ hypoxic fish. Asterisk (*) indicates significant differences between C and H treatment. B)Dglucose values (mg/ml). S ¼ single hypoxia, R ¼ repeated hypoxia. Asterisks (*) indicate differences between S and R treatment.
a significant spleen contraction in both generations (Fig. 5A). Likewise, other studies demonstrated that fish spleen contracted and released a considerable amount of erythrocytes into the circulating blood under both exercise and severe hypoxia[57,58]. Rapid increases in hematocrit and/or red blood cells (RBC) count were observed following hypoxia in Amazon fish, juvenile Tam-baqui (Colossoma macropomum) and silver trevally (Pseudocaranx dantex) [46,55,59]. Although this should be verified in Eurasian perch, we speculate that spleen contraction following a single hypoxia resulted in the release of supplementary erythrocytes into the bloodstream to improve its oxygen carrying capacity. Interest-ingly, it appeared that red blood cells have high metabolic main-tenance costs that are fuelled by both glucose and lactate[55]. Use of these molecules by metabolically active erythrocytes is expected to contribute to the maintenance of an efficient
hemoglobin-oxygen transport system [55]. Thus, the elevated glycemia
observed in the present study might also be explained by the release of spleen erythrocytes requiring glucose substrate for optimal oxygen transport activity. At the behavioral level, fish under hypoxia did not display any specific hyperactivity, trying to escape the hypoxic environment, and did not move upward to the water surface to resort to air breathing. Fish clearly adopted a resting behavior, remaining static at the bottom of the tank. Our observations are in accordance with data from the literature and suggest a shift towards energy saving strategies to face hypoxia
[60,61]. We therefore assume that the above-described physiolog-ical responses were not induced by any potential hyperactivity of fish under hypoxia but by the hypoxic environment itself.
Pertaining to the effects of hypoxia on the immune system, serum lysozyme activity and ACH50 did not significantly differ
following the single hypoxic period (Table 1). However, the pro-teomic analysis revealed that the single hypoxia challenge signifi-cantly influenced the abundance of some C3 complement proteins. Single hypoxia induced elevations of C3 complement proteins (spots n"764 and 797) regardless of domestication level and
up-regulated the abundance of distinct C3 complement proteins between both generations (spot n" 548 and 823 in the F1 and F5
generations, respectively). This suggests that domestication might be associated with few differences in the regulation of immune proteins following a single hypoxia (Table 2). Similarly to our
previous study on chronic confinement[23], we found numerous
protein spots identified as C3 complement. The presence of various C3 subunits is not surprising since multiple C3 isoforms have already been described for several fish species[62e64]. Moreover, it is well established that C3 components can be proteolyzed into several cleavage products, each with specific immune activities
[62,63,65]. Another explanation could be the proteolytic degrada-tion of serum samples. Although sample collecdegrada-tion and storage were conducted to minimize ex-vivo changes in serum proteome profiles (i.e. clotting at 4"C, rapidly followed by centrifugation and
immediate freezing at % 20"C), we cannot exclude some protein
degradation by endogenous proteolytic enzymes during the clot-ting process and following sample thawing since we did not add protease inhibitors to the serum. Following exposure to single hypoxia, up-regulation of these C3 proteins was however not associated with an increase in alternative complement hemolytic activity (ACH50). Perhaps, these fragments require equivalent modulation of other components to significantly influence the whole complement hemolytic activity. For example, C3b is an important fragment of the complement system, but other compo-nents (C5, C6, C7, C8 and C9) are essential to initiate the assembly of the membrane attack complex (MAC) responsible of cell lysis
[62,63]. Second, studies on fish species reported the existence of several C3 isoforms differing in their binding and hemolytic
effi-ciencies [62e64,66]. Although ACH50 was not affected in the
present study, we cannot ascertain that the increased amounts in some of the C3 proteins have no effects on the overall immune response since C3 components are not only involved in hemolytic activity but also in the inflammation process, leucocyte chemotaxis, ROS production, B-lymphocyte activation, opsonisation of exogen particles and phagocytosis[62,63,66]. A better characterization of these C3 fragments is now needed to deepen the knowledge on how a single hypoxic stress influenced the abundance and activity of proteins from the complement system.
3.2. Repeated hypoxic stress: clues to acclimation mechanisms and humoral immune modulations
Similarly to what happened after the single hypoxia experiment, fish exposed to repeated hypoxic disturbances did not display significant differences in the level of serum cortisol in comparison to unstressed fish, for both generations (Table 1). Once more, we detected elevated glycemia in the serum of repeatedly-stressed fish (Fig. 4A). However, the magnitude of hyperglycemia lowered (p ¼ 0.048) in all generations in comparison to fish stressed only once (Fig. 4B). Such reduction in hyperglycemic response may either indicate the development of acclimation mechanisms (at the physiological level and/or behavioral level, e.g. energy-saving behavior of more quiet fish) or exhaustion of the energetic metabolism. Indeed, decrease in stress response to long-term disturbance is usually associated with fish habituation [67,68]. But response attenuation may also be attributed to the exhaustion/ breakdown of the physiological system, when the animal is too fatigued to maintain an efficient stress response to the repeated stimuli[68]. This alternative explanation is rarely considered in
Fig. 5. SSI response in the serum of Eurasian perch exposed to single or repeated hypoxia (n ¼ 3). A) SSI (%). C ¼ control fish, H ¼ hypoxic fish. Asterisk (*) indicates significant differences between C and H treatment. B)DSSI (%). S ¼ single hypoxia, R ¼ repeated hypoxia. Asterisks (*) indicates differences between S and R treatment. Capital letters indicate differences between F1 and F5 generations.
field studies. As a result, it is often falsely concluded that fish with a lower stress response habituate to the long-term stressor while, in fact, they display a reduced capacity of response and remain repeatedly/chronically stressed[68]. Similarly to the single hypoxia experiment, we did not detect any significant lactate elevation in muscle tissue in relation to repeated hypoxia (Table 1). For future studies, evaluation of muscle and blood lactate concentration might be very informative with respect to the possible induction of anaerobic metabolism and “lactate releasing” activity in our studied species. In both generations, SSI decreased after repeated (p ¼ 0.046) hypoxic disturbances, indicating a significant spleen contraction (Fig. 5A). The amplitude of SSI decrease clearly atten-uated (p ¼ 0.0019) at the end of the repeated hypoxia experiment (Fig. 5B). But, conversely to hyperglycemia, this attenuation is likely to be due to SSI reduction in control fish rather than to a reduced contraction in repeatedly hypoxic fish. The 2D-DIGE proteomic analysis indicated that transferrin (spot n"351) was significantly
up-regulated in both generations following repeated hypoxic periods (Table 2). Similar findings were already reported in human cells, rat and mice exposed to hypoxic environment[69]. During hypoxia, it is conceivable that an elevation in plasma iron transport is required to ensure sufficient oxygen supply and illustrated by an increase in transferrin abundance[69e71]. Transferrin is also an acute phase protein that rapidly reduces iron availability to bacteria following injury, trauma or infection [71,72]. Together with this increased transferrin level, the reduced hyperglycemia would finally suggest the development of acclimation mechanisms to repeated hypoxic disturbances rather than fish exhaustion. For future research, it might be interesting to evaluate indicators such as haematocrit, haemoglobin and erythropoietin levels, ventilatory frequency and swimming behavior to confirm this hypothesis.
Serum lysozyme activity significantly decreased (p ¼ 0.012) in repeatedly-stressed fish from both generations (Table 1). The pro-teomic analysis also revealed that several C3 proteins were modulated following repeated hypoxic stress. Spot n"764 was the
only one to be up-regulated following both single and repeated hypoxia (Table 2). After repeated hypoxic disturbances, down-regulation was reported for several C3 complement proteins (spot n"823 in both generations and spot n"926 in F5 fish only) (Table 2).
Once more, modulations of C3 complement protein amounts did not induce changes in ACH50. Immuno-suppressive effects of stressors have already been reported in many studies e.g. [9,10,12,42,73,74]. Reduction in lysozyme activity and C3 component abundance in repeatedly-stressed fish may result from the energetic demand associated with long-term stress responses. Indeed, if a portion of the fish’s energy budget is required to cope with stressors, then less energy will be available for other biological functions, including immunity[5]. It now remains to be determined whether these immune changes would have deleterious effects on the fish overall resistance to disease through achievement of bacterial challenge tests. Moreover, since the effects of stressors might be tissue-specific[42], not only serum immune actors but defense mechanisms in internal organs (e.g. head kidney, spleen, thymus) and on the primary barrier (i.e. gut, gills, mucus and skin) should also be studied to go through the immunological conse-quences of hypoxia. Even if deleterious immune changes occur at the circulatory level, this may not necessarily result in an increased susceptibility to disease depending on the integrity and immune capabilities in these above-mentioned tissues.
3.3. Domestication and its influence on stress and immune responses to hypoxia
It seems that domestication was of limited influence on the stress and immune responses of fish to both single and repeated hypoxia (i.e. only significant divergence in the abundance of three C3 proteins: spots n"548, 823 and 926). Our previous studies on
chronic confinement suggested that domestication could be asso-ciated with a clearer divergence in stress responsiveness after only four generations reared in captivity [22,23]. To elucidate why
Table 2
List of identified proteins differentially expressed in serum of F1 and F5 P. fluviatilis following exposure to single hypoxia. Spot no. Accession no.a Protein name Species Matching
Peptidesb TheoreticalpI/Mw (kDa) Fold change cbetween
treatmentsd
764 gij226731843 Complement component C3 Perca flavescens 2 5.7/65 1.30ein HYP vs CTL
974 gij146447341 Fibrinogen beta chain precursor Paralichthys olivaceus 3 6.5/56 1.75ein F5HYP vs F1HYP
548 gij12957116 Complement component C3 Anarhichas minor 1 6.3/186 1.25ein F1HYP vs F1CTL
1.37ein F5CTL vs F1CTL
823 gij58373439 Complement component C3 Hippoglossus hippoglossus 2 5.7/59 1.47ein F5HYP vs F5CTL
1.47ein F5HYP vs F1HYP
797 gij6682835 Complement component C3 Paralichthys olivaceus 2 6.1/184 1.33ein HYP vs CTL
gij58373439 Complement component C3 Hippoglossus hippoglossus 2 5.7/59 1.57gin F5 vs F1
gij226731843 Complement component C3 Perca flavescens 2 5.7/65
401 gij225056702 Transferrin Dicentrarchus labrax 2 5.9/74 1.42ein F5 vs F1
556 gij225056702 Transferrin Dicentrarchus labrax 3 5.9/74 % 1.29ein F5 vs F1 405 gij33340571 Immunoglobulin heavy chain Siniperca chuatsi 2 5.4/63 1.45ein F5 vs F1
416 gij33340571 Immunoglobulin heavy chain Siniperca chuatsi 2 5.4/63 % 1.58ein F5 vs F1 255 gij6682835 Complement component C3 Paralichthys olivaceus 4 6.1/185 1.96fin F5 vs F1
gij226731843 Complement component C3 Perca flavescens 2 5.7/65
497 gij12957116 Complement component C3 Anarhichas minor 1 6.3/186 1.50fin F5 vs F1
368 gij6682835 Complement component C3 Paralichthys olivaceus 1 6.1/184 % 1.19ein F5 vs F1 243 gij6682835 Complement component C3 Paralichthys olivaceus 4 6.1/184 2.13gin F5 vs F1
gij226731843 Complement component C3 Perca flavescens 3 5.7/65
581 gij6682835 Complement component C3 Paralichthys olivaceus 6 6.1/184 % 1.26ein F5 vs F1
aNCBI database accession number.
bRefers to the number of sequenced peptides exclusively assigned to the protein. cPositive and negative values indicates up- and down-regulation respectively. dCTL, control treatment; HYP, hypoxia treatment.
ep <0.05. fp <0.01. gp <0.001.
domestication resulted in a better tolerance to chronic confinement and not to hypoxia, we propose that this may depend on the stressor capacity to severely threaten internal homeostasis. Indeed, stress response is first an adaptive mechanism to promote the best chances of survival towards hostile situations. In this context, low-level stress responses may not constitute a systematic advantage and the preservation of optimal stress responses may be necessary for immediate survival under severe conditions. This might be particularly true during exposure to physico-chemical, mechanical or thermal stressors which constitute real threats to homeostasis. We assume that severe environmental hypoxia belongs to this stressor category. On the other hand, certain stressors represent a perceived danger rather than a real hazard to life and body integrity (e.g. chronic confinement). Under such cognitive and/or mild stressing situations, reduction in stress sensitivity may not be deleterious since individuals are not really in danger. On the contrary, reduction in stress responsiveness may be profitable since energy expenditure associated with allostatic load would be avoi-ded. The influence of domestication on physiological processes has not been widely studied so far, particularly concerning stress responses to diverse sub-optimal farming conditions. We are convinced that the biological consequences of such adaptive process to captive life can be significant and that this area of research would deserve further consideration.
Independently of any stressor exposure, domestication signifi-cantly influenced the size of the spleen as well as the abundance of several serum proteins with different roles in the acute phase response and immune defense. Firstly, a lower SSI (p ¼ 0.030) was observed in the F5 generation in comparison to the F1 counterparts at the end of the repeated hypoxia period (Fig. 5A). After the single
hypoxia experiment, a lower SSI (although not significant) was also observed in the F5 generation. Our previous study already reported significant SSI reduction with domestication level in Eurasian perch
[23]but the causes for such spleen size reduction are not currently known. The 2D-DIGE approach indicated that anserinase (spot n"538) was under-expressed in the F5 generation at the end of the
experimental period (Table 3). Anserinase is a metallodipeptidase hydrolyzing anserine to histidine and which is believed to be universally distributed in poikilothermic animals [75]. To our knowledge, there is currently no information on the biological roles of anserinase in poikilotherms. Studies mainly focus on the corre-sponding carnosine/carnosinase pathway in higher vertebrates and humans and contradictory results have been reported so far[75,76]. Domestication influenced the expression of warm temperature acclimation proteins (Wap65) present in spots n"573 and n"602
since a lower abundance was observed in the F5 fish group on day 46 (Table 3). Wap65 are glycoproteins present in plasma and liver of teleost fish and two different isoforms (Wap65-1 and Wap65-2)
have been isolated from several fish species [77,78]. Due to
sequence homology and highly conserved domains, it is suggested that teleost Wap65 proteins are homologous of mammalian hemopexin (Hpx), a plasma glycoprotein functioning as a high-affinity scavenger of free heme released from damaged/senescent
erythrocytes [78e80]. In mammals, Hpx is also an acute phase
protein induced during inflammation to sequester heme-associated iron away from bacteria[80]. It has also been proposed that Wap65 proteins might be involved in the immune response[77,78,81]. We therefore suggest that the observed down-regulation of Wap65 level in serum is not positive in the context of domestication since it can result in oxidative stress, higher iron availability for invading
Table 3
List of identified proteins differentially expressed in serum of F1 and F5 P. fluviatilis following exposure to repeated hypoxia. Spot no. Accession no.a Protein name Species Matching
Peptidesb TheoreticalpI/Mw (kDa) Fold change cbetween
treatmentsd
351 gij225056702 Transferrin Dicentrarchus labrax 2 5.9/74 1.22fin HYP vs CTL
764 gij226731843 Complement component C3 Perca flavescens 2 5.7/65 1.30ein HYP vs CTL
823 gij58373439 Complement component C3 Hippoglossus hippoglossus 2 5.7/59 % 1.37ein HYP vs CTL 629 gij150036374 Transferrin Chaenocephalus aceratus 1 6.4/74 1.37ein F5CTL vs F1CTL
926 gij6682835 Complement component C3 Paralichthys olivaceus 2 6.1/184 1.98ein F5CTL vs F1 CTL
gij58373439 Complement component C3 Hippoglossus hippoglossus 2 % 1.36ein F5HYP vs F5CTL 1.53gin F5 vs F1
556 gij225056702 Transferrin Dicentrarchus labrax 3 5.9/74 % 1.25ein F5 vs F1 538 gij76362267 Anserinase Oreochromis niloticus 3 5.4/55 % 1.53fin F5 vs F1 573 gij66267674 Warm temperature acclimation
related 65
Oryzias latipes 3 5.5/48 % 1.44gin F5 vs F1 602 gij66267674 Warm temperature acclimation
related 65 Oryzias latipes 2 5.5/48 % 1.24
ein F5 vs F1
421 gij283362240 L-amino acid oxidase Platichtys stellatus 1 5.8/58 1.13ein F5 vs F1
431 gij283362240 L-amino acid oxidase Platichtys stellatus 1 5.8/58 1.32gin F5 vs F1
944 gij146447341 Fibrinogen beta chain precursor Paralichthys olivaceus 7 6.5/56 1.22ein F5 vs F1
gij218665023 Fibrinogen beta chain precursor Larimichthys crocea 4 5.9/56
974 gij146447341 Fibrinogen beta chain precursor Paralichthys olivaceus 3 6.5/56 1.40ein F5 vs F1
243 gij6682835 Complement component C3 Paralichthys olivaceus 4 6.1/184 1.90fin F5 vs F1
gij226731843 Complement component C3 Perca flavescens 3 5.7/65
255 gij6682835 Complement component C3 Paralichthys olivaceus 4 6.1/184 2.07fin F5 vs F1
gij226731843 Complement component C3 Perca flavescens 2 5.7/65
797 gij6682835 Complement component C3 Paralichthys olivaceus 2 6.1/184 1.70fin F5 vs F1
gij58373439 Complement component C3 Hippoglossus hippoglossus 2 5.7/59 gij226731843 Complement component C3 Perca flavescens 2 5.7/65
548 gij12957116 Complement component C3 Anarhichas minor 1 6.3/186 1.26ein F5 vs F1
256 gij6682835 Complement component C3 Paralichthys olivaceus 6 6.1/184 % 2.53gin F5 vs F1 581 gij6682835 Complement component C3 Paralichthys olivaceus 6 6.1/184 % 1.24ein F5 vs F1
aNCBI database accession number.
bRefers to the number of sequenced peptides exclusively assigned to the protein. c Positive and negative values indicates up- and down-regulation respectively. dCTL, control treatment; HYP, hypoxia treatment.
ep <0.05. f p <0.01. gp <0.001.
pathogens and/or alteration of immune responses to infection. Further investigations are now needed to assess the physiological effects of Wap65 down-regulation in domesticated fish. Domesti-cation was also associated with increases inL-amino acid oxidase (LAAO) abundance (spots n"421 and 431) in the F5 individuals at
the end of the experimental period (Table 3). LAAO has been re-ported in several fish tissues (viscera, skin mucus and gills) as well as in the serum where four isoforms have already been identified in the rockfish Sebastes schegeli[82,83]. It has been reported that LAAO has antiviral, antibacterial and anti-protozoal activities in a variety of animal fluids[83,84]. In serum, it seems that LAAO exhibits a broad-spectrum antibacterial activity against both gram-positive and negative bacteria, most potently against Aeromonas spp which are common pathogen species in aquaculture facilities
[82]. Consequently, we propose that up-regulation of two serum LAAO isoforms in F5 individuals might be advantageous given the efficient role of this enzyme in bacteria killing. Changes in the abundance of fibrinogen molecules (spots n" 944 and 974) were
observed as well with respect to domestication level. Serum fibrinogen abundance was higher in F5 individuals at the end of the experimental period (Table 3). Fibrinogen is a key molecule in the blood clotting process and an acute phase protein whose plasma concentration increases in any condition that causes inflammation or tissue damage[85e87]. It has also been suggested that fibrin-ogen participates to immune function in both invertebrate and vertebrate animals [87,88]. Further investigations are needed to evaluate whether elevated fibrinogen levels positively contribute to the blood clotting process and immune defence mechanisms in domesticated fish. In the current study, domestication was associ-ated to conflicting changes in the abundance of several transferrin molecules (up-regulation of spot n"401 and down-regulation of
spot n"556), immunoglobulin heavy chains (up-regulation of spot
n"405 and down-regulation of spot n" 416) and C3 complement
components (up-regulation of spots n"243, 255, 497, 548, 797, 926
and down-regulation of spots n"256, 368, 581) (Tables 2 and 3). For
now, it is not possible to determine the physiological causes and consequences of up- and down-regulations of anserinase, Wap65 proteins, LAAO, fibrinogen, transferrin isoforms, Ig heavy chains and C3 complement components observed between F1 and F5 generations and it is indispensable to deepen our knowledge on the regulation and activity of these proteins differentially expressed in the serum of each generation.
4. Conclusions
This study demonstrated that exposure of Eurasian perch to both single and repeated environmental hypoxia induced energetic readjustments and spleen contraction (probably coming from a rapid release of spleen erythrocytes into the bloodstream) as well as immune changes in serum proteome (i.e. C3 components) following either single or repeated hypoxia. Under repeated hypoxia, data suggested the development of acclimation mecha-nisms and showed immunosuppressive effects on lysozyme activity and abundance of C3 components in serum. Domestication however did not induce marked divergence in physiological and immune responses to both single and repeated hypoxia. Indepen-dently of stressor exposure, numerous conflicting changes in the abundance of proteins related to acute phase response and innate/ specific immunity were observed according to the generational level of fish but causes and consequences are currently unknown. Further investigations are now required to support these findings and to get a more comprehensive view of how hypoxia and/or domestication affect the fish physiology and immune system. With respect to the latter, it might be interesting to test several succes-sive offsprings (e.g. F1, F2, F3, F4 and F5) to assess the progression of
physiological and immune changes from one generation to the next.
Acknowledgments
The study was supported by the National Funds for Scientific Research (FNRS) (Fellowship to J. Douxfils) and by the Funds for Collective Fundamental Reseach (FRFC) in Belgium (contract n"2.
4570.06). Thanks are due to A. Evrard from URBE, Edouard Delaive and Catherine Demazy from the URBC-Narilis for their valuable help in fish care and maintenance, proteomic analysis and in-gel trypsin digestion. The proteomic and MS facility of the URBC-Narilis is supported by the FNRS.
References
[1] Zhang Z, Ju Z, Wells MC, Walter RB. Genomic approaches in the identification of hypoxia biomarkers in model fish species. Journal of Experimental Marine Biology and Ecology 2009;381:180e7.
[2] Nikinmaa M. Haemoglobin function in vertebrates: evolutionary changes in cellular regulation in hypoxia. Respiration Physiology 2001;128:317e29. [3] Terova G, Rimoldi S, Corà S, Bernadini G, Gornati R, Saroglia M. Acute and
chronic hypoxia affects HIF-1amRNA levels in sea bass (Dicentrarchus labrax). Aquaculture 2008;279:150e9.
[4] Welker TL, Mcnulty ST, Klesius PH. Effect of sublethal hypoxia on the immune response and susceptibility of channel catfish, Ictalurus punctatus, to enteric septicemia. Journal of the World Aquaculture Society 2007;38:12e23. [5] Segner H, Sundh H, Buchmann K, Douxfils J, Sundell KS, Mathieu C, et al.
Health of farmed fish: its relation to fish welfare and its utility as welfare indicator. Fish Physiology and Biochemistry 2012;38:85e105.
[6] Ashley PJ. Fish welfare: current issues in aquaculture. Applied Animal Behaviour Science 2007;104:199e235.
[7] Binuramesh C, Prabakaran M, Steinhagen D, Michael RD. Effect of sex ration on the immune system of Oreochromis mossambicus (Peters). Brain, Behavior and Immunity 2006;20:300e8.
[8] Davis KB, Griffin BR, Gray WL. Effect of dietary cortisol on resistance of channel catfish to infection by Ichthyopthirius multifiliis and channel catfish virus disease. Aquaculture 2003;218:121e30.
[9] Dror M, Sinyakov MS, Okun E, Dym M, Sredni B, Avtalion RR. Experimental handling stress as infection-facilitating factor for the goldfish ulcerative disease. Veterinary Immunology and Immunopathology 2006;109:279e87. [10] Esteban MA, Rodriguez A, Ayala AG, Meseguer J. Effects of high doses of
cortisol on innate cellular immune response of seabream (Sparus aurata L.). General and Comparative Endocrinology 2004;137:89e98.
[11] Jentoft S, Aastveit AH, Torjesen PA, Andersen O. Effects of stress on growth, cortisol and glucose levels in non-domesticated Eurasian perch (Perca flu-viatilis) and domesticated rainbow trout (Oncorhynchus mykiss). Comparative Biochemistry and Physiology Part A 2005;141:353e8.
[12] Kollner B, Wasserrab B, Kotterba G, Fischer U. Evaluation of immune functions of rainbow trout (Oncorhynchus mykiss) - how can environmental influences be detected? Toxicology Letters 2002;131:83e95.
[13] Morgan KN, Tromborg CT. Sources of stress in captivity. Applied Animal Behaviour Science 2007;102:262e302.
[14] Pruett SB. Stress and the immune system. Pathophysiology 2003;9:133e53. [15] Trenzado CE, Carrick TR, Pottinger TG. Divergence of endocrine and metabolic
responses to stress in two rainbow trout lines selected for differing cortisol responsiveness to stress. General and Comparative Endocrinology 2003;133: 332e40.
[16] Wang S, Yuen SSF, Randall DJ, Hung CY, Tsui TKN, Poon WL, et al. Hypoxia inhibits fish spawning via LH-dependent final oocyte maturation. Compara-tive Biochemistry and Physiology Part C 2008;148:363e9.
[17] Barber I. Parasites, behaviour and welfare in fish. Applied Animal Behaviour Science 2007;104:251e64.
[18] Karvonen A, Seppala O, Valtonen ET. Parasite resistance and avoidance behaviour in preventing eye fluke infections in fish. Parasitology 2004;129: 159e64.
[19] Mignon-Grasteau S, Boissy A, Bouix J, Faure JM, Fisher AD, Hinch GN, et al. Genetics of adaptation and domestication in livestock. Livestock Production Science 2005;93:3e14.
[20] Price EO. Behavioral development in animals undergoing domestication. Applied Animal Behaviour Science 1999;65:245e71.
[21] Driscoll CA, MacDonald DW, O’Brien SJ. From wild animals to domestic pets, an evolutionary view of domestication. From the Academy - In the Light of evolution III: two Centuries of Darwin Sackler Colloquium. Proceedings of the National Academy of Sciences of the United States of America 2009;106: 9971e8.
[22] Douxfils J, Mandiki SNM, Marotte G, Wang N, Silvestre F, Milla S, et al. Does domestication process affect stress response in juvenile Eurasian perch Perca fluviatilis? Comparative Biochemistry and Physiology Part A 2011a;159:92e9.
[23] Douxfils J, Mathieu C, Mandiki SNM, Milla S, Henrotte E, Wang N, et al. Physiological and proteomic evidences that domestication process differen-tially modulates the immune status of juvenile Eurasian perch (Perca fluvia-tilis) under chronic confinement stress. Fish and Shellfish Immunology 2011b; 31:1113e21.
[24] Johnsson J, Höjesjö J, Fleming I. Behavioural and heart rate responses to predation risk in wild and domesticated Atlantic salmon. Canadian Journal of Fisheries and Aquatic Sciences 2001;58:788e94.
[25] Krejszeff S, Targo!nska K, Zarski D, Kucharczyk D. Artificial reproduction of two different spawn-forms of the chub. Reproductive Biology 2010;10:67e74. [26] Millot S, Péan S, Leguay D, Vergnet A, Chatain B, Bégout ML. Evaluation of
behavioural changes induced by a first step of domestication or selection for growth in the European sea bass (Dicentrarchus labrax): a self-feeding approach under repeated acute stress. Aquaculture 2010;306:211e7. [27] Tymchuk W, Beckman B, Devlin R. Altered expression of growth hormone/
Insulin-like growth factor I axis hormones in domesticated fish. Endocri-nology 2009;150:1809e16.
[28] Vandeputte M, Launey S. Quelle gestion génétique de la domestication chez les poisons? INRA Productions Animales 2004;17:237e42.
[29] Dorts J, Kestemont P, Dieu M, Raes M, Silvestre F. Proteomic response to sublethal cadmium exposure in a sentinel fish species, Cottus gobio. Journal of Proteome Research 2011;10:470e8.
[30] Dowd DD, Harris BN, Cech JJ, Kültz D. Proteomic and physiological responses of leopard sharks (Triakis semifasciata) to salinity change. The Journal of Experimental Biology 2010;213:210e24.
[31] Bosworth CA, Chou CW, Cole RB, Rees BB. Protein expression patterns in zebrafish skeletal muscle: initial characterization and the effects of hypoxic exposure. Proteomics 2005;5:1362e71.
[32] Salas-Leiton E, Canovas-Conesa B, Zerolo R, Lopez-Barea J, Canavate JP, Alhama J. Proteomics of juvenile Senegal Sole (Solea senegalensis) affected by gas bubble disease in hyperoxygenated ponds. Marine Biotechnology 2009; 11:473e87.
[33] Smith RW, Cash P, Ellefsen S, Nilsson GE. Proteomic changes in the crucian carp brain during exposure to anoxia. Proteomics 2009;9:2217e29. [34] Mairesse G, Thomas M, Gardeur J-N, Brun-Bellut J. Effects of dietary factors,
stocking biomass and domestication on the nutritional and technological quality of the Eurasian perch Perca fluviatilis. Aquaculture 2007;262:86e94. [35] Atawa S, Tsuruta T, Yada T, Iguchi K. Effects of suspended sediment on cortisol
levels in wild and cultures strains of ayu Plecoglossus altivelis. Aquaculture 2011;314:115e21.
[36] Zuberi A, Ali S, Brown C. A non-invasive assay for monitoring stress responses: a comparison between wild and captive-reared rainbowfish (Melanoteania duboulayi). Aquaculture 2011;321:267e72.
[37] Nesbo CL, Fossheim T, Vollestad LA, Jakobsen KS. Genetic divergence and phylogeographic relationships among European perch (Perca fluviatilis) pop-ulations reflect glacial refugia and postglacial colonization. Molecular Ecology 1999;8:1397e404.
[38] Trinder P. Determination of glucose in blood using a glucose oxidase with an alternative oxygen acceptor. Annals of Clinical Biochemistry 1969;6:24e5. [39] Siwicki A, Studnicka M. The phagocytic ability of neutrophils and serum
lysozyme activity in experimentally infected carp, Cyprinus carpio L. The Journal of Fish Biology 1987;31:57e60.
[40] Fatima M, Mandiki SNM, Douxfils J, Silvestre F, Coppe P, Kestemont P. Combined effects of herbicides on biomarkers reflecting immune-endocrine interactions in goldfish: immune and antioxidant effects. Aquatic Toxicology 2007;81:159e67.
[41] Sunyer JO, Tort L. Natural haemolytic and bactericidal activities of sea bream Sparus aurataserum effected by alternative complement pathway. Veterinary Immunology and Immunopathology 1995;45:333e45.
[42] Milla S, Mathieu C, Wang N, Lambert S, Nadzialek S, Massart S, et al. Spleen immune status is affected after acute handling stress but not regulated by cortisol in Eurasian perch, Perca fluviatilis. Fish and Shellfish Immunology 2010;28:931e41.
[43] Keller A, Nesvizhskii AI, Kolker E, Aebersold R. Empirical statistical model to estimate the accuracy of peptide identifications made by MS/MS and database search. Analytical Chemistry 2002;74:5383e92.
[44] Nesvizhskii AI, Keller A, Kolker E, Aebersold R. A statistical model for identi-fying proteins by tandem mass spectrometry. Analytical Chemistry 2003;75: 4646e58.
[45] Acerete L, Balasch JC, Espinosa E, Josa A, Tort L. Physiological responses in Eurasian perch (Perca fluviatilis, L.) subjected to stress by transport and handling. Aquaculture 2004;237:167e78.
[46] Muusze B, Marcon J, van den Thillart G, Almeida-Val V. Hypoxia tolerance of Amazon fish respirometry and energy metabolism of the cichlid Astronotus Ocellatus. Comparative Biochemistry and Physiology Part A 1998;120:151e6. [47] Lays N, Iversen MMT, Frantzen M, Jorgensen EH. Physiological stress responses in spotted wolfish (Anarhichas minor) subjected to acute distur-bance and progressive hypoxia. Aquaculture 2009;295:126e33.
[48] Maxime V, Nonnotte G, Peyraud C, Williot P, Truchot JP. Circulatory and respiratory effects of an hypoxic stress in the Siberian sturgeon. Respiration Physiology 1995;100:203e12.
[49] Pichavant K, Maxime V, Thébault MT, Ollivier H, Garnier JP, Bousquet B, et al. Effects of hypoxia and subsequent recovery on turbot Scophtalmus maximus: hormonal changes and anaerobic metabolism. Marine Ecology Progress Series 2002;225:275e85.
[50] Reid SG, Bernier NJ, Perry ST. The adrenergic stress response in fish: control of catecholamine storage and release. Comparative Biochemistry and Physiology Part C 1998;120:1e27.
[51] Rimoldi S, Terova G, Ceccuzzi P, Marelli S, Antonini M, Saroglia M. HIF-1a
mRNA levels in Eurasian perch (Perca fluviatilis) exposed to acute and chronic hypoxia. Molecular Biology Reports 2012;39:4009e15.
[52] Chabot D, Claireaux G. Environmental hypoxia as a metabolic constraint on fish: the case of Atlantic cod, Gadus morhua. Marine Pollution Bulletin 2008; 57:287e94.
[53] Routley MH, Nilsson GE, Renshaw GMC. Exposure to hypoxia primes the respiratory and metabolic responses of the epaulette shark to progressive hypoxia. Comparative Biochemistry and Physiology Part A 2002; 131:313e21.
[54] Lushchak VI, Bagnyukova TV, Lushchak OV, Storey JM, Storey KB. Hypoxia and recovery perturb free radical processes and antioxidant potential in common carp (Cyprinus carpio) tissues. The Internal Journal of Biochemistry and Cell Biology 2005;37:1319e30.
[55] Wells RMG, Baldwin J. Plasma lactate and glucose flushes following burst swimming in silver trevally (Pseudocaranx dentex: Carangidae) support the “releaser” hypothesis. Comparative Biochemistry and Physiology Part A 2006; 143:347e52.
[56] Dalla Via J, van den Thillart G, Catan O, Cortesi P. Environmental versus functional hypoxia/anoxia in sole Solea solea: the lactate paradox revisited. Marine Ecology Progress Series 1997;154:79e90.
[57] Kita J, Itazawa Y. Release of erythrocytes from the spleen during exercise and splenic constriction by adrenaline infusion in the rainbow trout. Japanese Journal of Ichtyology 1989;36:48e52.
[58] Yamamoto K, Itazawa Y, Kobayashi H. Direct observation of fish spleen by an abdominal window method and its application to exercised and hypoxic Yellowtail. Japanese Journal of Ichtyology 1985;31:428e33.
[59] Affonso EG, Polez VLP, Correa CF, Mazon AF, Araujo MRR, Moraes G, et al. Blood parameters and metabolites in the teleost fish Colossoma macropomum exposed to sulfide or hypoxia. Comparative Biochemistry and Physiology Part C 2002;133:375e82.
[60] Israeli D, Kimmel E. Monitoring the behaviour of hypoxia-stressed Carassius auratus using computer vision. Aquacultural Engineering 1996;15:423e40. [61] Wu RSS. Hypoxia: from molecular responses to ecosystem responses. Marine
Pollution Bulletin 2002;45:35e45.
[62] Boshra H, Li J, Sunyer JO. Recent advances on the complement system of teleost fish. Fish and Shellfish Immunology 2006;20:239e62.
[63] Holland MCH, Lambris JD. The complement system in teleosts. Fish and Shellfish Immunology 2002;12:399e420.
[64] Zarkadis IK, Sarrias MR, Sfyroera G, Sunyer JO, Lambris JD. Cloning and structure of three rainbow trout C3 molecules: a plausible explanation for their functional diversity. Developmental & Comparative Immunology 2001; 25:11e24.
[65] Janssen BJC, Gros P. Structural insights into the central complement compo-nent C3. Molecular Immunology 2007;44:3e10.
[66] Lambris JD, Lao Z, Pang J, Alsenz J. Third component of Trout complement. The Journal of Immunology 1993;151:6123e34.
[67] Barton BA. Stress in fishes: a diversity of responses with particular reference to changes in circulating corticosteroids. Integrative and Comparative Biology 2002;42:517e22.
[68] Cyr NE, Romero LM. Identifying hormonal habituation in filed studies of stress. General and Comparative Endocrinology 2009;161:295e303. [69] Rolfs A, Kvietikova I, Gassmann M, Wenger RH. Oxygen-regulated transferrin
expression is mediated by hypoxia-inducible factor-1. The Journal of Biolog-ical Chemistry 1997;272:20055e62.
[70] Chepelev NL, Willmore WG. Regulation of iron pathways in response to hypoxia. Free Radical Biology and Medicine 2011;50:645e66.
[71] Liu H, Takano T, Abernathy J, Wang S, Sha Z, Jiang Y, et al. Structure and expression of transferrin gene of channel catfish, Ictalurus punctatus. Fish and Shellfish Immunology 2010;28:159e66.
[72] Bayne CJ, Gerwick L. The acute phase response and innate immunity of fish. Developmental and Comparative Immunology 2001;25:725e43.
[73] Barcellos LJG, Kreutz LC, de Souza C, Rodrigues LB, Fioreze I, Quevedo RM, et al. Hematological changes in jundia (Rhamdia quelen Quoy and Gaimard Pimelodidae) after acute and chronic stress caused by usual aquacultural management, with emphasis on immunosuppressive effects. Aquaculture 2004;237:229e36.
[74] Binuramesh C, Prabakaran M, Steinhagen D, Michael RD. Effect of chronic confinement stress on the immune responses in different sex ration groups of Oreochromis mossambicus(Peters). Aquaculture 2005;250:47e59.
[75] Yamada S, Tanaka Y, Ando S. Purification and sequence identification of anserinase. The FEBS Journal 2005;272:6001e13.
[76] Yamada S, Kawashima K, Baba K, Oku T, Ando S. Occurrence of a novel acetylated amino acid, Na-acetylhistidine, in skeletal muscle of freshwater fish and other ectothermic vertebrates. Comparative Biochemistry and Physiology Part B 2009;152:282e6.
[77] Sarropoulou E, Fernandes JMO, Mitter K, Magoulas A, Mulero V, Sepulcre MP, et al. Evolution of a multifunctional gene: the warm temperature acclimation protein Wap65 in the European seabass Dicentrarchus labrax. Molecular Phylogenetics and Evolution 2010.
[78] Sha Z, Xu P, Takano T, Liu H, Terhune J, Liu Z. The warm temperature accli-mation protein Wap65 as an immune response gene: its duplicates are
differentially regulated by temperature and bacterial infections. Molecular Immunology 2008;45:1458e69.
[79] Delanghe JR, Langlois MR. Hemopexin: a review of biological aspects and the role in laboratory medicine. Clinica Chimica Acta 2001;312:13e23. [80] Dooley H, Buckingham EB, Criscitiello MF, Flajnik MF. Emergence of the
acute-phase protein hemopexin in jawed vertebrates. Molecular Immunology 2010; 48:147e52.
[81] Kikuchi K, Watabe S, Aida K. The Wap65 gene expression of goldfish (Carassius auratus) in association with warm temperature as well as bacterial lipo-polysaccharide (LPS). Fish Physiology and Biochemistry 1997;17:423e32. [82] Kitani Y, Ishida M, Ishizaki S, Hagashima Y. Discovery of serum L-amino acid
oxidase in the rockfish Sebastes schlegeli: isolation and biochemical charac-terization. Comparative Biochemistry and Physiology Part B 2010;157:351e6. [83] Wang F, Li R, Xie M, Li A. The serum of rabbitfish (Siganus oramin) has anti-microbial activity to some pathogenic organisms and a novel serum L-amino acid oxidase is isolated. Fish and Shellfish Immunology 2011;30:1095e108.
[84] Kitani Y, Kikuchi N, Zhang G, Ishizaki S, Shimakura K, Shiomi K, et al. Anti-bacterial action of L-amino acid oxidase from the skin mucus of the rockfish Sebastes schlegelii. Comparative Biochemistry and Physiology Part B 2008;149: 394e400.
[85] Ferrer-Antunes C, de Maat MPM, Palmeiro A, Pimentel J, Fernandes V. Asso-ciation between polymorphisms in the fibrinogenaandb-genes on the post-trauma fibrinogen increase. Thrombosis Research 1998;92:207e12. [86] Rezaee F, Maas A, De Maat MPM, Verheijen JH, Koopman J. Effect of genetic
background and diet on plasma fibrinogen in mice. Possible relation with susceptibility to atherosclerosis. Atherosclerosis 2002;164:37e44. [87] Xie FJ, Zhang ZP, Lin P, Wang SH, Zou ZH, Wang YL. Identification of immune
responsible fibrinogen beta chain in the liver of large yellow croaker using modified annealing control primer system. Fish and Shellfish Immunology 2009;27:202e9.
[88] Gentry PA. Comparative aspects of blood coagulation. The Veterinary Journal 2004;168:238e51.