HAL Id: hal-01468767
https://hal-amu.archives-ouvertes.fr/hal-01468767
Submitted on 22 Feb 2017
HAL is a multi-disciplinary open access
archive for the deposit and dissemination of sci-entific research documents, whether they are pub-lished or not. The documents may come from teaching and research institutions in France or abroad, or from public or private research centers.
L’archive ouverte pluridisciplinaire HAL, est destinée au dépôt et à la diffusion de documents scientifiques de niveau recherche, publiés ou non, émanant des établissements d’enseignement et de recherche français ou étrangers, des laboratoires publics ou privés.
Combination of an optical parametric oscillator and
quantum-dots 655 to improve imaging depth of
vasculature by intravital multicolor two- photon
microscopy References and links
Clément Ricard, Lisa Lamasse, Alexandre Jaouen, Geneviève Rougon, Franck
Debarbieux
To cite this version:
Clément Ricard, Lisa Lamasse, Alexandre Jaouen, Geneviève Rougon, Franck Debarbieux. Combina-tion of an optical parametric oscillator and quantum-dots 655 to improve imaging depth of vasculature by intravital multicolor two- photon microscopy References and links. Biomedical optics express, Op-tical Society of America - OSA Publishing, 2016, �10.1364/BOE.7.002362�. �hal-01468767�
Combination of an optical parametric oscillator
and quantum-dots 655 to improve imaging depth
of vasculature by intravital multicolor
two-photon microscopy
Clément Ricard,1,2,3,4,5 Lisa Lamasse,1,2,5 Alexandre Jaouen,1,2 Geneviève Rougon,1,2 and Franck Debarbieux1,2,*
1Institut des Neurosciences de la Timone, Marseille, Aix-Marseille Université and CNRS UMR7289, France 2Centre Européen de Recherche en Imagerie Médicale, Aix-Marseille Université, Marseille, France
3Service de Pharmacie, Assistance Publique, Hôpitaux de Marseille, Marseille, France
4Centre de Recherche en Oncobiologie et Oncopharmacologie, INSERM UMR911 and Aix-Marseille Université, Marseille, France
5These authors contributed equally to this work
*franck.debarbieux@univ-amu.fr
Abstract: Simultaneous imaging of different cell types and structures in the
mouse central nervous system (CNS) by intravital two-photon microscopy requires the characterization of fluorophores and advances in approaches to visualize them. We describe the use of a two-photon infrared illumination generated by an optical parametric oscillator (OPO) on quantum-dots 655 (QD655) nanocrystals to improve resolution of the vasculature deeper in the mouse brain both in healthy and pathological conditions. Moreover, QD655 signal can be unmixed from the DsRed2, CFP, EGFP and EYFP fluorescent proteins, which enhances the panel of multi-parametric correlative investigations both in the cortex and the spinal cord.
References and links
1. W. Denk, J. H. Strickler, and W. W. Webb, “Two-photon laser scanning fluorescence microscopy,” Science
248(4951), 73–76 (1990).
2. S. W. Perry, R. M. Burke, and E. B. Brown, “Two-photon and second harmonic microscopy in clinical and translational cancer research,” Ann. Biomed. Eng. 40(2), 277–291 (2012).
3. K. K. Fenrich, P. Weber, G. Rougon, and F. Debarbieux, “Long- and short-term intravital imaging reveals differential spatiotemporal recruitment and function of myelomonocytic cells after spinal cord injury,” J. Physiol. 591(19), 4895–4902 (2013).
4. C. Ricard, F. Stanchi, T. Rodriguez, M. C. Amoureux, G. Rougon, and F. Debarbieux, “Dynamic quantitative intravital imaging of glioblastoma progression reveals a lack of correlation between tumor growth and blood vessel density,” PLoS One 8(9), e72655 (2013).
5. A. Ustione and D. W. Piston, “A simple introduction to multiphoton microscopy,” J. Microsc. 243(3), 221–226 (2011).
6. F. Helmchen and W. Denk, “Deep tissue two-photon microscopy,” Nat. Methods 2(12), 932–940 (2005). 7. L. von Baumgarten, D. Brucker, A. Tirniceru, Y. Kienast, S. Grau, S. Burgold, J. Herms, and F. Winkler, “Bevacizumab has differential and dose-dependent effects on glioma blood vessels and tumor cells,” Clin. Cancer Res. 17(19), 6192–6205 (2011).
8. F. Winkler, Y. Kienast, M. Fuhrmann, L. Von Baumgarten, S. Burgold, G. Mitteregger, H. Kretzschmar, and J. Herms, “Imaging glioma cell invasion in vivo reveals mechanisms of dissemination and peritumoral
angiogenesis,” Glia 57(12), 1306–1315 (2009).
9. C. Ricard, M. Fernández, J. Gastaldo, L. Dupin, L. Somveille, R. Farion, H. Requardt, J.-C. Vial, H. Elleaume, C. Segebarth, and B. van der Sanden, “Short-term effects of synchrotron irradiation on vasculature and tissue in healthy mouse brain,” J. Synchrotron Radiat. 16(4), 477–483 (2009).
10. N. C. Shaner, P. A. Steinbach, and R. Y. Tsien, “A guide to choosing fluorescent proteins,” Nat. Methods 2(12), 905–909 (2005).
11. C. Ricard and F. C. Debarbieux, “Six-color intravital two-photon imaging of brain tumors and their dynamic microenvironment,” Front. Cell. Neurosci. 8, 57 (2014).
12. P. Mahou, M. Zimmerley, K. Loulier, K. S. Matho, G. Labroille, X. Morin, W. Supatto, J. Livet, D. Débarre, and E. Beaurepaire, “Multicolor two-photon tissue imaging by wavelength mixing,” Nat. Methods 9(8), 815–818 (2012).
13. P. Vérant, R. Serduc, B. van der Sanden, R. Chantal, C. Ricard, J. A. Coles, and J.-C. Vial, “Subtraction method for intravital two-photon microscopy: intraparenchymal imaging and quantification of extravasation in mouse brain cortex,” J. Biomed. Opt. 13(1), 011002 (2008).
14. O. Mashinchian, M. Johari-Ahar, B. Ghaemi, M. Rashidi, J. Barar, and Y. Omidi, “Impacts of quantum dots in molecular detection and bioimaging of cancer,” Bioimpacts 4(3), 149–166 (2014).
15. K. K. Fenrich, P. Weber, M. Hocine, M. Zalc, G. Rougon, and F. Debarbieux, “Long-term in vivo imaging of normal and pathological mouse spinal cord with subcellular resolution using implanted glass windows,” J. Physiol. 590(16), 3665–3675 (2012).
16. C. Ricard, F. Stanchi, G. Rougon, and F. Debarbieux, “An orthotopic glioblastoma mouse model maintaining brain parenchymal physical constraints and suitable for intravital two-photon microscopy,” J. Vis. Exp. 86(86), e51108 doi:10.3791/51108 (2014).
17. G. Feng, R. H. Mellor, M. Bernstein, C. Keller-Peck, Q. T. Nguyen, M. Wallace, J. M. Nerbonne, J. W. Lichtman, and J. R. Sanes, “Imaging neuronal subsets in transgenic mice expressing multiple spectral variants of GFP,” Neuron 28(1), 41–51 (2000).
18. N. Faust, F. Varas, L. M. Kelly, S. Heck, and T. Graf, “Insertion of enhanced green fluorescent protein into the lysozyme gene creates mice with green fluorescent granulocytes and macrophages,” Blood 96(2), 719–726 (2000).
19. K. Bulloch, M. M. Miller, J. Gal-Toth, T. A. Milner, A. Gottfried-Blackmore, E. M. Waters, U. W. Kaunzner, K. Liu, R. Lindquist, M. C. Nussenzweig, R. M. Steinman, and B. S. McEwen, “CD11c/EYFP transgene
illuminates a discrete network of dendritic cells within the embryonic, neonatal, adult, and injured mouse brain,” J. Comp. Neurol. 508(5), 687–710 (2008).
20. C. Prodinger, J. Bunse, M. Krüger, F. Schiefenhövel, C. Brandt, J. D. Laman, M. Greter, K. Immig, F. Heppner, B. Becher, and I. Bechmann, “CD11c-expressing cells reside in the juxtavascular parenchyma and extend processes into the glia limitans of the mouse nervous system,” Acta Neuropathol. 121(4), 445–458 (2011). 21. K. K. Fenrich, P. Weber, G. Rougon, and F. Debarbieux, “Implanting glass spinal cord windows in adult mice
with experimental autoimmune encephalomyelitis,” J. Vis. Exp. 82(82), e50826 doi:10.3791/50826 (2013). 22. V. Ntziachristos, “Going deeper than microscopy: the optical imaging frontier in biology,” Nat. Methods 7(8),
603–614 (2010).
23. L. Tang, R. Ji, X. Li, K. Seng Teng, and S. Ping Lau, “Energy-level structure of nitrogen-doped graphene quantum dots,” J. Mater. Chem. C Mater. Opt. Electron. Devices 1(32), 4908–4915 (2013).
24. K. König, “Multiphoton microscopy in life sciences,” J. Microsc. 200(2), 83–104 (2000).
25. H. Hama, H. Kurokawa, H. Kawano, R. Ando, T. Shimogori, H. Noda, K. Fukami, A. Sakaue-Sawano, and A. Miyawaki, “Scale: a chemical approach for fluorescence imaging and reconstruction of transparent mouse brain,” Nat. Neurosci. 14(11), 1481–1488 (2011).
26. K. Chung, J. Wallace, S.-Y. Kim, S. Kalyanasundaram, A. S. Andalman, T. J. Davidson, J. J. Mirzabekov, K. A. Zalocusky, J. Mattis, A. K. Denisin, S. Pak, H. Bernstein, C. Ramakrishnan, L. Grosenick, V. Gradinaru, and K. Deisseroth, “Structural and molecular interrogation of intact biological systems,” Nature 497(7449), 332–337 (2013).
27. A. d’Esposito, D. Nikitichev, A. Desjardins, S. Walker-Samuel, and M. F. Lythgoe, “Quantification of light attenuation in optically cleared mouse brains,” J. Biomed. Opt. 20(8), 080503 (2015).
28. S. Balamurugan, A. Agrawal, Y. Kato, and H. Sano, “Intra operative indocyanine green video-angiography in cerebrovascular surgery: An overview with review of literature,” Asian J. Neurosurg. 6(2), 88–93 (2011). 29. J. Herz, V. Siffrin, A. E. Hauser, A. U. Brandt, T. Leuenberger, H. Radbruch, F. Zipp, and R. A. Niesner, “Expanding two-photon intravital microscopy to the infrared by means of optical parametric oscillator,” Biophys. J. 98(4), 715–723 (2010).
30. S. Paris-Robidas, D. Brouard, V. Emond, M. Parent, and F. Calon, “Internalization of targeted quantum dots by brain capillary endothelial cells in vivo,” J. Cereb. Blood Flow Metab. (Nihongoban) 2015, 0271678X (2015).
1. Introduction
Over the past 25 years [1], two-photon microscopy (2PM) has become a gold standard for various biomedical studies [2–4]. This imaging method allows in-depth imaging at a micrometric scale with reduced photobleaching because of the use of more favorable excitation wavelength of the fluorophores and a photobleaching confined to the spatially limited micrometric focal volume below the objective [5, 6].
Until the beginning of the decade, 2PM-generated fluorescent signals were collected on one or two external non-descanned detectors (NDD) restricting the simultaneous observation of differentially labeled structures [7–9]. However, integrative biological studies require to visualize and track various structures and cell populations. The main challenges toward this goal are: 1) adding multiple NDDs with suited band pass filters or ultimately using detector arrays to acquire and analyze photons over the whole spectrum, 2) labeling cells of interest by transgenic expression of new fluorescent proteins with non-overlapping emission spectra
[10], 3) finding optimal excitation strategies to reveal the fluorescence of all markers [11, 12]. Used in combination, these approaches have allowed the rise of multicolor intravital 2PM and we reported the observation of up to 6 different structures in the living animal [11].
In this context, tridimensional vascular structures were described in the living animal by combining intravenous injections of various fluorescent dyes [13] with acquisition of z-stack of images. The anatomy of small vessels and capillaries could thus be studied in physiological and pathological conditions.
Whereas fluorescein or rhodamine-derived molecules are among the most common dyes used to highlight blood vessels [9, 13], their emission spectra mainly overlap with the ones of green (GFP) or red (RFP) fluorescent proteins which impedes the simultaneous visualization of several cell populations or cellular compartments. Although blue-emitting dyes such as cascade-blue could in principle represent an alternative, blue photons are quickly absorbed by tissues and are not suitable for in-depth imaging [11]. Instead, vascular dyes emitting in the deep-red range have to be considered to improve in depth imaging and color multiplexing. In this prospect, quantum-dots are promising tools. Quantum-dots 655 (QD655) exhibit strong fluorescence, have an emission spectrum centered around 655nm and a broad red-shifted excitation spectrum. They present low toxicity, reduced photobleaching thus are suitable both for in depth and multicolor imaging since emission is not overlapping with the majority of green fluorescent proteins variants used in intravital studies. Moreover, their use is particularly well suited for longitudinal studies of neuroinflammatory reactions since they have a polyethyleneglycol (PEG) surface coating that minimizes immune reaction [14] and, contrary to fluorescent dextrans they do not accumulate into macrophages [15].
To perform microangiographic imaging of the central nervous system (CNS) we have evaluated the added value of optimal excitation of QD655 using infrared wavelengths generated by pumping an optical parametric oscillator (OPO) with a Titanium:Sapphire femtosecond laser. Having established the excitation spectrum of QD655 by NLO (720 to 1040nm) and OPO (1050 to 1300nm), we report a two-fold improvement of QD655 fluorescence signal for excitation at 1050nm instead of 800nm. We show that the increased excitation efficacy combined with the reduced scattering of red shifted photons in the CNS parenchyma translates into a two-fold improvement of the imaging depth along with an improved spatial resolution. We also illustrate that for multicolor imaging protocols, 1050nm excitation allows for simultaneous excitation of Enhanced Yellow Fluorescent Protein (EYFP) or DsRed labeled objects usefully complementing investigations at 800nm on multicolor Cyan Fluorescent Protein (CFP) and Enhanced Green Fluorescent Protein (EGFP) transgenic animals.
2. Methods
2.1 Two-photon microscopy setup
Acquisitions were realized on a Zeiss LSM 780 two-photon microscope home-modified to allow animal positioning below the 20X/1.0NA water immersion objective (W-Plan-Apochromat, 421452-9600, Zeiss). The microscope is coupled to a Titanium:Sapphire tunable laser (NLO; Repetition rate: 80MHz ; Pulse width: 140fs ; Ultra 2 Chameleon, Coherent) that pumps an optical parametric oscillator (OPO ; Repetition rate: 80MHz ; Pulse width: 200fs ; Chameleon Compact OPO-Vis, Coherent). Fluorescent signals were epicollected and separated by a set of dichroic mirrors and filters on 5 independent non-descanned detectors (NDD1: 605-678nm; NDD2: 390-485nm; NDD3: 500-520nm; NDD4: 520-549 and NDD5: 555-605nm). For spectral imaging, fluorescent signals were collected on a 32 channel spectral detector in a descanned mode. Image acquisition was performed under the Zeiss ZEN 2012 software and image processing was carried under the open-source FIJI and ICY software. 2.2 Excitation spectra measurements
Five microliters of a QD655 solution (QTracker 655, Molecular Probes; 8µl in 50 μl of PBS qsp) were mounted on a coverslip and excited under an NLO (720-1040nm, λ-space = 10nm)
or an OPO excitation (1050-1300nm, pump:800nm, λ-space = 20nm). For each wavelength, the intensity of the fluorescent emission signal was collected on the 5 NDDs and quantified. The background values were quantified and subtracted from the collected fluorescent signal. As the laser power delivered is linked to the wavelength, the laser power was measured by a power-meter (Coherent) at each wavelength. Fluorescent intensity measurements were then normalized to the laser power.
2.3 Spectral imaging
GL261 murine glioma cells expressing DsRed2 (plasmid: pDsRed2-N1, Clontech,Mountain View, USA) were cultured as previously described [11, 16] on glass-bottom Petri dishes. Five microliters of a QD655 solution (QTracker 655, Molecular Probes; 8µl in 50 μl of PBS qsp) were added and images were acquired successively under an 800nm NLO excitation and a 1050nm OPO excitation with the same laser power. Fluorescence signals were collected from 411 to 696nm on a descanned 32-channel spectral detector with a λ-space of 8.9nm. Spectral deconvolution was performed under the Zeiss Zen 2012 software.
2.4 Animal care guidelines and transgenic animals
All experimental procedures were performed in accordance with the French legislation and in compliance with the European Community Council Directive of November 24, 1986 (86/609/EEC) for the care and use of laboratory animals. The research on animals was authorized by the Direction Départementale des Services Vétérinaires des Bouches-du-Rhône (license D-13-055-21) and approved by the National Committee for Ethic in Animal Experimentation (SectionN◦14; project 87-04122012). N = 11 mice were used for this study. Triple transgenic animals (Thy1-CFP neurons [17]; LysM-EGFP: neutrophils and monocytes [18]; CD11c-EYFP: microglial subpopulation and dendritic cells [19, 20]) were used for multicolor 2P experiments.
2.5. Brain animal model
The detailed surgical protocol was described in detail in Ricard et al. [16]. Briefly, adult mice (>7 weeks) were anaesthetized by an intraperitoneal injection of a mixture of Xylazine/Ketamine (10mg/kg and 100mg/kg, respectively) and positioned on a stereotactic frame. A 3–4mm diameter craniotomy was performed on the left parietal bone. The removed bone was replaced by a round glass coverslip that was sealed on the adjacent bone and fixed to the skull by dental cement. Animals were allowed to recover for 15 days post-surgery before the first imaging session. For the inflamed model, the dura-mater was incised by a 31G needle and a 250μm spheroid of GL261 cells was injected into the cerebral cortex approximately 250μm below the brain surface. A Sephadex hemi-bead with a diameter that fits through the dura-mater opening was inserted in the injection wound and glued using histocompatible acrylic glue (Cyanolit). The removed bone was then replaced by a glass coverslip as described above.
2.6 Spinal cord animal model
The detailed surgical protocol was described in detail in Fenrich et al. [15, 21]. Briefly, a laminectomy was carried out on T13 and L1 vertebrae using a high-speed drill (Dremel) with a carbide bur. The lateral edges of the vertebral openings were shaped to receive a glass window laying flat relative to the spinal cord. Kwik-Sil (World Precision Instruments) was squeezed between the glass and the dura mater to stabilize the preparation and prevent the formation of cicatricial tissue between the window and spinal cord. Window was sealed to the vertebrae with a layer of dental cement.
2.7 Animal imaging procedures
Prior to each imaging session, mice were anaesthetized by an intraperitoneal injection of a mixture of Xylazine/Ketamine (10mg/kg and 100mg/kg, respectively). The animals were then intravenously injected with a QD655 solution (QTracker 655, Molecular Probes; 8μl in 50 μl
PBS qsp), Rhodamine dextran 70kDa (Sigma Aldrich, 100µl at 20mg/ml in PBS) or Texas-red dextran 70kDa (Sigma Aldrich, 100µl at 20mg/ml in PBS) and positioned on an appropriate frame. Each imaging session, including anesthesia induction, animal positioning and acquisition lasted approximately 1.5 h.
2.8 Intravital measurements and image processing
For each mouse, images were acquired from 0 to 500µm below the surface of the brain with a 2µm z-spacing. Fluorescence intensity on NDD1 was measured in the same regions of interest in the blood vessels under an 800nm or 940nm NLO excitation and was compared to the intensity measured in the same area under excitation by a 1050nm OPO beam. Mean background fluorescence was measured and subtracted from the intensity measured in blood vessels. Laser power applied was the same for NLO and OPO excitations and was linearly increased with regard to imaging depth.
For spinal cord observations, images were acquired from 0 to 240µm below the dura-mater with a 2.5µm z-spacing.
Power of the laser was varied from 1 mW to its maximal possible value on our system (530 mW at 800nm and 212 mW at 1050nm, measurements done at the objective).
2.9 Statistics
All statistical analysis were performed under GraphPad Prism 6. Values are mean ± standard error of the mean (SEM).
3. Results
3.1 Comparison of QD655 excitation by OPO and NLO
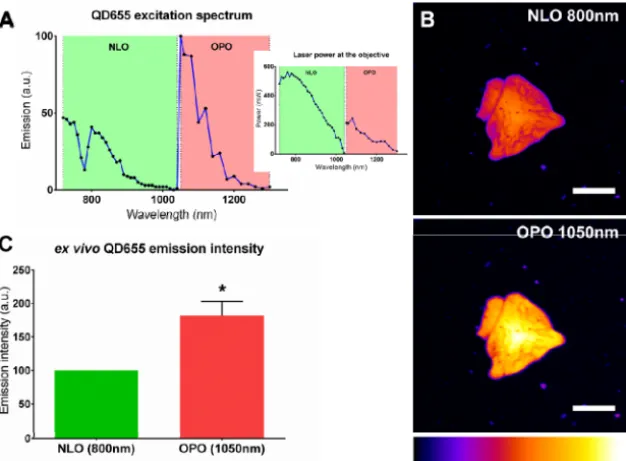
QD655 excitation spectrum was characterized directly from a small volume of injectable solution under a NLO (720-1040nm) and OPO (1050-1300nm) excitation. OPO excitation was up to twice more efficient than NLO excitation and presented a peak at 1050nm (Fig. 1(A)). For the rest of the experiments, we have thus chosen to compare images acquired under an 800nm NLO excitation with images acquired under a 1050nm OPO excitation. The rationale behind this choice was that 800nm is the excitation peak for QD655 under a NLO excitation and that 800nm is the OPO optimal pump wavelength to obtain a beam tunable in between 1050 to 1300nm. QD655 were observed under the 2 excitation modalities (NLO vs. OPO) at similar laser power (Fig. 1(B)). The intensity of the emission signal was quantified and OPO excitation was 1.81 ± 0.22 times more efficient than NLO (Fig. 1(C)).
Fig. 1. QD655 are better excited by an OPO. (A). QD655 two-photon excitation spectrum under a NLO (green, 720-1040nm) and an OPO (red, 1050-1300nm) excitation. Signal was collected on the 5 NDDs and spectrum was normalized to laser power. Inset: laser power at the output of the objective. (B). Cluster of QD655 imaged under an 800nm NLO (top) or 1050nm OPO (bottom) excitation. Signal was collected on the 605-678 NDD (NDD1). Scale-bars: 25µm. (C). Emission intensity of QD655 coated on a glass coverslip and excited by an 800nm NLO (green) or 1050nm OPO (red) excitation. Emission was normalized at 100 for NLO excitation. *: p = 0.0003, Wilcoxon signed rank test.
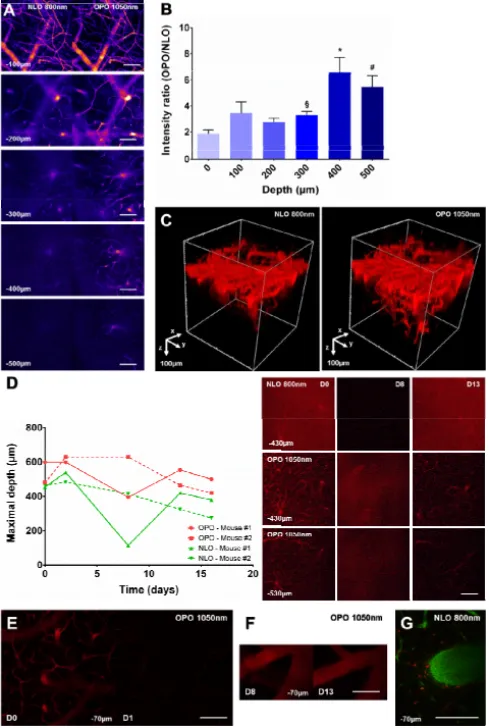
3.2 Increase of the maximal imaging depth of OPO excited QD655 in adult mouse cortex To determine the relative efficiency of QD655 excitation by an 800nm NLO versus a 1050nm OPO source in intravital conditions, we have observed at different depths the brain of living mice intravenously injected with QD655 and bearing a cranial glass window. Images acquired from 0 to 500µm below the brain surface showed that fluorescent signals in blood vessels elicited by a 1050nm OPO excitation were qualitatively of higher intensity than those elicited by an 800nm NLO excitation (Fig. 2(A)). Quantitative measurements highlighted that OPO excitation was 1.87 ± 0.29x more efficient than NLO at the surface, as already observed in culture (1.81 ± 0.22x, Fig. 1(C)). Interestingly, OPO mediated improvement of the fluorescence signal was further amplified deeper in the brain. The gain of intensity was 3.29 ± 0.29x at z = 300µm and raised above 5 between z = 400 and 500µm (6.64 ± 1.07x and 5.47 ± 0.86x, respectively) (Fig. 2(B)). This translated into a two-fold increase of the imaging depth as visible from the tridimensional reconstructions of the vascular tree (Fig. 2(C)). This OPO dependent increase was robust and observed at all time points throughout repeated imaging sessions over 2 weeks on the same animal (Fig. 2(D)). Fluctuations of the maximal imaging depth were nevertherless observed across animals and over time, a minimum being achieved at the peak of postsurgical inflammation. At the end of the inflammatory burst, imaging depth did not recover its initial value due to variable amount of cicatricial tissue development in the animals. Noteworthy, QD655 did not accumulate in macrophages despite repeated intravenous injections, avoiding the progressive accumulation of fluorescence observed in the meningeal macrophages after Rhodamine dextran injections (Fig. 2(E)-2(G)).
Improved depth penetration was accompanied by an improvement of the xy spatial resolution (Fig. 2(A)). Such images confirmed that QD655 are more efficiently excited by a 1050nm OPO illumination, and that this effect is further magnified at depth due to the larger mean free path for long wavelength excitation photons [22].
Fig. 2. OPO is more efficient than NLO to excite QD655 in the healthy mouse brain and it increases the maximal achievable imaging depth. (A). Images taken at various depths (100 to 500µm below the dura-mater) under an 800nm NLO or 1050nm OPO excitation in the same region of interest in the brain of a living mouse intravenously injected with a solution of QD655. (B). QD655 signal intensity ratio (OPO/NLO) measured at various depths. n = 18, 18, 18, 18, 16 and 9 measurements from 3 independent acquisitions. §: p = 0.0026, 300 vs. 0µm ; *: p<0.004, 400 vs. 0, 100, 200 and 300µm ; #: p<0.02, 500 vs. 0, 100, 200, 300µm ; Mann-Whitney test. (C). Tridimensional reconstruction of brain blood vessels under an 800nm NLO or 1050nm OPO excitation in the same region of interest. (D). Left: maximal imaging depth achievable over time from 0 to 16 days (D) post-surgery under NLO and OPO excitation in 2 different mice. Right: Representative images from mouse #1 at different depths, excitation modalities and time post-surgery. (E). Images taken at the same level (−70µm) under a 1050nm OPO excitation at D0 and D1 after an unique intravenous injection of QD655 at D0. (F). Images taken at the same level (−70µm) under a 1050nm OPO excitation at D8 and D13 after repeated intravenous injection of QD655 at D0, D2, D8 and D13. (G). Image taken at
−70µm under a 800nm NLO excitation 5 days after an intravenous injection of Rhodamine-dextran 70kDa (red). Blood-vessels are highlighted by an intravenous injection of Texas-red dextran 70kDa (green) prior to imaging. Note the accumulation of Rhodamine dextran 70kDa (red) in macrophages as a consequence of previous injections.
3.3 OPO is more efficient than NLO to excite QD655 in the spinal cord white matter
To verify whether such improvement remained significant in the extreme scattering conditions encountered in the white matter of the CNS, we performed intravital imaging in the spinal cord of a living mouse after intravenous injection of QD655. We confirmed a
significant and depth dependent improvement of the fluorescence signal for a 1050nm OPO excitation instead of an 800nm NLO excitation of same average power. Spatial resolution was improved in the XY plane (Fig. 3(A)) as well as depth penetration (Fig. 3(B)), which resulted in a sharper visualization of the lateral vessels connecting to the central vein. Maximal imaging depth achieved under 1050nm excitation was approximately twice larger than the one achieved at 800 nm.
Taken together, our results promote QD655 as a versatile and valuable red shifted contrast agent for fluorescence microangiography in the CNS. In particular, we show that the performances of this agent can be maximized by installing an OPO at the output of the femtosecond pulsed laser used for classical intravital 2PM. This add-on not only allows for a doubling of the maximal imaging depth but also simultaneously improves the spatial resolution of vascular images.
Fig. 3. OPO is more efficient than NLO to excite QD655 in the healthy mouse spinal cord. (A). Images taken at various depths (140 to 240µm below the dura-mater) under an 800nm NLO or 1050nm OPO excitation in the same region of interest in the spinal cord of a living mouse intravenously injected with a solution of QD655. Arrowheads highlight the improvement of XY spatial resolution under an OPO excitation (B). XY and orthogonal (Z) reconstruction of the central vein at 200µm below the dura-mater under an 800nm NLO or 1050nm OPO excitation. Arrows: diving blood vessel highlighted in the bottom panel. Bottom panel: Y profiles of a diving vein at various depths demonstrate that OPO excitation enables observations at greater depths than NLO. Scale-bar: 100µm.
3.4 QD655 can be used in combination with fluorescent proteins
Taking advantage of the sharpness of their far-red shifted emission spectrum, we next showed that QD655 are suited for multicolor imaging in multi-labeled mice. In cultured DsRed2-expressing glioma cells we first evidenced that QD655 emission spectrum was clearly separated from the broad DsRed2 spectrum, a commonly used fluorescent reporter protein, and was not dependent on the excitation wavelength, unlike what was observed for nitrogen doped QD [23] (Fig. 4(A)-4(B)). Indeed upon a 1050nm excitation, the fluorescence of DsRed2-expressing cells could be differentiated from the fluorescence of neighboring QD655 aggregates in the culture medium using spectral deconvolution algorithms on the emitted fluorescence (Fig. 4(C)). These results indicate that QD655 can be used in combination with red fluorescent proteins such as DsRed2 under an OPO excitation and that the approach can directly be extended to other fluorophores with larger spectral differences. Moreover, the
fluorescence intensity of DsRed was 15-fold enhanced under a 1050nm NLO excitation (Fig. 4(D)).
To validate the above observation in living mice we intravenously injected QD655 to transgenic CD11c-EYFP mice expressing EYFP in microglial cells. In the inflamed spinal cord of these mice we found that the fluorescence of EYFP microglia was more efficiently excited by a 1050nm OPO wavelength rather than by the so far reported optimal 940nm NLO excitation wavelength [3, 11] (Fig. 4(E)). Therefore OPO improved imaging depth penetration and image resolution both for QD655 and for EYFP positive objects. The two emission signals moreover had little spectral overlap and can easily be unmixed.
Finally, with the goal to maximize the number of channels, we performed sequential imaging of the inflamed cortex of a Thy1-CFP/CD11c-EYFP mouse under pure 800nm NLO excitation and under pure 1050nm OPO excitation following intravenous injection of QD655. Fluorescent signal arising from CFP was extracted from the NLO acquisition and signals from EYFP and QD655 were extracted from the OPO acquisition. Merged tridimensional reconstructions highlighted the relative distribution of blood vessels, neurons and microglia down to a depth of 500µm (Fig. 4(F), inset). Similar results could be obtained in the inflamed spinal cord of Thy1-CFP/LysM-EGFP/CD11c-EYFP triple transgenic mice, then highlighting the central vein, axons, monocytes/macrophages and microglia (Fig. 4(G)). QD655 is thus a versatile and efficient intraveinous marker to be injected in any transgenic animal expressing one or multiple fluorescent proteins.
Fig. 4. QD655 can be used in combination with fluorescent proteins. (A-B). DsRed2 (green) and QD655 (red) emission spectra under an 800nm NLO (A) or 1050nm OPO (B) excitation. (C). Spectrally unmixed image of GL261 DsRed2-expressing cells (green) growing on a glass coverslip with QD655 (red) added in the medium using the spectral deconvolution algorithm of the Zeiss Zen 2012 software. Scale-bar: 25µm. (D). Emission intensity of DsRed2 expressed in GL261 cells under an 800nm NLO (green) or 1050nm OPO (red) excitation. Emission was normalized at 100 for NLO excitation. *: p = 0.002, Wilcoxon signed rank test. (E). XY and orthogonal (Z) reconstruction of the central vein of the spinal cord at 180µm below the dura-mater under a 940nm NLO or 1050nm OPO excitation in a CD11c-EYFP mouse. Dotted line: CD11c-EYFP+ cell. Scale-bar: 100µm. (F). Tridimensional reconstruction of an area of the
cerebral cortex of a Thy1-CFP/CD11c-EYFP mouse from a sequential 800nm NLO and 1050nm OPO intravital acquisition. Green: Thy1-CFP neurons (NLO), Red: QD655 in blood vessels (OPO), Magenta: CD11c-EYFP dendritic cells/microglia (OPO). (G). Tridimensional reconstruction of the upper part of the spinal cord of a Thy1-CFP/LysM-EGFP/CD11c-EYFP mouse from a sequential 800nm NLO and 1050nm OPO intravital acquisition. Cyan: Thy1-CFP neurons (NLO), Green: LysM-EGFP monocytes (NLO), Yellow: CD11c-EYFP dendritic cells/microglia (OPO), Red: QD655 in blood vessels (OPO).
4. Discussion
In-depth imaging of living tissue is limited by absorption, scattering and diffusion of light by biological components. An “optical window” was defined in the deep red (600-700nm) and the near infrared (700-1100nm) region where absorption by tissues is minimal and where light penetration is optimal on few millimeters [24]. Moreover, water absorption is still low under these wavelengths reducing potential photodamages on tissues. Recent papers have described various methods such as Scale [25] or Clarity [26] to clear tissues in order to facilitate light transmission. However, such protocols have to be performed on fixed samples and cannot be applied for intravital studies [27].
In the present paper, we described that the combination of infrared 2P excitation generated by an OPO and the intravenous injection of the deep red emitting quantum-dots QD655 can improve the visualization of blood vessels at greater depths than under a classic near infrared 2P excitation and that QD655 are good candidates for deep intravital imaging of vascular structures. This is of value since alterations in the vasculature are frequent in brain pathologies and because deep vascular imaging or endoscopic vascular imaging are relevant for clinical applications [28].
OPO can deliver 2P excitation at wavelengths not accessible with a classic Titanium:Sapphire femtosecond laser. Typically, with the setup described in this paper, wavelengths ranging from 1050 to 1300nm can be obtained with a 800nm pump although at the expense of a power loss of 2.5x (the maximal laser power at the objective back-aperture was 530mW when the NLO was used alone at 800nm; it dropped down to 212mW when the OPO was pumped at 800nm to optimally emit at 1050nm). We show here that the reduction of output power is balanced by the optimal tuning of the laser wavelength to match the excitation spectrum of the fluorophore and the optical properties of the covering tissue layer.
The advantages of OPO for intravital imaging had been described by Herz et al. [29] for red-fluorescent protein derivatives. However, red organic and inorganic contrast agents such as QD655 that have narrow emission spectra were not considered. Here we show 1) that OPO excitation is also valuable for exogenous dyes that ideally extend the palette of intravital red markers, especially for vascular applications. Of interest is the fact that QD, unlike fluorescent dextrans, do not accumulate in meningeal phagocytic cells of the healthy brain thereby allowing for selective labeling of blood vessels. Although phagocytic abilities might vary in relation with the physiological and pathological states, accumulation was never encountered in the pathological states that we tested (surgical inflammation, spinal cord injury, glioblastoma). If needed, QD can be coupled to antibodies to generate intelligent probes [30], extending the field of applications to biological studies aimed to label cell subtypes and characterize their interactions during the development of a pathology for example. We also show that 2) OPO efficiency increases with the imaging depth in the brain of living mice producing from 2 up to 5-fold more fluorescence at 500µm below the dura-mater when compared to standard NLO 800nm excitation under the same power. This effect is explained by the reduced scattering of longer wavelength photons but also by the reduced absorption of 1050nm photons by hemoglobin compared to 800nm photons. The reduction of absorption exponentially affects the relative density of photons at increasing depth according to the Beer Lambert law. We next illustrate 3) the unique microscopic imaging performance of OPO wavelength to study blood capillaries in depth in the CNS given the depth dependent improvement of excitation efficacy that synergizes with the improved lateral resolution of the PSF [29]. The OPO mediated improvement of imaging depth is significant and robust for the diverse optical properties of the neural tissues encountered during evolution of a pathology. This methodological improvement is particularly suited to imaging in highly scattering lipid rich structures such as spinal cord white matter and also to imaging of preclinical models of pathologies where the scattering properties of the parenchyma are dramatically hampered by neuroinflammatory responses or by oncogenic cell proliferation [11]. Noteworthy, we uncovered that 4) the same OPO wavelength that maximizes QD655 fluorescence also excite most efficiently EYFP, a common fluorescent reporter used in transgenic rodents, which
paves the way to optimal in depth dual color imaging with a single excitation wavelength. Importantly, our results on the excitation of QD655 and EYFP outline that the 2P excitation spectrum cannot be simply predicted from the monophoton excitation spectrum of the fluorophores. Several similar examples for QD, proteins and organic dyes can be found in online spectra database (http://www.spectra.arizona.edu/).
Finally, because commercial solutions already offer the possibility to deliver the fundamental pump wavelength simultaneously with the tuned OPO wavelength, at powers compatible with in depth imaging, we show that 5) multicolor imaging of fluorescent transgenic mice enter a new era. This should greatly facilitate the investigation of many questions related to the pathophysiology of various diseases and to assess the effects of pharmacological treatments directly in the living animal.
Acknowledgments
The authors would like to acknowledge Celine Caravagna for contributing to surgical procedures and Gwenaelle Tardif for genotyping and cell culture. This work was supported by grants from Fondation de la Recherche Médicale (ING20140129149) and from Agence Nationale de la Recherche (ANR15-CE16-0009-01) to FD, from Site de Recherche Intégré en Cancérologie (INCA-DGOS-INSERM 6038) and ARSEP Fondation to GR as well as a CIFRE PhD fellowship by Carl Zeiss France to AJ.