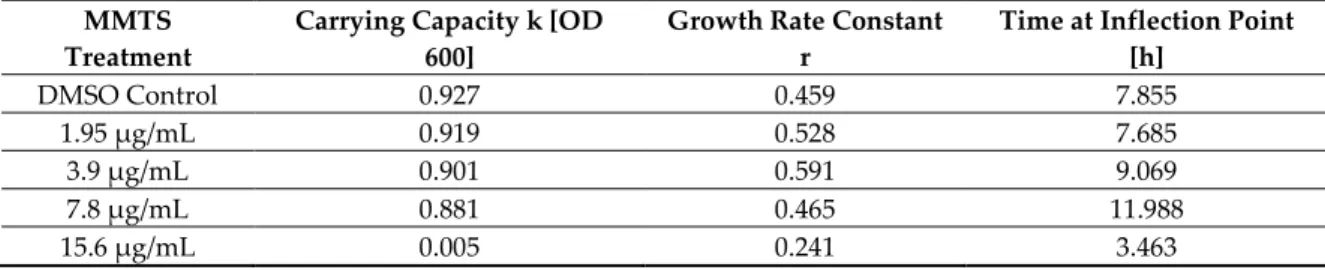
Table S1. Growth parameters obtained for Bakers’ yeast grown at different MMTS concentrations. MMTS
Treatment
Carrying Capacity k [OD 600]
Growth Rate Constant r
Time at Inflection Point [h] DMSO Control 0.927 0.459 7.855 1.95 µg/mL 0.919 0.528 7.685 3.9 µg/mL 0.901 0.591 9.069 7.8 µg/mL 0.881 0.465 11.988 15.6 µg/mL 0.005 0.241 3.463
Table S2. Minimal inhibiting concentrations (MICs) of MMTS for wildtype bacterial species and clinical bacterial species carrying different antibiotic marker genes. MICs were determined in cation-adjusted Muller-Hinton broth (CA-MHB). A mother-solution of MMTS of 256 µg/mL was prepared by dissolving MMTS in water and serial dilutions were obtained by mixing with CA-MHB in 96 well plates. A range of concentrations of 0.125 µg/mL–128 µg/ml was tested against fresh bacterial colonies adjusted to final densities of roughly 106 CFU/mL in CA-MHB. The experiment was carried out in quadruplicates for each bacterial strain. Plates were sealed with parafilm and incubated at 37 °C for 16 h. Growth +/- was visually assessed after incubation.
Species Resistance Phenotype and Determinant MIC MMTS (µg/mL)
E. coli WT 16
E. coli Plasmid-mediated Colistin Resistance MCR-1 32
E. coli Carbapenemase OXA-48, Extended spectrum ß-lactamase CTX-M-9 32
K. pneumoniae Carbapenemase OXA-48 32
K. pneumoniae Cephalosporinase DHA 32
A. baumannii Colistin Resistant (chromosomally encoded) 8
A. baumannii WT 16
P. aeruginosa Colistin Resistant (chromosomally encoded) 16
C. freundii Extended spectrum ß-lactamase CTX-M-1 32
S. aureus Methicillin Susceptible 32
S. aureus Methicillin Resistant MecA (MRSA) 16
S. aureus Daptomycine Resistant 32
E. faecalis Vancomycin Susceptible 64
E. faecalis Linezolide Resistant, Vancomycin Resistant VanA 32 – 64
E. faecalis Linezolide Resistant, Vancomycin Resistant VanA 32
E. faecium Linezolide Resistant, Vancomycin Resistant VanA 64
E. faecium Linezolide Resistant 32 – 64
Figure S1. Significant differences in growth area inhibition of mycelial growth of P. infestans on V8 medium and, T. harzianum, T. artroviride, R. solani,B. cinerea grown on PDA medium (a), (b) as well as R. solani and B. cinerea grown on V8 instead of PDA compared to P. infestans (c), (d) at MMTS concentrations of 1–33 µg/mL. Growth area quantifications in percentage to the solvent control are shown at an early timepoint; (a), (c) and a later timepoint; (b), (d). Average growth compared to the solvent control (100%) depicted in the upper graphs corresponds to the mean of 8 replicates pooled from two independent experiments with four replicates each. Error bars represent standard deviation (n = 8). Letters indicate significant differences in growth area percentages between fungi and
oomycete at a given MMTS concentration according to ANOVA and LSD (Least Significant Difference) for post hoc analysis (p < 0.05).
Figure S2. Inhibition of mycelial growth of P. infestans, T. harzianum and B. cinerea grown on V8 medium with added MMTS at concentrations of 1–33 µg/mL. Representative pictures and corresponding growth area quantifications in percentage to the solvent control are shown at an early timepoint: (a) and a later timepoint; (b). Timepoint 1 corresponded to 4–7 days after inoculation, Timepoint 2 to 12–14 days after inoculation (depending on mycelial growth speed). Average growth compared to the solvent control (100%) depicted in the upper graphs corresponds to the mean of 8 replicates pooled from two independent experiments with four replicates each. Error bars represent standard deviation (n = 8). Significant differences in growth percentages at a given MMTS concentration between fungal species and P. infestans are shown in Figure S1cd.
Figure S3. Significant differences in inhibition of mycelial growth of T. harzianum and B. cinerea grown on V8 or PDA medium with added MMTS at concentrations of 1–33 µg/mL. Growth area quantifications in percentage to the average control are shown at an early timepoint. Bars in graphs
correspond to average growth percentage of 2 repetitions with 4 replicates each. Error bars represent standard deviation. Asteriks indicate significant differences in growth area percentages between media for a given MMTS concentration and fungus according to ANOVA and Tukey’s HSD for post-hoc analysis (significance levels: p-values: ≤0.001 ***, ≤0.01 **, ≤0.5 *).
Figure S4. Significant differences between growth curves of Bakers’ yeast (a) treated with 1.95–3.9 µg/mL MMTS and D. solani (b) treated with 0–30 µg/mL MMTS or kanamycin. (a): The average integrated area under the growth curve, calculated by fitting a log-logistic model to the data, corresponds to the mean of 3 replicates (n = 3). Letters indicate significant differences between integrated areas according to ANOVA followed by LSD for post-hoc analysis. (b); The average empiric area under the growth curve, calculated by summing up the trapezoids connecting the Data points under growth curves, corresponds to the mean of 3 replicates (n = 3). A two-way ANOVA followed by Tukey’s HSD for post-hoc analysis was applied to the data to calculate significant differences between growth curves of D. solani exposed to different concentrations of MMTS and kanamycin (significance levels: p-values: ≤0.001 ***, ≤0.01 **, ≤0.05 *).
Figure S5. Trapping of MMTS by cysteine in the growth medium. A fresh starter culture of D. solani in LB was diluted with LB in test tubes to an OD595 of 0.05. MMTS, cysteine, serine, MMTS and cysteine or MMTS and Serine were then added to a final concentration of 8 × 10⁻⁷ mol/mL of each compound, which corresponds—for MMTS—to approximately 100 µg/mL. This concentration was chosen because 100 µg/mL of MMTS alone completely inhibits bacterial growth. Mother solutions of MMTS, cysteine and serine were realized in water. Bacterial cultures were incubated over night at 28 °C and 180 rpm. OD was measured after incubation. Panels (a) and (b) show the same data but split into two graphs for better visualization, (a) showing the effect on bacterial growth of serine added additionally to MMTS and (b) showing the effect of cysteine added additionally to MMTS. Bars represent the average OD of 2 repetitions with 3 replicates each with error bars corresponding to standard error (n = 6). Letters indicate significant differences between treatments according to ANOVA and Tukey’s honest significant difference for post hoc analysis (p-value < 0.05).