UNIVERSITÉ DE SHERBROOKE Faculté de génie
Département de génie mécanique
AMÉLIORATION ÉNERGÉTIQUE
DU PROCÉDÉ DE CAPTAGE DE CO
2EN POSTCOMBUSTION
AU MOYEN DES ÉJECTEURS
ENERGY IMPROVEMENTS
IN THE POST-COMBUSTION
CO
2CAPTURE PROCESS
BY MEANS OF EJECTORS
Thèse de doctoratSpécialité : génie mécanique Doctoral Thesis
Specialty: Mechanical Engineering J. Christopher Reddick
Jury:
Mikhail SORIN (supervisor/directeur) Zine AIDOUN (co-supervisor/co-directeur)
Hachimi FELLOUAH Nicolas GALANIS
Roberto SUNYE
i
To my mother and father, Barbara and Jim Reddick. To my wife Helene, To our children: Kathleen, Michael, Joanne and Barbara
ii
RÉSUMÉ
Le but principal de ce projet doctoral est de déterminer le potentiel d'amélioration de l'efficacité énergétique du système de captage de carbone dans les stations thermiques de production d'électricité, par l'intégration optimale des éjecteurs monophasiques. Il s'agit du système de captage postcombustion du dioxyde de carbone (CO2) par absorption/désorption
utilisant la monoéthanolamine (MEA). Les éjecteurs intégrés utilisent des rejets thermiques de 100 °C qu'on retrouve dans les stations thermiques de production d'électricité. La revalorisation de ces rejets permet la substitution partielle de vapeur de turbine à coût élevé, qui serait autrement prise de la centrale thermique. Le deuxième objectif de la thèse est d'évaluer expérimentalement la performance d'un éjecteur à vapeur où le fluide secondaire de l'éjecteur est un mélange de vapeur d'eau et d'un gaz non-condensable, dans le cas présent, le CO2.
Deux tuyères d'éjecteur à vapeur, d'un diamètre de 4.60 mm et 4.23 mm, ont été évaluées sur une plage de niveaux de CO2 dans le fluide secondaire, jusqu'à environ 40% en masse. La
pression primaire était maintenue à 450 kPa avec une surchauffe à 10 °C et la pression secondaire était de 70 kPa. On a constaté que la pression critique ne changeait pas à mesure que la fraction massique de CO2 dans le fluide secondaire augmentait. Cependant, le rapport d'entraînement a
augmenté de façon linéaire sur la plage expérimentale. Une amélioration de 23% du rapport d'entraînement par rapport à la vapeur pure a été observée lorsque le fluide secondaire contient 42% de CO2 par masse. Ce comportement contraste nettement avec le comportement observé
expérimentalement d'un éjecteur à vapeur pure, où une augmentation du rapport d'entraînement se produit au détriment d'une diminution de la pression critique.
Trois articles détaillés ont été publiés sur divers scénarios d'intégration d'un éjecteur à vapeur dans un procédé de captage d'absorption/désorption. Le solvant de référence était de 20% en masse de monoéthanolamine (MEA). Trois configurations principales ont été étudiées, selon le choix du fluide utilisé pour produire la vapeur secondaire : éjecteur sur condensat, éjecteur sur pauvre ou éjecteur sur riche. La première publication de revue scientifique a porté sur le procédé de désorption et a présenté une méthode de raccourci basée sur les propriétés du mélange CO2
-MEA-H2O à l'équilibre. Les simulations ont révélé des réductions dans la quantité requise
d'énergie de haute qualité, de 10 à 25%. Un simulateur de procédé commercial, Aspen Plus, a été utilisé pour les deux autres publications. Dans la deuxième publication de revue scientifique, le module cinétique rate-based a été utilisé, au lieu du module d'équilibre, pour la modélisation de l'absorbeur et du désorbeur, permettant des évaluations énergétiques plus près des valeurs qu'on retrouve dans la littérature courante. Une étude a été réalisée pour comparer un scénario de préchauffage de la vapeur primaire par des rejets thermiques externes avec un scénario d'intégration de la chaleur interne. Cette deuxième publication a montré des économies d'énergie de haute qualité, de 10 à 14%, les scénarios avantageux ayant été «éjecteur sur condensat» et «éjecteur sur pauvre».
iii
ABSTRACT
The main goal of the doctoral project is to determine to what extent the optimal integration of single-phase ejectors might reduce the large amount of energy required to capture carbon dioxide from electric power generation facilities. More specifically, the objective is to determine if ejectors can be advantageously integrated into a post-combustion absorption/desorption carbon dioxide (CO2) capture process using monoethanolamine (MEA).
The integrated ejectors will use waste heat of 100 °C from the electric power plant. The upgraded waste heat can partially replace valuable turbine steam that would otherwise be taken from the power plant. The second objective of the thesis is to experimentally evaluate the performance of a steam ejector where the ejector secondary fluid is a mixture of steam and a non-condensable gas, in this case CO2.
Two steam ejector nozzles, of 4.60 mm and 4.23 mm diameter, were evaluated over a range of secondary fluid CO2 levels, up to 42% by mass. The primary pressure was maintained at
450 kPa with 10 °C superheat and the secondary pressure was 70 kPa. It was found that the critical exit pressure did not change as the mass fraction of CO2 in the secondary fluid increased.
The entrainment ratio, however, increased approximately linearly over the experimental range. An improvement of 23% in the entrainment ratio, as compared with pure steam, was found when the secondary fluid contains 42% CO2 by mass. This behaviour is in sharp contrast to the
experimentally observed behaviour of a pure steam ejector, where an increase in entrainment ratio comes at the expense of a decrease in the ejector exit critical pressure.
Three published papers investigated various scenarios for the integration of a steam injector into an absorption/desorption post-combustion capture process. The reference solvent was 20% weight monoethanolamine (MEA). Three principal configurations were studied, according to the choice for the liquid flow used to produce the ejector secondary steam: ejector on condensate, ejector on lean or ejector on rich. The first journal publication focused on the desorption process and presented a shortcut method based on CO2-MEA-H2O equilibrium vapour
liquid data. The simulations revealed reductions in the required amount of valuable energy from 10 to 25%. A commercial process simulator, Aspen Plus, was used for two other publications. In the second journal publication, the kinetic rate-based module was employed to model the absorber and desorber, providing energy evaluations closer to values in the open literature. A study was included comparing preheating the primary steam with waste heat or by heat integration. The rate-based simulation found valuable energy savings of 10 to 14%, with the "ejector on condensate" and "ejector on lean" again being the advantageous scenarios.
Keywords: CO2 capture, post-combustion, ejector, waste heat, MEA, non-condensable
iv
ACKNOWLEDGEMENTS
To begin with, I would like to express my gratitude to my research director, Mikhail Sorin. I very much enjoyed our discussions on all things related to energy efficiency, and his help in seeing the "big picture". His kind, patient and insightful attitude was a continuing source of motivation. Also, thanks for the financial support at various points during the project.
I would like to thank my co-director Zine Aidoun, for his comments and guidance throughout the project and his help with the thesis. I appreciated his steadfast and pleasant demeanor along the long road to experimental results.
My thanks also go to the other jury members for having accepted to review the thesis, and for providing helpful comments and suggestions. I still fondly remember my visit to the Université de Sherbrooke in 2008 to speak with Nicolas Galanis about the possibility of starting a Master's degree. I have benefitted from his teaching and suggestions, right up to the conclusion of the Doctoral program. Thanks to Hachimi Fellouah, who had also kindly accepted to be on the Master's jury, and has again accepted for the PhD jury. I would like to say thanks to Roberto Sunyé for agreeing to help review the thesis and be a member of the jury.
Financial support was very much appreciated by the intervention of Sophie Hosatte of Canmet Energy, principally through the Research Assistant Program of the Government of Canada. I am also grateful that she believed in the experimental project, and facilitated, among other things, my use of computer, a desk, and a friendly work environment.
Very special thanks must be offered to Hristo Sapoundjiev at Canmet Energy, for pragmatic advice, active participation and continual interest throughout the whole experimental phase of the project. Our many discussions and exchanges not only allowed me to complete the experimental work, but were an ongoing source of inspiration in the enjoyable search for innovative applications that combine energy and ejectors. I also wish to acknowledge my many fruitful and amiable exchanges with Stéphane Günther, whose imaginative problem-solving skills were appreciated both on the test bench and with Excel programming.
During the long months of computer simulations, and the inevitable isolation, I was happy to start many a day with my UdeS office colleague Tenon Charly Kone. I was often encouraged by Charly's upbeat disposition and impressive work habits. Thanks also go the Mohamed Khennich and Oumar Samaké, particularly in the earlier part of the project, for discussions and encouragement. To name a few, thanks to fellow students who had a kind word or offered help along the way: Mohamed Hossam Eldakamawy, Ghofrane Sekrani, Mohamed Hafid.
Finally, every thesis and article ends with a list of references. I would be negligent without recognizing the cheerful and helpful contribution of Hélène Bernier, librarian at the Frère-Théode library at the Université de Sherbrooke.
v
TABLE OF CONTENTS
RÉSUMÉ ... ii ABSTRACT ... iii ACKNOWLEDGEMENTS ... iv TABLE OF CONTENTS ... vLIST OF FIGURES ... viii
LIST OF TABLES ... xi
CHAPTER 1 INTRODUCTION ... 1
1.1 Research project description ... 4
1.2 General objectives ... 4
1.3 Specific objectives ... 5
1.4 Originality ... 5
1.5 Thesis plan ... 6
CHAPTER 2 THE STATE OF THE ART ... 7
2.1 Carbon capture processes ... 7
2.2 Process modelling ... 13
2.3 Ejector modelling ... 15
2.4 Non-condensable gases and steam ejectors ... 25
CHAPTER 3 EXPERIMENTAL EVALUATION OF THE EFFECT OF ENTRAINED CO2 ON A STEAM EJECTOR ... 28
3.1 Introduction ... 28
3.2 Methods... 29
3.2.1 The experimental test bench ... 29
3.2.2 Instrumentation and measurement uncertainty ... 36
3.2.3 Ejector and nozzle geometry ... 38
3.2.4 Preparation of a typical ejector performance curve... 42
3.3 Results ... 52
3.3.1 Effect of primary fluid superheat ... 52
3.3.2 Effect of the primary nozzle position and the nozzle shape ... 57
3.3.3 Reference steam conditions for ejector no. 3 and nozzle v3.1.B ... 63
3.3.4 Performance of nozzle v3.1.B, various primary pressures, secondary pressure of 70 kPa ... 64
3.3.5 Performance of nozzle v3.1.B, various secondary pressures, primary pressure of 450 kPa ... 65
3.3.6 Performance of nozzle v3.1.B, various primary and secondary pressures ... 66
3.3.7 Performance, nozzles v3.1.B and v3.2.B, pure steam, various input pressures ... 68
vi
3.3.8 Performance, nozzles v3.1.B and v3.2.B, various primary pressures,
secondary pressure of 70 kPa ... 70
3.3.9 Performance, nozzles v3.1.B and v3.2.B, various secondary pressures, primary pressure of 450 kPa ... 73
3.3.10 Effect of the diameter ratio (D5/D2p)2 on the compression ratio ... 75
3.3.11 Summary of observed effects for pure steam ... 76
3.3.12 Effect of CO2 on performance ... 77
3.3.13 Nozzle v3.1.B performance curves, for varying CO2 levels ... 78
3.3.14 Nozzle v3.2.B performance curves, for varying CO2 levels ... 82
3.3.15 Entrainment ratio correction factor, both nozzles, preliminary results ... 85
3.3.16 Comparison with the empirical results of W.C. Holton ... 87
3.3.17 Effect of ejector exit pressure on the entrainment correction factor ... 89
3.3.18 Effect of CO2 on steam ejector performance ... 91
3.3.19 Prologue to post-combustion ejector enhanced carbon capture ... 94
3.4 Conclusions ... 96
CHAPTER 4 ENERGY SAVINGS IN CO2 (CARBON DIOXIDE) CAPTURE USING EJECTORS FOR WASTE HEAT UPGRADING ... 97
4.1 Avant-propos... 97
4.2 Abstract ... 99
4.3 Introduction ... 100
4.4 Process concept ... 102
4.4.1 Problem statement ... 105
4.5 Model description and assumptions ... 106
4.5.1 Absorber ... 106
4.5.2 Stripping tower assumptions ... 107
4.5.3 Ejector and flash tank assumptions ... 107
4.5.4 The reboiler model ... 107
4.5.5 The ejector and flash tank model ... 109
4.5.6 The stripping tower model ... 112
4.5.7 The valuable heat duty, Qval ... 116
4.5.8 System specifications ... 117
4.6 Simulation results... 119
4.6.1 Model validation without steam injection and the pinch point definition ... 119
4.6.2 Influence of the position of the point of steam injection, xsteam, αFin = 0 ... 120
4.6.3 Influence of the CO2 loading entering the reboiler from the first tray, α1, αFin = 0 ... 121
4.6.4 Influence of Pt and α1 without CO2 desorption in the flash tank, αFin = 0 ... 122
4.6.5 Influence of Pt and α1, with flash tank desorption for αFin = 0.15 ... 123
4.6.6 Influence of Pt and α1 with CO2 desorption, αFin = 0.45 ... 124
4.6.7 Potential energy savings ... 124
4.7 Conclusions ... 126
4.8 Acknowledgments... 127
4.9 Nomenclature ... 127
CHAPTER 5 CARBON CAPTURE SIMULATION USING EJECTORS FOR WASTE HEAT UPGRADING ... 128
vii
5.1 Avant-propos... 128
5.2 Abstract ... 130
5.3 Introduction ... 131
5.4 Methods... 133
5.4.1 Base case CO2 capture process ... 133
5.4.2 Ejector concept ... 134
5.4.3 Problem statement ... 135
5.4.4 Strategies for ejector integration ... 136
5.4.5 Rate-based simulation of the base case using AspenPlus ... 139
5.5 Results and discussion ... 143
5.5.1 Base case ... 143
5.5.2 Ejector on condensate: Primary preheat with waste heat versus heat integration ... 147
5.5.3 Ejector on condensate, for varying reflux ratio ... 150
5.5.4 Ejector on lean, for varying reflux ratio ... 151
5.5.5 Ejector on rich ... 152
5.5.6 Ejector on condensate versus ejector on lean, for varying stripping column pressure ... 153
5.5.7 Ejector on condensate versus ejector on lean, varying stripping column pressure and reflux ratio ... 155
5.5.8 Discussion: Post-combustion CO2 capture and process integration ... 156
5.6 Conclusions ... 157
5.7 Acknowledgments... 158
5.8 Nomenclature ... 158
CHAPTER 6 THESIS CONCLUSION ... 159
CHAPTER 7 CONCLUSION DE LA THÈSE ... 161
APPENDIX A. Instrumentation calibration ... 163
viii
LIST OF FIGURES
Fig. 1.1 Large point source emitters, over 0.1 M tonnes of CO2 per year [64] ... 1
Fig. 1.2 Worldwide energy consumption from primary sources [111] ... 2
Fig. 2.1 CO2 capture pathways [64] ... 7
Fig. 2.2 CO2 separation technologies [94] ... 9
Fig. 2.3 Chemical-looping combustion [1] ... 10
Fig. 2.4 Traditional absorption/desorption CO2 capture ... 12
Fig. 2.5 Ejector application: thermally activated heat pump ... 16
Fig. 2.6 Ejector application: ejector as the second stage of compression ... 16
Fig. 2.7 Ejector application: ejector as an expansion device ... 17
Fig. 2.8 Description of the different flow regions [8] ... 19
Fig. 2.9 Geometric parameters for a traditional ejector [62] ... 20
Fig. 2.10 Steam ejector composite behaviour [87] ... 24
Fig. 2.11 Secondary flow correction factor compared with air [37] ... 26
Fig. 2.12 Optimal ejector design curve [24] ... 27
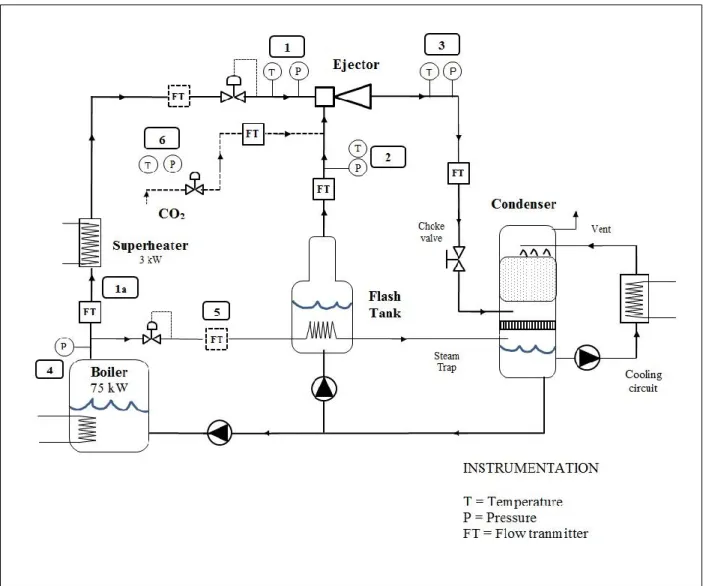
Fig. 3.1 Simplified APCCO2 process plan ... 29
Fig. 3.2 Test bench, view facing the boiler ... 30
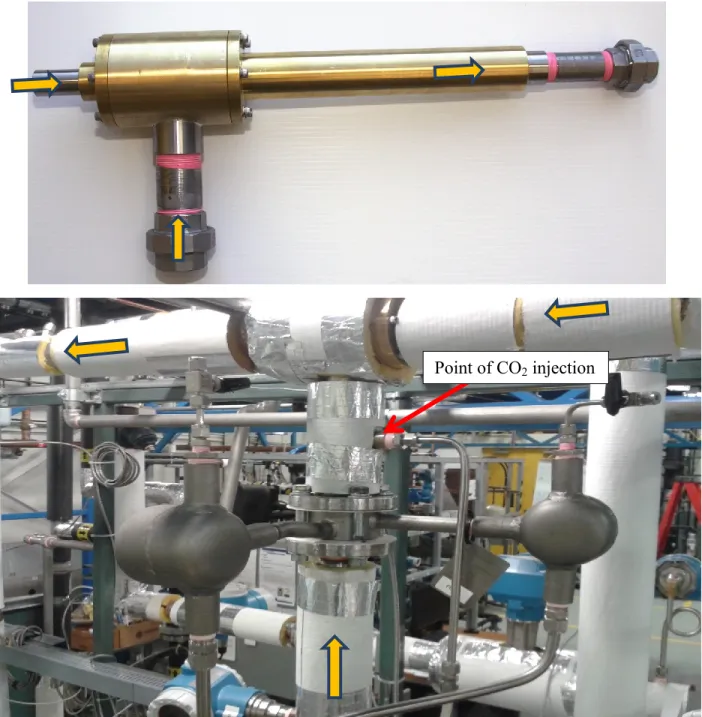
Fig. 3.3 Ejector no. 1 in top image; Installed ejector in bottom image. ... 31
Fig. 3.4 Test bench, view facing the flash tank ... 33
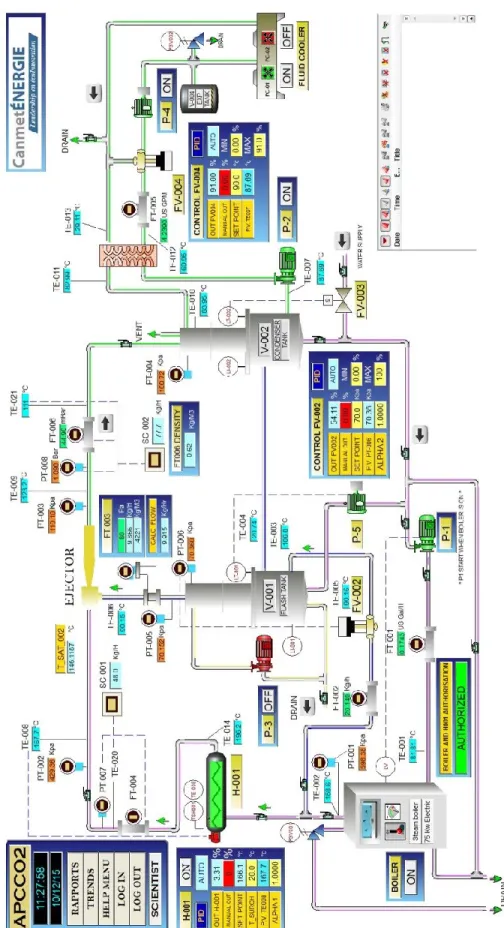
Fig. 3.5 The graphical user interface of the APCCO2 test bench ... 35
Fig. 3.6 Ejector geometry ... 39
Fig. 3.7 Nozzle geometry evolution ... 41
Fig. 3.8 Ejector temperatures, November 24, 2015 ... 44
Fig. 3.9 Ejector pressures, November 24, 2015 ... 45
Fig. 3.10 Ejector exit pressure, November 24, 2015 ... 46
Fig. 3.11 Mass flows, November 24, 2015 ... 47
Fig. 3.12 Performance curve, November 24, 2015 ... 50
Fig. 3.13 Performance curve, April 6, 2016 ... 51
Fig. 3.14 Two levels of superheat: 0 and 20 °C, ejector no.2 ... 53
Fig. 3.15 Three levels of superheat: 0, 10 and 20 °C, ejector no.3 ... 54
Fig. 3.16 Mass flows, April 14, 2016 ... 55
ix
Fig. 3.18 Three nozzle positions: XL3 = 13, 15 and 23 mm, ejector no.2 ... 59
Fig. 3.19 Ejector no.2, nozzle v2.1 ... 60
Fig. 3.20 Ejector no. 3, nozzle v3.1.B ... 60
Fig. 3.21 Three nozzle positions, nozzle v3.1.B ... 61
Fig. 3.22 Three nozzle positions, nozzle v3.2.B ... 62
Fig. 3.23 P1 = 350, 450 or 550 kPa, P2 = 70 kPa, nozzle v3.1.B ... 64
Fig. 3.24 P1 = 450 kPa, P2 = 50, 70 or 90 kPa, nozzle v3.1.B ... 65
Fig. 3.25 Various primary and secondary pressures, nozzle v3.1.B ... 66
Fig. 3.26 Critical pressures, various primary and secondary pressures, nozzle v3.1.B ... 67
Fig. 3.27 Performance curves, various primary and secondary pressures, nozzle v3.1.B ... 68
Fig. 3.28 Performance curves with critical pressures, nozzles v3.1.B and v3.2.B ... 70
Fig. 3.29 Various primary pressures, P2 = 70 kPa, nozzles v3.1.B and v3.2.B ... 71
Fig. 3.30 Various primary pressures, P2 = 70 kPa, nozzles v3.1.B and v3.2.B, analysis ... 72
Fig. 3.31 P1 = 450 kPa, various secondary pressures, nozzles v3.1.B and v3.2.B ... 73
Fig. 3.32 P1 = 450 kPa, various secondary pressures, nozzles v3.1.B and v3.2.B, analysis ... 74
Fig. 3.33 Available performance curves with CO2, nozzle v3.1.B ... 78
Fig. 3.34 Mass flows, various CO2 levels, nozzle v3.1.B, June 30, 2016 ... 79
Fig. 3.35 Reference performance curves for various levels of CO2, nozzle v3.1.B ... 80
Fig. 3.36 Mass flows, various CO2 levels, nozzle v3.2.B, June 8, 2016 ... 82
Fig. 3.37 Available performance curves with CO2, nozzle v3.2.B ... 83
Fig. 3.38 Reference performance curves for various levels of CO2, nozzle v3.2.B ... 84
Fig. 3.39 Correction factor for varying CO2 volume flow rates ... 86
Fig. 3.40 Correction factor for varying CO2 mass flow rates ... 87
Fig. 3.41 Holton reference correction factor as a function of molecular weight ... 89
Fig. 3.42 Correction factor, various exit pressures, nozzle v3.1.B ... 90
Fig. 3.43 Correction factor, various exit pressures, nozzles v3.1.B and v3.2.B ... 91
Fig. 3.44 Experimental results versus Holton reference, nozzles v3.1.B and v3.2.B ... 92
Fig. 3.45 Extrapolated experimental results compared with published data ... 93
Fig. 4.1 Traditional CO2 capture process using absorption/desorption ... 103
Fig. 4.2 A thermally driven heat pump ... 104
Fig. 4.3 An example of heat pumping of waste heat in a CO2 capture system ... 105
Fig. 4.4 The reboiler model ... 108
Fig. 4.5 The ejector and flash tank model ... 110
x
Fig. 4.7 Typical shortcut method equilibrium and operating curves showing steam injection ... 116
Fig. 4.8 Valuable energy as a function of xsteam , Pt = 140 kPa, no flash tank desorption ... 120
Fig. 4.9 Valuable energy as a function of α1, Pt = 140 kPa, no flash tank desorption ... 121
Fig. 4.10 Valuable energy as a function of Pt, with α1 as a parameter, αFin=0 ... 122
Fig. 4.11 Valuable energy as a function of α1, with Pt as a parameter, αFin=0.15 ... 123
Fig. 4.12 Valuable energy as a function of α1, with Pt as a parameter, αFin=0.45 ... 124
Fig. 4.13 Energy Savings with and without flash tank desorption, N=8... 125
Fig. 5.1 Base case CO2 capture process using absorption/desorption ... 134
Fig. 5.2 Basic ejector components ... 135
Fig. 5.3 Entrainment () versus compression ratio (Cr) for the ejector model... 135
Fig. 5.4 Ejector on condensate case ... 137
Fig. 5.5 Ejector on lean case ... 138
Fig. 5.6 Ejector on rich case; first stage of desorption ... 139
Fig. 5.7 Ejector on condensate case with heat integration ... 147
Fig. 5.8 Effect of preheater exit temperature on specific valuable heat, with heat integration ... 149
Fig. 5.9 Duties, ejector on condensate case, with stripping column pressure 126 kP ... 150
Fig. 5.10 Duties, ejector on lean case, split fraction 20%, with stripping column pressure 126 kPa ... 151
Fig. 5.11 Valuable energy savings as a function of ejector case and stripping column pressure ... 153
Fig. 5.12 Valuable energy savings as a function of ejector case and ejector entrainment ratio ... 154
Fig. 5.13 Valuable energy savings as a function of ejector case and ejector exit mass flow ... 154
Fig. 5.14 Valuable energy savings as a function of ejector case, stripping column pressure, and reflux ratio ... 155
Fig. A.1 Typical in-house RTD calibration curve ... 163
Fig. A.2 Typical supplier pressure sensor calibration certificate ... 165
Fig. A.3 Typical supplier flow meter calibration certificate, page 1 of 3 ... 166
Fig. A.4 Typical supplier flow meter calibration certificate, page 2 of 3 ... 167
xi
LIST OF TABLES
Table 3.1 Selected probe identification guide ... 36
Table 3.2 Manufacturers' information and uncertainty for selected probes ... 37
Table 3.3 Ejector design input data ... 38
Table 3.4 Ejector body dimensions ... 40
Table 3.5 Primary nozzle dimensions ... 40
Table 3.6 Selected raw data, November 24, 2015 ... 48
Table 3.7 Data for performance curve, November 24, 2015 ... 49
Table 3.8 Experimental program for ejector no. 3, nozzle v3.1.B ... 63
Table 3.9 Experimental program for ejector no. 3, nozzle v3.2.B ... 69
Table 3.10 Comparison of nozzles v3.1.B and v3.2.B, for constant secondary pressure P2 ... 72
Table 3.11 Comparison of nozzles v3.1.B and v3.2.B, for constant primary pressure P1 ... 75
Table 3.12 Diameter ratio (D5/D2p)2 and compression ratio (Cr) ... 75
Table 3.13 Summary of experimental results for pure steam ... 76
Table 3.14 CO2 mass flow rates with P_exit = 130 kPa, nozzle v3.1.B ... 81
Table 3.15 CO2 mass flow rates with P_exit = 130 kPa, nozzle v3.2.B ... 85
Table 3.16 Preparation of the "Entrainment ratio correction factor" for "Steam Equivalent" ... 88
Table 3.17 Simulation cases and the mass fraction of entrained CO2 ... 95
Table 4.1 Waste heat and stripper tower data ... 117
Table 4.2 Absorber data ... 118
Table 4.3 Chapter 4 nomenclature ... 127
Table 5.1 Ejector integration strategies ... 137
Table 5.2 Base case tower specifications ... 141
Table 5.3 Base case specific valuable duty ... 144
Table 5.4 Base case stream parameters, stripping column 126 kPa ... 145
Table 5.5 Ejector cases stream parameters, stripping column 126 kPa ... 146
Table 5.6 Preheating comparison, with method and preheater exit temperature as parameters ... 148
Table 5.7 Ejector on rich results ... 152
1
CHAPTER 1 INTRODUCTION
The warming of the planetary climate and the increasing atmospheric concentration of carbon dioxide (CO2) is becoming more and more a worldwide concern. The burning of fossil
fuels is the largest source of greenhouse gas associated with human activity, mainly due to CO2
emissions [11]. The capture and long-term storage of CO2 in geological reservoirs is a viable
option to mitigate climate change. This process is now commonly called "Carbon Capture and Storage", or simply CCS. The most efficient method of capturing CO2 is to target large point
source emitters. If large point emitters are defined as sources that are greater than 0.1 M tonnes of CO2 per year, then there are currently more than 8,000 such global sites [64]. As shown in Fig.
1.1, electric power plants represent over 75% of the total emissions of these large stationary sources [64].
2
Energy consumption in general, and fossil fuel combustion in particular, is expected to increase steadily over the next several decades, as indicated in Fig. 1.2. Despite a growing interest in renewable energy sources, and in energy sources that do not emit CO2, technical and
socio-economic challenges are such that the production of electricity from carbon sources remains a worldwide reality. China currently produces 75% of its electricity from coal [111], and many countries have very large coal reserves, possibly lasting for hundreds of years.
3
The technology that is best adapted for the separation of CO2 from other combustion
gases is the process of absorption/desorption [64, 93]. This technology is very energy intensive, mostly due to the energy required to regenerate the solvent. For example, in a coal-fired power plant, a CO2 capture system could consume from 15 to 30% of the gross power plant output [40].
Absorption/desorption processes suitable for CO2 capture have elaborate equipment
configurations and complex gas and liquid flow plans, including pressure drops, heat and mass transfer operations, and the rejection of heat to the environment. Not in this context, but in other areas, ejectors are recently the subject of much research, especially with the goal of improving energy efficiency and in waste heat upgrading [2, 30, 99, 108].
Despite the simplicity of ejectors and their wide application range, these thermofluid devices are not systematically evaluated when new energy-related challenges arise. The internal behaviour of ejectors involves many complex phenomena: the flow of gas and/or liquid at high speed, shock waves, turbulent and boundary layer effects, phase change, flow choking and finally mass, energy and momentum transfer. Historically, the development of ejector applications is very closely tied to the experimental and theoretical work completed for each specific application. One of the challenges in developing new applications is having access to tools which are general enough in nature to evaluate the potential of a proposed ejector application, knowing that the most accurate modelling tools are those which have been experimentally evaluated for very specific requirements over a narrow range of operation.
In the area of post-combustion CO2 capture the literature concerning ejector applications
is very limited. As will be seen in the section on the state of the art, the literature available on certain ejector applications and on ejector models continues to grow. In the context of the current doctoral project, the target research question is the following: To what extent can the incorporation of an ejector into a post-combustion carbon capture system improve the overall energy efficiency?
4
1.1 Research project description
The research project includes both computer simulation and experimental methods. The experimental work was completed at CanmetENERGY in Varennes, Quebec. CanmetENERGY is a technology centre of Natural Resources Canada. A custom test bench was built and used to quantify the effect of entrained secondary CO2 on the performance characteristics of a gas-gas
steam ejector. As part of the doctoral project I actively participated in the test bench construction process, including the numerous modifications required to bring the bench to a fully functional level. Both preliminary and advanced simulations were completed on a monoethanolamine (MEA) based post-combustion CO2 carbon process with the goal of evaluating the optimal
integration method of a steam ejector into the capture process.
1.2 General objectives
The general goal of the research project is to evaluate the potential for energy improvements that can be achieved in carbon capture processes through the use of ejectors. An important aspect of the potential energy improvement is the upgrading of waste heat through the action of the ejector. More specifically, this project will evaluate the possible use of ejectors in post-combustion capture of CO2 using amine based absorption/desorption. Because the method
for incorporating the ejector into the capture process is not unique, various process layout scenarios must be evaluated. The influence of the entrained non-condensable gas in the behaviour of the ejector and the capture process will be accounted for.
5
1.3 Specific objectives
Experimentally evaluate the behaviour of a specific steam jet ejector that operates in the appropriate temperature and pressure range for post-combustion CO2 capture.
Experimentally evaluate and quantify the performance characteristics of a steam activated ejector, where the ejector secondary fluid contains a mixture of CO2 and H2O in the
ejector secondary fluid.
Develop a method of evaluating the optimal integration of a gas-gas ejector into a post-combustion CO2 capture process.
Complete preliminary equilibrium-based simulation analyses of a post-combustion CO2
capture process based on absorption/desorption and find the optimal configuration.
Complete a realistic rate-based simulation analysis of a post-combustion capture process and find the optimal configuration. Commercial process simulators that contain a "rate-based" module account for the very complex chemical kinetics of the CO2-MEA-H2O
chemistry. These modules are known to give more realistic results, but also to be more likely to suffer from non-convergence problems in the process simulation.
Evaluate the effect of entrained CO2 in the ejector secondary fluid both on the overall
capture process and on the behaviour of the steam activated gas-gas ejector.
1.4 Originality
The main originality of this thesis lies in the combination of the following elements: the use of a gas-gas ejector; a post-combustion absorption/desorption CO2 capture process; the
upgrading of waste heat external to the capture process. In other words, external waste heat, upgraded through the action of the ejector, is used to partially replace the valuable steam that would otherwise be withdrawn from the turbine steam in an electric power generation facility.
The experimental work in the thesis is the first work done specifically to evaluate the behaviour of steam ejector where the ejector secondary fluid contains a mixture of CO2 and H2O.
6
The simulations completed in this project are the first to analyse the role of the entrained CO2 on both the local ejector behaviour and the overall capture process behaviour in a
post-combustion absorption/desorption CO2 capture process.
1.5 Thesis plan
Chapter 2 presents the state of the art relating to the project, including the main CO2
capture processes, chemical absorption simulation challenges, ejector modelling and available information and entrained mixtures other than pure steam or air. Chapter 3 describes the experimental work that was completed on pure steam ejectors and the effect of entrained mixtures of steam and CO2. Additional experimental information is included which may be
helpful more generally to others working in the area of ejector research. Chapters 4 and 5 are the peer reviewed journal publications that were completed in the doctoral project. Both contain abstracts, both in French and English, as well as a section "Avant-Propos", in French, which gives the status of the articles as well as their contribution to the thesis. Chapter 4 relates to the simpler equilibrium-based simulations, concentrating on the desorber, which compared three studied process configurations. Chapter 5 extends the work of Chapter 4, by including the absorber and desorber, as well as applying more realistic rate-based models within a commercial chemical process simulator, Aspen Plus. Finally, Chapter 6 presents thesis conclusions.
7
CHAPTER 2 THE STATE OF THE ART
2.1 Carbon capture processes
At the beginning of the doctoral project there was no full-scale application of a CO2
capture system at an electric power generating facility. In 2014, however, the first full scale carbon capture and storage (CCS) process was put on stream at the Boundary Dam power plant in Saskatchewan, Canada. In that case the CCS process was applied to a pulverised coal burning electric plant, where for one of the power production units 90% of the CO2 is removed from the
combustion gases. More generally, however, there are three major paths for carbon capture for power production facilities, as shown in Fig. 2.1: post-combustion, pre-combustion and oxyfuel [64, 77, 94].
Fig. 2.1 CO2 capture pathways [64]
In post-combustion, a capture system would be installed downstream of the current power plant. In this kind of an installation, a very large volume of atmospheric pressure gas must be
8
treated, where the combustion gases contain a relatively low fraction of CO2. For example, 12 to
15% by volume of CO2 is typical of coal-fired flue gas. For existing power plants the majority
of researchers agree that the most appropriate and mature post-combustion capture option is with chemical absorption based on amine solvents [64, 66]. This technology is already widespread, but must be adapted to the special challenges to handle the very high volumes associated with post-combustion capture.
In the pre-combustion pathway, as shown in Fig. 2.1, the fuel is only partially oxidized in the first gasification step. The intermediate gas mixture is known as synthesis gas, which is mainly a mixture of carbon monoxide (CO) and hydrogen (H2). Depending on the ratio of H2 to
CO, the synthesis gas can be used as a feedstock for downstream chemical processes, or directed towards a power plant to complete the final combustion process. When power generation is the final goal, the intermediate synthesis gas is further reacted with steam, producing final products of H2 and CO2 at high pressure, in the range of 3 to 4 MPa. At this final stage the output gas
contains close to 40% by volume CO2 [77]. This high pressure and CO2 rich gas mixture lends
itself to the less energy intensive process of physical absorption. After the CO2 is removed by
physical absorption, the hydrogen can be burned in a highly efficient combined gas-steam power generation plant.
The oxyfuel capture pathway, shown in Fig. 2.1, begins with the combustion of the carbon fossil fuel with almost pure oxygen, resulting in a combustion gas that is around 80% CO2 [77] . Although this technology is currently only at demonstration scale, it has the
advantage of producing an exhaust gas that can simply be de-watered and sent to long term storage. Because the nitrogen present in atmospheric air does not take part in the combustion process, the equipment size can be significantly reduced and certain efficiency improvements are possible. The disadvantage of the oxyfuel pathway is that oxygen must first be removed from the air, typically by cryogenic means or through the use of membranes. Both air separation techniques require a significant energy input.
The choice of the best technology for the separation of CO2 from a gas stream, presented
in schematic form in Fig. 2.2, is a function of the concentration of CO2, the pressure and
temperature of the gas stream to be treated, and of the equipment and operating costs. The four main separation technologies are absorption (with a liquid sorbent), adsorption (with a solid sorbent), cryogenics or with membranes. Typically the liquid sorbent is simply referred to as the
9
solvent. Absorption is the most commercially widespread of the separation choices. Absorption technology is further subdivided into chemical and physical absorption. Chemical absorption is based on the fact that CO2 is an acid gas, as are sulfur dioxide (SO2), nitrogen mono and dioxide
(NOx) and hydrogen sulfide (H2S). All of the acid gases have a tendency to partially dissociate in
contact with water, increasing the acidity of the resulting aqueous solution. Basic, or alkaline solvents can scrub CO2 from gas stream even when the CO2 partial pressure is very low, such as
in post-combustion. Because of the chemical reactions involved in the process, high levels of energy are required in the desorption step to reverse the chemical reactions and regenerate the sorbent. In physical absorption, the absorbed gas is not chemically changed, and molecules of the absorbed gas are simply moved from the gas mixture to the liquid mixture. Physical absorption thus requires less energy to regenerate the solvent than in chemical absorption, but high pressures are required for the absorption process, with the solvent typically being regenerated by dropping the pressure in the desorption step.
Fig. 2.2 CO2 separation technologies [94]
Adsorption (with a solid sorbent), cryogenics and membrane technologies, shown in Fig. 2.2, are still an area of much research [77, 94], but they are not at the same feasibility level as is absorption in the context of carbon capture. More recently, newer separation processes are being studied which more specifically target CO2 capture. In chemical looping, for example, a metal
10
between the air and the fuel. In chemical-looping combustion (CLC), shown in Fig. 2.3, there is an inherent separation of the CO2, thus no downstream separation process is required [1].
Fig. 2.3 Chemical-looping combustion [1]
Strategies that aim to reduce the cost of CCS include the use of new solvents, mixtures of solvents, and new process configurations. Recent solvent studies include Idem et al.[39], Yokoyama et al.[118] and Ohashi et al.[74]. The amine family of solvents, being the oldest in
11
area of CO2 capture, continues to change and advance [53, 54]. Van Wagener and Rochelle [112]
evaluated various configurations, including multi-stage expansion, multi-pressure desorption, mechanical recompression and a heated intermediate column. Jassin and Rochelle [40] also evaluated innovative configurations, finding that a multi-pressure column with mechanical recompression was the most interesting option. Also in the context of new process configurations, but where the solvent is potassium carbonate in the Benfield process [45], ejectors have been proposed for steam compression for the purpose of reallocating heat within the process to reduce the energy consumption at the reboiler. In the area of ammonia production using the Benfield process, Lu et al. [59] proposed recompression with an ejector using plant steam to reduce the steam required in the reboiler. It must be noted that in these systems the proposed ejectors are intended to upgrade heat already within the absorption/desorption process in their respective applications. Part of the originality of the current thesis is the use of waste heat, external to the capture process, to reduce the amount of valuable energy that must be consumed within the absorption/desorption process.
Solutions of water and amine solvents have been used in chemical absorption for the capture of CO2 from natural gas and from hydrogen since the 1930s [45, 93]. Monoethanolamine
(MEA) was one of the first amine solvents to be commercially used for this purpose, and is still used in aqueous solutions from 20 to 30% by weight. Pilot plant tests completed in the 1980s showed the successful post-combustion capture of CO2, where the fuel was either coal or natural
gas [93]. The biggest technological challenge to this capture option remains the reduction of the energy required to regenerate the solvent, which is more than 60% of the total energy of the CCS process [48].
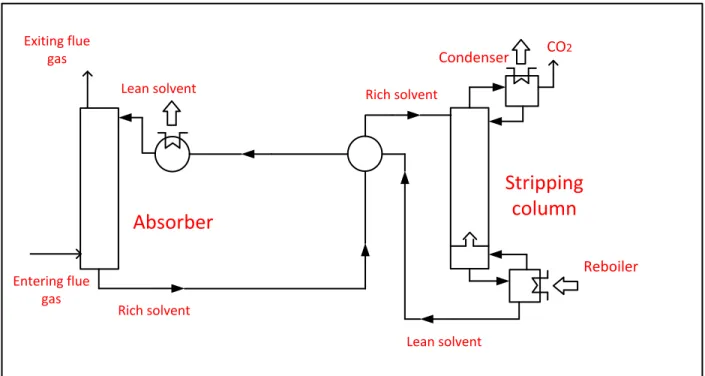
A simplified version of the traditional chemical absorption/desorption CO2 capture
process is shown in Fig. 2.4. The process flow layout is very similar to the original image that accompanied the patent of R.R.Bottoms in 1930. The white arrows indicate the transfer of heat and the black arrows show the fluid flow. The CO2 is transferred from the combustion flue gas
that rises in the absorber, to the solvent mixture that descends the absorber. The solvent mixture entering the top of the absorber contains relatively little CO2 and is thus called the lean solvent.
The solvent mixture that exits the bottom of the absorber is highly concentrated in absorbed CO2,
and is thus called the rich solvent. The rich solvent passes from the absorber bottom to the top of the desorber, typically called the stripping column or simply the stripper. In the stripping column
12
the heat added to the reboiler, at the bottom of the column, produced the steam necessary to desorb the CO2, which rises in the column. The desorbed CO2 leaves the top of the column where
it is separated from the water in the condenser, compressed and sent to long term storage.
Fig. 2.4 Traditional absorption/desorption CO2 capture
As will be detailed in Chapters 4 and 5, the thesis will evaluate three key scenarios for integrating a steam ejector, which upgrades external waste heat, into the traditional capture process shown in Fig. 2.4. The various scenarios principally aim to answer two questions. Where should the ejector exit steam be placed in the stripping column? What stream should be used to produce the secondary steam for the ejector? Because of the specific nature of these questions, this information is not available in the literature.
Rich solvent Lean solvent
Absorber
Stripping
column
Lean solvent Rich solvent Entering flue gas Exiting flue gas Reboiler Condenser CO213
2.2 Process modelling
The history of separation processes relating to liquids and gases traces back to simple batch distillation, and then later to multiple stages of distillation in series, as carried out in a distillation column. Before the advent of modern computers, distillation columns were understood as stacked theoretical trays, where experimentally determined vapour/liquid equilibrium data was used, in combination with mass and energy conservation, to model the behaviour of each tray and then the whole column. Given that equilibrium is not actually achieved for each tray in the column, a correction factor must be applied to model a real distillation column. Even with the commercial development of packed columns, where individual trays are completely replaced with specially shaped packing material to maximize contact between the rising gas phase and the descending liquid phase, the idea of the theoretical tray remains. The construction of the theoretical trays is described in chapter 2 of Kohl and Nielsen [45].
With the arrival of digital computers, it became possible to create much more sophisticated models that take into the account the actual size of each portion of the column, including the packing material and the column diameter, as well as the chemical reaction rates in the difficult case of chemical separation processes. There is now a trend towards programming tools that use this most recent generation of "rate-based" modelling, which model not only the equilibrium thermodynamics, but also the chemical kinetics of each theoretical tray in the column. As will be discussed, there are many subtleties to each of the simulation approaches and more specifically to the modelling of chemical CO2 capture processes.
Experimental evaluation of the basic reference capture process, such as shown in Fig. 2.4, is prohibitively expensive, and even more so if alternative process configurations are to be evaluated. Process modelling and simulation are thus key tools for CO2 capture research. L.E. Oi
reviewed the challenges of modelling the process, particularly within the absorption and desorption columns, identifying four main programming tasks: reaction kinetics, gas/liquid equilibrium properties, gas and liquid flows, and pressure drop [76]. Large commercial chemical process simulation packages are available, which generally allow the user to choose "equilibrium" based modelling or "rate-based" modelling. For example, Aspen Plus is available with an amines package, appropriate for the CO2-MEA-H2O mixture, and can be used in either
14
equilibrium or rate-based simulations. Rate-based models have been shown to be more accurate than the equilibrium models [49]. Nagy et al. explained why rate-based models, particularly for the complex and highly non-ideal mixture of CO2-MEA-H2O in chemical absorption/desorption,
generates results that are closer to published experimental data [69].
Software convergence problems are common in chemical process simulations, even for the computationally less sophisticated equilibrium models. One approach to manage the convergence problem is to complete preliminary simulations with an open loop simplification, as discussed by Arachchige et al. [81], and then in a second phase redo the simulation with a closed loop. For this reason, the use of equilibrium models continues to be used, for example in the study by Yokoyama [119], who studied the reboiler duty in a CO2 captures system where the
solvent solution was 20% wt. MEA.
When equilibrium vapour/gas data is available, custom software can be prepared to model specific portions of the capture process. Lucia et al. [60] used this approach to study minimum energy requirements of the stripping column for various loading conditions of the lean stream. Initial guess values, such as those generated by simpler equilibrium models, can significantly reduce simulation time or even allow converge in more sophisticated models [6, 75]. Shortcut methods can provide first guess values for subsequent simulations, allow pre-screening of potential solvents, and a means of evaluating alternative process configurations [60, 73].
Another layer of difficulty is added when the dynamic behaviour of the capture process is studied. This area of research is important to understand the behaviour of the capture process where the power plant attempts to follow demand load, or to account for process fluctuations during start up and shut down. Gáspár and Cormos [33] studied the dynamic behaviour using a custom code built with Matlab and Simulink. Karimi et al. studied the dynamic behaviour of three different configurations of the capture process, using equilibrium models within a commercial process simulator, Unisim Design with the Amine Package.
Mores et al. [67] developed a mathematical model of the traditional capture process and then completed various optimization studies in the General Algebraic Modeling System (GAMS). Their custom model accounts for reaction kinetics, the hydraulics of the chosen packing material and the overall tower pressure drop. The mathematical model was validated by comparing the results with those of the commercial simulator HYSYS.
15
2.3 Ejector modelling
Henri Griffard invented the steam activated ejector in 1858. This device served as a pump to fill the water tank of steam locomotives [30]. In 1901, Charles Parsons used a steam ejector to remove non-condensable gases from condensers. Maurice Leblanc, in 1910, was the first to incorporate an ejector into a refrigeration cycle, again with steam being the primary driving fluid [18].
In its simplest form an ejector is a tube with two entrances at one end and a single exit at the other. The primary flow, at high pressure, enters the ejector through a relatively small nozzle along the central axis. The secondary flow, at a lower pressure than that of the primary fluid, enters in an annular region surrounding the nozzle. The exiting of the primary fluid from the nozzle creates a low pressure region, inducing the secondary fluid to enter and accelerate towards the central part of the ejector body. By the time the two fluids have reached the ejector exit they have become a single homogenous mixture, at a pressure intermediate between that of the primary and secondary entrance pressures.
Ejector applications are numerous and varied, for example serving to produce vacuum, to compress or partially compress, to mix fluids, or as a fluid expander, to name a few. More recently, ejectors are the subject of much research in the hope of energy efficiency improvements with their incorporation into various processes. In order to categorize these applications, it is often helpful to group them according to the number of phases entering the ejector: single-phase and two-phase.
Fig. 2.5 shows the incorporation of a single-phase ejector into a thermally activated heat pump application, where the refrigeration effect is driven by the thermal energy entering at the generator. This configuration offers many possibilities in the use of solar energy in combination with a single-phase ejector [2, 65]. The configuration also lends itself to the upgrading of waste heat, such as the gas turbine exhaust, as studied in a cycle proposed by Petrenko et al.[84], which produces both power and a refrigeration effect. Absorption refrigeration is also an application where single-phase ejectors offer the possibility of energy efficiency improvement [4, 106]. These absorption refrigeration applications can also include solar energy [5, 36].
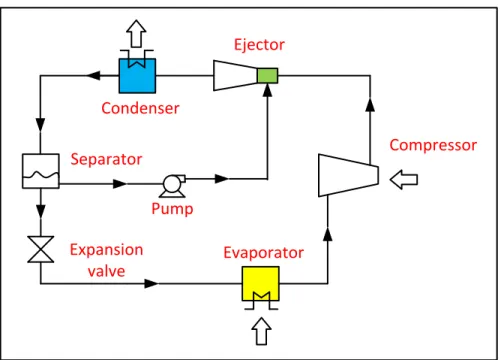
Fig. 2.6 shows a less well-known R22 refrigeration cycle, proposed by Bergander et al. [10], that corporates a two-phase ejector, where the driving fluid is a gas and the secondary
16 Ejector Evaporator Condenser Generator Pump Expansion valve Ejector Evaporator Condenser Expansion valve Separator Compressor Pump
fluid is a liquid. In this cycle the compressor completes the first stage of compression, up to 2/3 of the condenser pressure, and the ejector supplies the second stage of compression. An improvement of up to 38% was calculated for the coefficient of performance (COP). The experimental work found an improvement of up to 16% compared with the conventional vapour compression cycle.
Fig. 2.5 Ejector application: thermally activated heat pump
17 Ejector Evaporator Condenser Expansion valve Separator Compressor
Fig. 2.7 shows a refrigeration cycle using a two-phase ejector, where the ejector replaces the expansion valve in the traditional vapour compression cycle [99, 108]. The use of an ejector as an expansion device in a vapour compression system with R12 was studied by Kornhauser [46]. His theoretical work found an improvement of up to 21% as compared with a system having a thermostatic expansion valve. In an experimental study, using R134a as the working fluid, Reddick et al. [34] showed an improvement in the COP of between 3.9% and 7.6%. More recently, Sag and Ersoy [95] also completed experimental work with R134a, finding an improvement in the COP of 5 to 13% as compared to the traditional vapour compression cycle.
The study of refrigeration systems where an ejector is used as an expander continues, particularly since the development of this technology by Denso in Japan, with the commercialization of the "cool box" option available on the Toyota Highlander in 2008 in North America. In this application the ejector is part of the air-conditioning system that supplies a cooling effect to a central enclosed console for food and drinks. In 2010 Denso also developed an air-conditioning system for the Toyota Prius, again using an ejector as an expander. Deng et al. [25] showed an improvement of 22% in a theoretical study using CO2 as the refrigerant in a
transcritical cycle. Elbel et al. [29] found an improvement of 8% in the refrigeration capacity and 7% in the COP in their experimental work on a transcritical CO2 cycle.
18
Before discussing the modelling of ejectors, it is necessary to discuss the operating modes of an ejector and the associated fluid flow phenomena. For thermodynamic cycles where the ejector exit is connected to a condenser, as in Fig. 2.5, for fixed temperatures in the evaporator and the generator, the mass flow rates and thus their ratio are only a function of the condenser pressure and the ejector geometry. Generally ejectors have a fixed geometry, but adjustable needles have been used to control the primary nozzle area in both single-phase [123] and two-phase ejectors [90]. Assuming a fixed ejector needle position, and thus fixed ejector geometry, there exists a characteristic condenser pressure called the critical pressure, below which the entrainment ratio will remain constant. The entrainment ratio is the ratio of the secondary mass flow to that of the primary. When the exit pressure is at this critical pressure, the ejector is said to operate in "critical" mode. When the condenser pressure is below the critical pressure, the ejector operates in a stable mode, often called "double choked" mode. If the condenser pressure increases beyond the critical pressure the entrainment ratio diminishes, and the ejector is said to operate in "off design" or "single choked" mode. If the condenser pressure, or equivalently the ejector exit pressure, is allowed to further increase, the secondary flow will drop to zero and will actually reverse. The ejector is no longer functioning in a useful way, and this situation is simply referred to as "reverse flow" or ejector malfunction.
Unfortunately, in two-phase ejector applications, as shown in Fig. 2.7, no experimental work has shown the equivalent behaviour associated with the idea of the critical pressure. In single-phase ejectors the prediction of the critical pressure is a means of evaluating a particular ejector design model, and the experimental determination of the critical pressure helps to characterize a particular physical ejector. Most ejectors are designed to operate at or just below the critical pressure, and thus to have a constant stable entrainment ratio.
Fig. 2.8 shows the separation region where the secondary flow detaches from the ejector wall, the mixing region, as well as a shock train region and its associated pressure profile in the lower part of the image. In single-phase ejectors it is known that when the exit pressure increases the shock train moves upstream towards the primary nozzle [9, 102]. Condensation is another phenomenon in the ejector which makes the behaviour of the flows more complex [62]. According to the type of study, experimental or theoretical, it is suggested that the primary fluid be superheated to avoid condensation shocks within the ejector [3, 14, 79, 125].
19 .
Fig. 2.8 Description of the different flow regions [8]
Studies that connect the ejector geometry to its fluid behaviour are of importance for both the design of ejectors and for the validation of more theoretical studies. The use of a movable needle in single-phase applications [55, 113, 114] allows the ejector to be slightly modified so that the cycle can operate at the critical pressure, providing more system control even if the input and output conditions around the ejector change. In two-phase applications, an adjustable needle can offer advantages for system control [29, 50, 57].
Menegay and Kornhauser suggested that the initial poor performance of refrigeration cycles that use a two-phase ejector as an expander was due to the non-equilibrium conditions in the motive nozzle [63]. They proposed allowing a partial expansion of the primary liquid upstream of the nozzle, thus creating many small bubbles which would act as bubble nucleation sites, possibly aiding the primary flow breakup in the mixing section. Taking these ideas into account, Reddick et al. incorporated both an adjustable needle and a fixed throat into their ejector design, finding the best results when the adjustable throat and fixed throat had the same area [90].
20
Leaving aside the possibility of an adjustable primary throat area, Fig. 2.9 shows the minimum parameters required to characterize ejector geometry. Petrenko et al. [83, 84] suggested that an increase of 25 to 30% is possible in the entrainment ratio when the mixing section, often cylindrical, is constructed with a conical section upstream of the cylindrical portion. Sarkar [97] and also Nehdi et al. [71] completed a theoretical study on the effect of a geometric ratio, that of the area of the cylindrical mixing section to the area of the nozzle exit, on the cycle performance. Several experimental studies have dealt with the effect of various aspects of ejector geometry. Chaiwongsa et al. [15] studied the effect of the primary throat diameter with R134a. Elbel et al. [29] evaluated diffuser included angles of 5°, 10° and 15°, finding the best results for 5° with CO2. As they indicated, the best angle is a trade-off between a larger angle associated with
boundary layer separation induced efficiency reduction and a very small angle associated with increased frictional pressure drop for very long diffusers.
Ejector modelling is still a very diversified and evolving research area. Models are classified into three families: dynamic (often referred to as CFD for computational fluid dynamics), thermodynamic (0D or 1D) and empirical or semi-empirical [35]. The subcategory of single-phase or two-phase is still very useful. It should be noted, however, that there is often phase change within an ejector, at least for a portion of the flow, and that the designation of single-phase of two-phase is generally used to indicate if the ejector input streams are of the same or different phases.
21
Recent research on dynamic models is very active and continues to improve our understanding of specific local effects in the ejector [8, 55, 61, 62, 102]. Although these models offer advantages in terms of the precision of the results, they are very complex, need a lot of time to prepare, and they require a suitable choice for both the mesh size and the kind of turbulent model. It has been suggested as recently as 2013 that although CFD can accurately predict ejector performance for critical mode operation, in sub-critical mode these models can generate errors in the 40-50% range in terms of entrainment ratio prediction [16]. A more realistic evaluation of well-built CFD models is that they provide critical mode operation entrainment prediction values within 1-4% of experimental results, depending on the choice of the turbulence model [22]. Most of the thermodynamic single-phase models simulate critical mode operation [14, 23, 27, 38, 79, 83, 103, 106]. Chen et al. [16], to the contrary, accounted for the three modes of operation in their model. In two-phase thermodynamic models, the flow mode is not generally specified.
Although the internal workings of the ejector are not the focus of the thesis, it is hoped that going into a little more detail on ejector models at this point could be helpful to those who are trying to bridge the knowledge gap between ejectors, on the one hand, and CO2 capture
processes on the other. After taking a slightly closer look at thermodynamic ejector models, we will discuss the state of the art on empirical models which are more directly of use in the simulation of capture processes.
The basic equations for the modelling of an ejector begin with the conservation of mass, momentum and energy.
∑ ρiuiAi = ∑ ρeueAe PiAi+ ∑ miui= PeAe+ ∑ meue ∑ mi(hi+ ui2 2) = ∑ me(he+ ue2 2)
Although not shown above, the second law of thermodynamics also imposes the condition that the system entropy should remain constant in an ideal process, or should increase in a real process. The additional equations that are required are largely tied to the strategy of representing the shock wave train and all of the other non-isentropic phenomena within the ejector. Many researchers, working in the area of single-phase ejectors, choose to represent the shock wave train
22
as a normal shock [4, 24, 31, 38, 42, 79, 83, 84, 103, 125]. According to the design choice, the location of this simplifying normal shock wave is generally in the constant diameter portion of the ejector, possibly at the entrance, the exit, or somewhere between the two. In two-phase flow, the normal shock wave approach is not used [29, 46, 47, 58, 97, 98].
The equations describing normal shock waves are easier to formulate when the ideal gas law is assumed, but this is not required. Outside the area including the shock wave, if there is one, the choice of using the assumption of the ideal gas law or real gas properties varies from one author to another. In two phase flow, or when a normal shock wave is included in the model, the assumption of a homogeneous mixture is almost always made. This assumption imposes the same flow velocity for both the gas phase and the liquid phase in the mixture. As a first approximation, the speed of sound is often approximated by the gas phase. Certain homogeneous models calculate the "two-phase" speed of sound, such as Cardemil et al. [14] in a model that is essentially single-phase, or Liu et al. [58]. Samaké et al. [96] used the Wood approximation for the two-phase speed of sound. Several recent studies do not require the calculation of the speed of sound, as the primary and secondary throat areas are defined in terms of the maximum mass flow per unit area [7, 32, 44, 96]. In these studies the calculation and discussion of the speed of sound is merely for comparative purposes, particularly for comparison with the ideal isentropic case, and is not required for the ejector model. The question of what equation is the most appropriate for quantifying the speed of sound in two-phase flow was addressed by Ameur et al. [7], where equations proposed by Wood, Attou, Nakagawa and Ameur were compared. The Wood and Ameur equations gave results closest to REFPROP values, but there is still a need for experimental validation of the two-phase speed of sound. As a conceptual tool in the ejector design, however, there may not in fact be a need for this parameter.
The explicit representation of the friction of the fluid flow along the inner walls of the ejector is not generally done in thermodynamic models. Selvaraju and Mani [103], however, incorporated a friction factor into their model, and later this same approach has been used by certain other authors in order to account for the length of each section of the ejector [21, 28, 41].
Almost all thermodynamic models, as much in the area of single-phase [16, 27, 38, 79] as in two-phase [12, 56, 71, 97], use isentropic coefficients, especially for the primary nozzle, the secondary nozzle, and for the exit diffuser. Coefficients that apply to the transfer of the momentum exchange in the mixing section are also common [14, 27, 58]. Unfortunately these
23
models are not directly comparable with each otherls, even for models that compare favorably with experimental results, given that each model does not use the same assumptions, secondary relations, geometry or limit conditions.
Rather than applying a constant isentropic coefficient to the acceleration and deceleration processes in the ejector, the concept of applying a fixed polytropic efficiency has been applied for the first time to ejectors by Samake et al. [96], Galanis and Sorin [32], and Khennich et al. [44]. Polytropic efficiency was used in turbine design to characterize the isentropic efficiency of each turbine stage [105]. By applying this concept to ejector design, the overall efficiency is a function of the inlet and outlet pressures, which is more realistic, rather than a fixed efficiency, as occurs when a constant isentropic coefficient is assumed.
The first mathematical model of an ejector began with Keenan and Neumann (1942), and applied to a single-phase air ejector [43]. Keenan et al. [42] introduced two concepts for characterizing the ejector mixing process. In "Constant Pressure" mixing, the primary nozzle exit is upstream of the constant area section of the ejector, as shown in Fig. 2.9. In "Constant Area" mixing, the exit of the primary nozzle is in the same plane as the entrance to the cylindrical portion of the ejector. Munday and Bagster [68] introduced the idea of the fictive throat in their "Constant Area" ejector model, as a means of explaining the observed constant secondary mass flow when the ejector operates below the critical exit pressure. Eames et al. [27] accounted for irreversibility in their model by introducing isentropic efficiencies for the primary nozzle, diffuser and the mixing chamber.
In two-phase ejectors, in 1990 Kornhauser [46] presented a 1D model that used isentropic coefficients. Several researchers continued in the same way, but modified the starting assumptions [12, 29, 57, 71]. Nehdi [71] introduced a simplifying relationship for the mixing section. Bilir et al. [12] supposed that the pressure at the exit of the primary nozzle was equal to the secondary pressure in the same plane, and varied this unknown pressure in order to optimize the studied cycle performance. Liu et al. [58] did not impose the same pressure for the two fluid flows at the exit of the primary nozzle. In all of these two-phase cases, there is very little published information with which proposed models can be validated.
Empirical models, when they are available for the operating range and working fluid of interest, offer an excellent starting point for exploratory ejector application studies. R.B.Power [86] built a graph for single-phase steam ejectors, based on an amalgam of available
24
commercial steam ejector suppliers' data, which describes the entrainment ratio as a function of the pressures at the ejector entrance and exit ports. This graph, shown in Fig. 2.9, is not strictly a model, but it contains the performance characteristics of actual steam jet ejectors over a very wide range of operating parameters. El-Dessouky et al. [31] published empirical relations for steam ejectors, for ejector operation in critical and sub-critical modes. Other empirical models or semi-empirical models exist, but their application range is very restricted [35].
![Fig. 1.1 Large point source emitters, over 0.1 M tonnes of CO 2 per year [64]](https://thumb-eu.123doks.com/thumbv2/123doknet/3093965.87628/14.918.111.814.497.1010/fig-large-point-source-emitters-m-tonnes-year.webp)
![Fig. 2.1 CO 2 capture pathways [64]](https://thumb-eu.123doks.com/thumbv2/123doknet/3093965.87628/20.918.108.790.473.884/fig-capture-pathways.webp)
![Fig. 2.2 CO 2 separation technologies [94]](https://thumb-eu.123doks.com/thumbv2/123doknet/3093965.87628/22.918.112.790.509.846/fig-separation-technologies.webp)
![Fig. 2.9 Geometric parameters for a traditional ejector [62]](https://thumb-eu.123doks.com/thumbv2/123doknet/3093965.87628/33.918.112.776.700.1010/fig-geometric-parameters-for-a-traditional-ejector.webp)
![Fig. 2.11 Secondary flow correction factor compared with air [37]](https://thumb-eu.123doks.com/thumbv2/123doknet/3093965.87628/39.918.113.816.390.778/fig-secondary-flow-correction-factor-compared-air.webp)