Assessment of Solvent Degradation within a Global
Process Model of Post-Combustion CO
2Capture
Grégoire Léonard*, Dominique Toye, Georges Heyen
Department of Chemical Engineering, B6a Allée de la chimie, 4000 Liège Sart-Tilman, Belgium
Abstract
Solvent degradation may be a major drawback for the large-scale implementation of post-combustion CO2 capture due to amine consumption and emission of degradation
products. However, its influence on the process operations has rarely been studied. In the present work, a kinetics model describing solvent oxidative and thermal degradation has been developed based on own experimental results for the benchmark solvent, i.e. 30 wt% monoethanolamine (MEA) in water. This model has been included into a global Aspen Plus model of the CO2 capture process. The selected process modelling
approaches are described in the present work. Using the resulting simulation model, optimal operating conditions can be identified to minimize both the energy requirement and the solvent degradation in the process. This kind of process model assessing solvent degradation may contribute to the design of large-scale CO2 capture plants to consider
not only the process energy penalty, but also its environmental penalty. Indeed, both aspects are relevant for the large-scale deployment of the CO2 capture technology.
Keywords: Post-combustion CO2 capture, Solvent degradation, Process modelling.
1. Introduction
In a context of growing world energy demand and environmental concerns, CO2
capture, re-use and storage is one of the most promising technologies to significantly and rapidly reduce greenhouse gas emissions. Among the different CO2 capture
methods, the post-combustion capture is the most mature one for a large-scale deployment. It consists in an absorption – regeneration loop in which CO2 from the flue
gas is absorbed in an amine solvent at temperatures varying between 40 and 60 °C. The process is usually designed so that the flue gas vented to the atmosphere after absorption contains 90 % less CO2. The CO2-loaded solvent is regenerated in a stripper
at a higher temperature (between 100 and 140 °C, depending on the solvent). The produced CO2 stream is almost pure and may be valorized (applications in food
industry, enhanced oil recovery…) or stored underground. The present work studies the CO2 capture in coal and natural gas fired power plants.
At the operational level, Svendsen et al. (2011) have identified two main drawbacks regarding post-combustion CO2 capture. First, the high energy requirement for
regenerating the amine solvent leads to a decrease by about 30 % of the plant efficiency. Then, the environmental impact of the CO2 capture is affected by the emissions of
amine solvent and solvent degradation products. Besides the emission of potentially harmful products, solvent degradation also impacts the process operating and capital costs. Indeed, the solvent absorption capacity decreases, its viscosity and its corrosivity increase, the vapour-liquid equilibrium is modified and foaming and fouling may appear
in the columns (Bedell, 2009). So far, the process energy penalty and the degradation of amine solvents have been studied separately and previously published models of the CO2 capture process did not consider solvent degradation at all (e.g. Léonard and
Heyen, 2011). Thus, the objective of the present work is to develop a model of the CO2
capture process that assesses solvent degradation based on own experimental work, so that the influence of process operating conditions on solvent degradation may be better understood. As a result, solvent degradation could be considered more accurately during the design of CO2 capture units, which is especially relevant for large-scale plants.
2. Experimental study
Two main solvent degradation mechanisms take place in the CO2 capture process:
oxidative degradation and thermal degradation with CO2. However, few data were
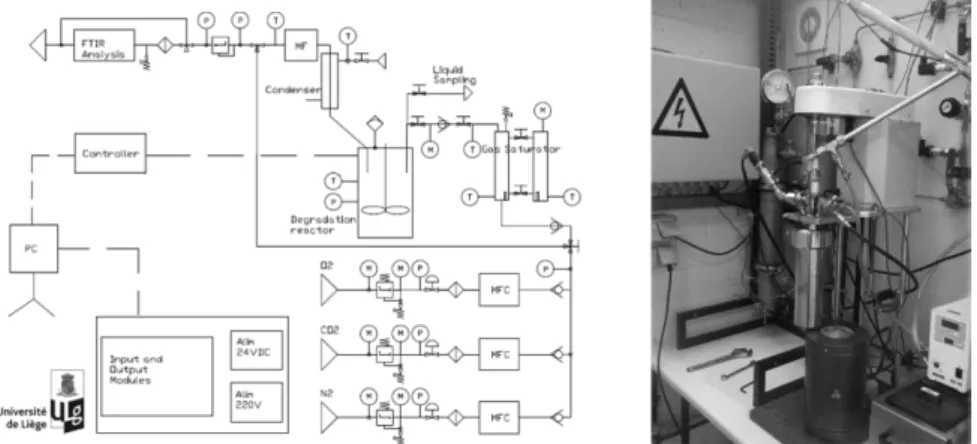
available to describe the influence of process operating conditions on solvent degradation. Because solvent degradation is a slow phenomenon, accelerated conditions are necessary to study it within a reasonable timeframe. Thus, an experimental test rig consisting in an agitated pressurized reactor with continuous gas feed has been designed for accelerating solvent degradation. Figure 1 shows this test rig which allows the degradation of solvents at temperatures up to 140 °C and pressures up to 20 bar, with flexible gas composition. Liquid degradation products are quantified using gas chromatography while the MEA content is determined by high performance liquid chromatography. Gaseous degradation products are quantified by Fourier transformed infra-red spectroscopy. The nitrogen mass balance of degradation experiments could be closed within 10 % and repeatability is demonstrated with a deviation lower than 5 %. Various degradation experiments have been performed to study the influence of process operating variables on the degradation of 30 wt% MEA in water (benchmark solvent for CO2 capture). Among other, the influence of the agitation rate, the temperature and the
composition of the flue gas feed (varying concentrations in N2, O2 and CO2) have been
tested. Identified degradation pathways at lab-scale are observed to be similar to pathways observed in CO2 capture pilot plants as evidenced in Figure 2 by the
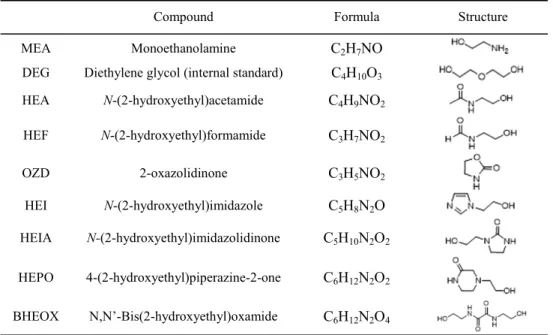
comparison of lab and industrial degraded solvent samples. The main products identified in Figure 2 have been listed in Table 1. Moreover, ammonia is the main degradation product identified in the gas phase. More details and results of the experimental degradation study are given in a previous work (Léonard, 2013).
Figure 2. Comparison of the gas chromatography spectra between lab experiments (base case experiment) and degraded MEA samples from industrial pilot plants
Table 1. Main identified products by gas chromatography of degraded MEA solutions
Compound Formula Structure
MEA Monoethanolamine C2H7NO
DEG Diethylene glycol (internal standard) C4H10O3
HEA N-(2-hydroxyethyl)acetamide C4H9NO2 HEF N-(2-hydroxyethyl)formamide C3H7NO2 OZD 2-oxazolidinone C3H5NO2 HEI N-(2-hydroxyethyl)imidazole C5H8N2O HEIA N-(2-hydroxyethyl)imidazolidinone C5H10N2O2 HEPO 4-(2-hydroxyethyl)piperazine-2-one C6H12N2O2 BHEOX N,N’-Bis(2-hydroxyethyl)oxamide C6H12N2O4
3. Model construction
Based on the results of the degradation study, a kinetics model of MEA degradation is proposed, assuming one empirical degradation reaction for each studied degradation pathway. Since the exact reaction mechanisms of MEA oxidative degradation are still unknown, the stoichiometric coefficients of degradation products are determined from the product distribution observed in the experimental study and normalized to the degradation of one mol MEA. Although not measured in the present work, formic acid
has been included to take the formation of heat stable salts into account since they have been identified in previous experimental studies (Sexton and Rochelle, 2009). The resulting apparent reaction of MEA with oxygen is represented in Equation (1) while its kinetics is given in Equation (2) according Arrhenius’ equation. Regarding the thermal degradation of MEA with CO2, degradation mechanisms are known and lead to
Equation (3) with the associated kinetics from Equation (4). R is the universal gas constant (8.314 J/mol.K), T the temperature (K), and the MEA, O2 and CO2
concentrations are in mol/L. The values for the activation energy are given in J/mol. MEA+ 1.3 O2
=> 0.6 NH3 + 0.1 C5H8N2O + 0.1 C6H12N2O2 + 0.1 HCOOH + 0.8 CO2 + 1.5 H2O (1)
-rMEA, Oxidative = 5.35 105 . e-41,730/RT.[O2]1.46 (2)
MEA + 0.5 CO2 => 0.5 C5H10N2O2 + H2O (3)
-rMEA, Thermal = 6.27 1011 . e-143,106/RT.[CO2]0.9 (4)
This kinetics model for MEA oxidative and thermal degradation with CO2 has been
included into a global rate-based process model developed in Aspen Plus (Léonard and Heyen, 2013). This model represents the pilot plant described by Knudsen et al. (2011), treating a flue gas flow rate of 5000 Nm³/h. In order to integrate the degradation into the CO2 capture process, different process modelling assumptions have been considered.
First, the degradation reactions have been included into a steady-state model since dynamic simulations are not adapted to describe small modifications over long time scales (several months). Then, the degradation reactions have been considered to take place in the absorption and stripping columns, which better reflects the actual process operating conditions. Degradation in other process equipment has been neglected. Moreover, the degradation model has been designed without any purge or MEA make-up stream. These streams were initially present in the model, but since the degradation rates are very low, accumulating degradation products did not prevent the simulation from converging even in the absence of purge and make-up streams. This implies that the calculation converges although the tear streams of the solvent loop are not rigorously in mass balance. As a consequence, degradation rates are quantified by the formation of degradation products in the mass transfer columns since column reactions are precisely calculated by Aspen Plus at the contrary of solvent loop concentrations. Finally, the degradation products appearing in the degradation reactions had to be specified in Aspen Plus. Component data for NH3 and HCOOH have been retrieved
from Aspen Plus databases. However, no data were available for the other organic degradation products, but they could be estimated by Aspen Plus based on their molecular structure. In a first approach, these components have been defined as non-volatile to facilitate the liquid-vapor equilibria calculations. Considering the high molecular weights of these components, this non-volatility assumption appears relevant.
4. Simulation results
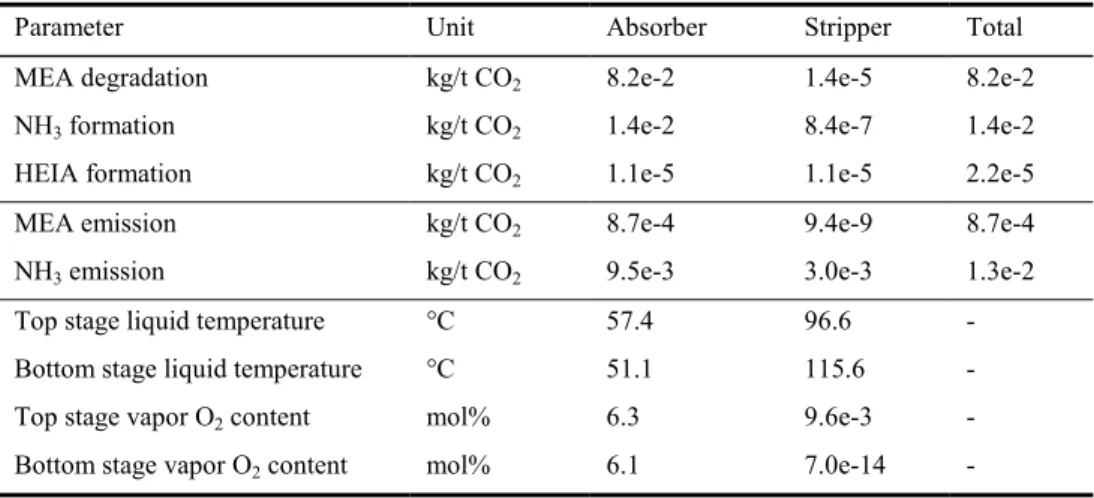
The main observations reported for the base case configuration of the degradation model are listed in Table 2. Ammonia and HEIA production rates have been reported, since ammonia is the main product of MEA oxidative degradation and HEIA the main product of the MEA thermal degradation with CO2. The model confirms that oxidative
degradation in the absorber is the main cause for solvent loss in CO2 capture plants. It
also confirms that ammonia emissions at the absorber outlet are one of the major environmental issues of this technology (Mertens et al., 2013). The amount of degraded
MEA observed in the model is in the same order of magnitude compared with CO2
capture plant results, although the predicted values are lower. Indeed, the total MEA loss equals 0.082 kg MEA/t CO2 and recent pilot plant results (Moser et al., 2011)
report a degradation rate of 0.284 kg MEA/t CO2 in the absence of degradation
inhibitors. This difference may be due to two assumptions done in first-approach, which are to neglect the presence of SOX and NOX contaminants in the flue gas, and to neglect
the presence of dissolved metals in the solvent solution as well. Since all these components are known to increase the degradation rate (Sexton and Rochelle, 2009), they should be considered in further model developments.
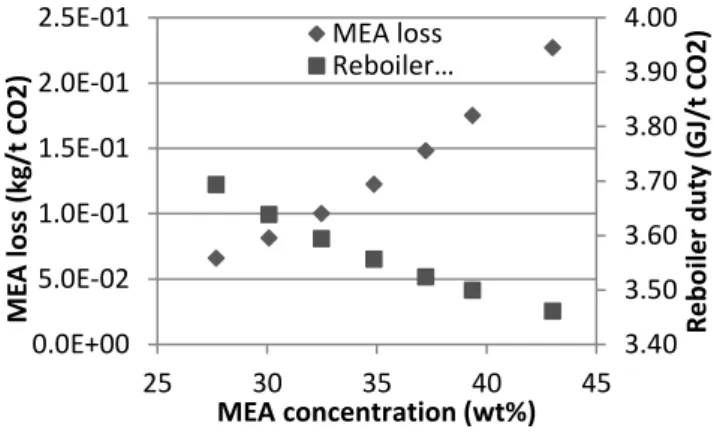
Using the developed model, the influence of process operating variables on the energy and the environmental penalties of the CO2 capture process can be quantified. The
solvent flow rate and concentration, the stripper pressure and the oxygen concentration in the flue gas are varied. The largest energy savings are observed when increasing the stripper pressure and the solvent concentration, while the most significant increases of the MEA consumption are due to the increased oxygen concentration in the flue gas and to the higher solvent concentration. An example of such result is represented in Figure 3. It appears that increasing the MEA concentration from 30 wt% to 40 wt% reduces the reboiler heat duty by 4 % from 3.64 to 3.49 GJ/t CO2. However, it also
doubles the MEA loss from 0.082 up to 0.175 kg/t CO2, so that concentrated MEA is
not an advantageous solvent except if degradation inhibitors are added to the solvent solution. Finally, two process improvements are tested (absorber intercooling and lean vapour compression) that both reduce the total process energy requirement with no significant influence on solvent degradation. Combining these two improvements with optimal operating conditions leads to a reduction of the process energy requirement by 12 % at equivalent solvent consumption rate. The corresponding energy requirement of the CO2 capture process is evaluated to 3.1 GJ/t CO2, with a resulting MEA
consumption of 78 g MEA/t CO2.
Table 2. Degradation and emission results for the degradation model
Parameter Unit Absorber Stripper Total
MEA degradation kg/t CO2 8.2e-2 1.4e-5 8.2e-2
NH3 formation kg/t CO2 1.4e-2 8.4e-7 1.4e-2
HEIA formation kg/t CO2 1.1e-5 1.1e-5 2.2e-5
MEA emission kg/t CO2 8.7e-4 9.4e-9 8.7e-4
NH3 emission kg/t CO2 9.5e-3 3.0e-3 1.3e-2
Top stage liquid temperature °C 57.4 96.6 - Bottom stage liquid temperature °C 51.1 115.6 - Top stage vapor O2 content mol% 6.3 9.6e-3 -
Figure 3. Influence of the MEA concentration on the process energy and environmental penalties
5. Conclusions
The present work may be considered as a first step for assessing both solvent degradation and energy requirement in CO2 capture plants. This methodology that has
been developed for the case of MEA in CO2 capture conditions may be extended to
alternative promising solvents, like piperazine for instance. This kind of model could and should be used for the capture plant design to consider not only the process energy penalty, but also its environmental penalty. Indeed, both aspects are particularly relevant in case of large-scale deployment of the CO2 capture technology. Further modelling
perspectives may consider the catalytic effect of dissolved metals on solvent oxidative degradation and the presence of SOx and NOx contaminants in the power plant flue gas.
Acknowledgements
The authors would like to thank the Belgian Fund for Scientific Research (FRIA-FNRS) and the company Laborelec (GDF SUEZ group) for the financial and technical support.
References
S. Bedell, 2009, Oxidative degradation mechanisms for amine in flue gas capture, Energy Procedia, 1, 771-778.
J. Knudsen, J. Andersen, J. Jensen, O. Biede, 2011, Evaluation of process upgrades and novel solvents for the post combustion CO2 capture in pilot-scale, Energy Procedia, 4, 1558-1565.
G. Léonard, G. Heyen, 2011, Modeling post-combustion CO2 capture with amine solvents,
Computer Aided Chemical Engineering, 29, 1768-1772.
G. Léonard, C. B. Mogador, S. Belletante, G. Heyen, 2013, Dynamic modelling and control of a pilot plant for post-combustion capture, Computer Aided Chemical Engineering, 31, 451-456. G. Léonard, 2013, Optimal design of a CO2 capture unit with assessment of solvent degradation,
PhD Thesis, University of Liège, Belgium.
J. Mertens, H. Lepaumier, D. Desagher, M.-L. Thielens, 2013, Understanding ethanolamine (MEA) and ammonia emissions from amine based post combustion carbon capture: Lessons learned from field tests, International Journal of Greenhouse Gas Control, 13, 72-77. P. Moser, S. Schmidt, K. Stahl, 2011, Investigation of trace elements in the inlet and outlet
streams of a MEA-based post-combustion capture process - Results from the test programme at the Niederaussem pilot plant, Energy Procedia, 4, 473-479.
A. Sexton, G. Rochelle, 2009, Catalysts and inhibitors for oxidative degradation of monoethanolamine, International Journal of Greenhouse Gas Control, 3, 704-711.
H. Svendsen, E. Essen, T. Mejdell, 2011, Carbon dioxide capture by absorption, challenges and possibilities, Chemical Engineering Journal, 171, 718-724.
3.40 3.50 3.60 3.70 3.80 3.90 4.00 0.0E+00 5.0E-02 1.0E-01 1.5E-01 2.0E-01 2.5E-01 25 30 35 40 45 R e b o ile r d u ty (G J/t C O 2) ME A loss (kg/t CO2) MEA concentration (wt%) MEA loss Reboiler…