HAL Id: insu-01369370
https://hal-insu.archives-ouvertes.fr/insu-01369370
Submitted on 21 Sep 2016
HAL is a multi-disciplinary open access
archive for the deposit and dissemination of
sci-entific research documents, whether they are
pub-lished or not. The documents may come from
teaching and research institutions in France or
abroad, or from public or private research centers.
L’archive ouverte pluridisciplinaire HAL, est
destinée au dépôt et à la diffusion de documents
scientifiques de niveau recherche, publiés ou non,
émanant des établissements d’enseignement et de
recherche français ou étrangers, des laboratoires
publics ou privés.
Parallel Developments and Formal Collaboration
between European Atmospheric Profiling Observatories
and the U.S. ARM Research Program
M. Haeffelin, S. Crewell, A. J. Illingworth, G. Pappalardo, H. Russchenberg,
Marjolaine Chiriaco, K. Ebell, R. J. Hogan, F. Madonna
To cite this version:
M. Haeffelin, S. Crewell, A. J. Illingworth, G. Pappalardo, H. Russchenberg, et al.. Parallel
Devel-opments and Formal Collaboration between European Atmospheric Profiling Observatories and the
U.S. ARM Research Program. Meteorological Monographs- American Meteorological Society,
Amer-ican Meteorological Society, 2016, 57, pp.29. �10.1175/AMSMONOGRAPHS-D-15-0045.1�.
�insu-01369370�
Chapter 29
Parallel Developments and Formal Collaboration between European Atmospheric
Profiling Observatories and the U.S. ARM Research Program
M. HAEFFELIN,* S. CREWELL,1A. J. ILLINGWORTH,#G. PAPPALARDO,@H. RUSSCHENBERG,& M. CHIRIACO,** K. EBELL,1R. J. HOGAN,#ANDF. MADONNA@
* L’Institut Pierre-Simon Laplace, Centre National de la Recherche Scientifique, Palaiseau, France
1Institute for Geophysics and Meteorology, University of Cologne, Cologne, Germany #Department of Meteorology, University of Reading, Reading, United Kingdom
@Consiglio Nazionale delle Ricerche–Istituto di Metodologie per l’Analisi Ambientale, Potenza, Italy &Department of Geoscience and Remote Sensing, Delft University of Technology, Delft, Netherlands
** Laboratoire Atmosphère, Milieu, Observations Spatiales, Université Versailles Saint Quentin en Yvelines, Guyancourt, France
1. Introduction
The climate research community aims to better charac-terize climate forcings such as aerosols, reactive gases, and greenhouse gases, and to better understand the responses of the climate system to these forcings. Such investigations rely in part on monitoring, studying, and understanding essential climate variables such as temperature, water va-por, clouds, radiation, and perturbations of aerosols and reactive gases. According toDufresne and Bony (2008), the parameters that play a predominant role in radiative feedbacks of the climate system are atmospheric humidity, adiabatic thermal gradients, clouds, and surface albedo. Interactions between humidity, clouds, aerosols, and radi-ation make climate predictions more complex.
The climate research community has long recognized the link between climate prediction uncertainty and at-mospheric process complexity. For more than 20 years, it has demonstrated the necessity to perform collocated long-term observations of thermodynamic parameters (temperature, humidity, wind) and atmospheric con-stituents (gases, aerosols, clouds) distributed along the entire atmospheric column (surface to stratosphere) and associated radiative components.
As a result, the U.S. Department of Energy (DOE) launched the Atmospheric Radiation Measurement (ARM)
Program in the 1990s (Ackerman and Stokes 2003;Stokes 2016, chapter 2). Four atmospheric profiling observation facilities were developed to gather in situ and remote sensing instruments to monitor physical processes in the atmospheric column. A large research community of observation experts and climate modelers was funded to exploit the observation data. Similar atmospheric pro-filing observation facilities associated with large scien-tific communities emerged in Europe at the end of the 1990s. Several European initiatives were triggered or encouraged through bilateral collaborations between U.S. and European Union (EU) scientists or through participation of EU scientists in ARM projects (e.g., Cabauw observatory in the Netherlands; Palaiseau ob-servatory in France; Jülich observatory in Germany).
Atmospheric profiling observatories provide scientists with the most resolved description of the atmospheric column. In Europe, as in the United States, these ob-servatories have been collecting data every minute daily for more than a decade, allowing links to be established between processes occurring at diurnal or finer temporal scales and phenomenon occurring at climate scales. The limitation of an atmospheric profiling observatory is that it can only document one location of the globe with its specific atmospheric properties. The aerosol distribu-tions, meteorological anomalies, and cloud properties observed at that location are representative of a limited spatial domain. Hence, atmospheric profiling observa-tories are needed at many locations around the globe to cover climatically diverse areas: near coasts, in continental
Corresponding author address: Martial Haeffelin, L’Institut Pierre-Simon Laplace, Palaiseau, 91128, France.
E-mail: [email protected] DOI: 10.1175/AMSMONOGRAPHS-D-15-0045.1 Ó 2016 American Meteorological Society
plains, mountains, and urban environments. The U.S. ARM Program was designed initially to cover three dis-tinct climatic regions (Cress and Sisterson 2016, chapter 5): the Arctic (Alaska), midlatitudes [U.S. southern Great Plains (SGP)], and the tropics [tropical western Pacific (TWP) Ocean]. Atmospheric profiling observa-tories in Europe were developed primarily over the Eu-ropean continent, extending from locations around the Mediterranean Basin to the Arctic, and including coastal, continental, urban, and mountain sites.
The European Commission established several fund-ing mechanisms to develop collaborations between re-searchers in Europe, to promote development of harmonized research infrastructures, and to reduce fragmentation in European research investments. As a result, in the past 10 years Europe was able to build an infrastructure es-sential to a large community of users by harmonizing aerosol, cloud, and trace gas observations across Europe.
As infrastructures, measurement techniques, data in-terpretation algorithms, and scientific expertise de-veloped on both sides of the Atlantic, scientists became interested in the added benefits of collaboration and cross-fertilization between the U.S. ARM Program and EU atmospheric profiling research observatories. To ex-pand investigations beyond existing atmospheric obser-vatories, U.S. ARM scientists and ARM Mobile Facility (AMF) infrastructures participated in field experiments initiated by EU programs. EU and U.S. ARM scientists developed collaborations to harmonize data inter-pretation algorithms and to exploit jointly U.S. and EU observation datasets. Further development of formal collaboration between U.S. ARM and EU programs would enhance the ability of scientists worldwide to take on science challenges about climate change.
This chapter presents several European atmospheric profiling research observatories, development of Euro-pean networking, and the current EuroEuro-pean research infrastructure (section 2). Section 3presents EU pro-gram initiatives of interest for future collaboration with the ARM Program.Section 4highlights collaborations that were developed subsequently between the U.S. ARM Program and its European counterparts. In sec-tion 5, we present an outlook toward future U.S.–EU collaborations around climate change challenges and observations.
2. European atmospheric profiling research observatories
Atmospheric profiling capabilities using active and passive remote sensing were developed as independent national initiatives in several European countries in the 1990s. Meteorological services and research institutes
gathered several remote sensing systems, collocated them, and started to develop capacities to perform continuous measurements of atmospheric profiles and to store data for scientific research (section 2a). Through different initiatives of the European commission, sev-eral projects emerged in the early 2000s to coordinate atmospheric remote sensing activities across multiple European countries (section 2b). At the end of the 2000s, these coordination efforts were taken one step further to create a European research infrastructure initiative dedicated to a Europewide coordination of atmospheric profiling of aerosols, clouds, and trace gases for scientific research (section 2c).
a. National atmospheric profiling research observatories
Atmospheric profiling research observatories (APRO) with remote sensing capabilities were developed in Europe toward the end of the 1990s, a few years after the start of the U.S. ARM Program. Some APROs were developed by National Hydrological and Mete-orological Services and their partners around existing meteorological facilities. Weather observations started in 1905 at the Meteorologisches Observatorium Lin-denberg, now called the Richard Assmann Observatory, which became an atmospheric profiling observatory with remote sensing capabilities operated by the German Weather Service (DWD) in the mid-1990s. Similarly, the Royal Netherlands Meteorological Office (KNMI) founded a meteorological observatory in the early 1970s, which was upgraded in the early 2000s with many remote sensing instruments to become one of the more prom-inent European facilities for atmospheric research. An-other example is the Payerne aerological station of the Swiss Meteorological Institute located in the western part of the Swiss midland.
Other observatories were developed by national re-search communities by bringing together atmospheric and climate scientists, who were experts in different re-mote sensing techniques. Some national research com-munities were connected to the ARM research community through participations in ARM projects or through bilateral collaborations with ARM scientists. This was the case of the SIRTA Observatory near Paris, France, which started from the initiative of a scientist in the 1990s. The development of the site was boosted in the early 2000s through collaboration with ARM scientists and partici-pation in EU networks. Fifteen years later it has become a prominent European facility operating more than 100 sensors from 10 different institutes. In 1975, the National University of Ireland (Galway) established the Atmospheric Research station at Mace Head on the west coast of Ireland. The major observatory has been
used as a background baseline research station for over 50 years. (Aerosol measurements started in 1958 at a location nearby.)
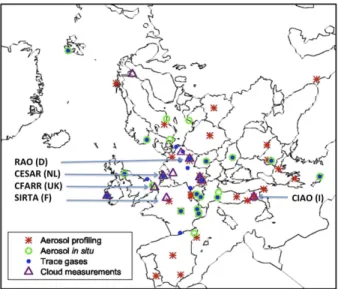
Figure 29-1 shows the geographical distribution of atmospheric observatories in Europe dedicated to aero-sol, cloud, and trace gas monitoring.Figure 29-1 high-lights five prominent European atmospheric research observatories that contribute to many international net-works, like the Baseline Surface Radiation Network (BSRN); the European Aerosol Research Lidar Network (EARLINET); Cloudnet; Aerosols, Clouds, and Trace
Gases Research Infrastructure (ACTRIS) network; and Global Climate Observing System Upper-Air Reference Network (GRUAN). Their facilities, instruments, de-velopments, and activities are presented in the following five subsections.
Atmospheric profiling observation activities in Europe were given a major boost in 1998 when the European Space Agency financed the 1998 Cloud Lidar and Radar Experiment (CLARE’98) field campaign. This campaign involved flying three instrumented aircraft from Ger-many, France, and the United Kingdom equipped with in situ sampling instruments, cloud radar, and lidars over the ground-based 94-GHz cloud radar at the Chilbolton observatory in the United Kingdom. This campaign demonstrated the ability of cloud radars and lidars to infer cloud properties leading to the selection of the joint European–Japanese Earth Clouds, Aerosol and Radiation Explorer (EarthCARE) satellite mission, which is scheduled to be launched in 2017. More recently, na-tional meteorological and atmospheric research commu-nities realized that activities around atmospheric profiling measurement and scientific research exploiting these measurements could be coordinated at regional or national levels, which led to construction of national networks of atmospheric profiling observatories. One example is a German network whose goal is to harmo-nize activities of several observatories around the High Definition Clouds and Precipitation for Climate Pre-diction project [HD(CP)2]. Another example is the French Réseau d’Observatoires pour la Surveillance de l’Eau Atmosphérique (ROSEA), a network of five ob-servatories dedicated to atmospheric water profiling. The geographical distributions of these two national networks are shown inFig. 29-2.
FIG. 29-1. Map of aerosol, cloud, and trace gas profiling and in situ measurement infrastructures in Europe, extending from the Mediterranean Basin to the polar regions (in 2011). Blue arrows indicate the geographical locations of the five European atmo-spheric observatories presented insection 2a.
FIG. 29-2. Geographical locations of (a) German atmospheric profiling research observatories part of HD(CP)2 and (b) French network of observatories for atmospheric water and aerosol profiling, including four observatories in continental France and one on Réunion Island (Indian Ocean).
1) THECABAUWEXPERIMENTALSITE FOR
ATMOSPHERICRESEARCH
The Cabauw Experimental Site for Atmospheric Research (CESAR) observatory is located in the west-ern part of the Netherlands (NL; 51.978N, 4.928E). The site is located close to the sea and to some of the major European industrial and populated areas. The site is exposed to a large variety of airmass types. In 1973, a 213-m-high meteorological mast was built at the Cabauw site for the study of the atmospheric boundary layer (ABL), land surface conditions, and the general weather situation. Also, well-kept observation fields are onsite for micrometeorological observations, including soil heat flux, soil temperatures, and various radiation measure-ments (including a BSRN station). Within a 40-km radius, there are four major synoptic weather stations, ensuring a permanent supporting mesoscale network. Since 2000, remote sensing observations have been performed on clouds, rain, aerosols, and radiation (seeTable 29-1and
Fig. 29-3b). Since 2002 the CESAR Observatory has been a national facility with commitments from eight research institutes and universities.
The CESAR site is used for
d monitoring long-term tendencies in atmospheric
changes;
d studying atmospheric and land surface processes for
climate and weather modeling;
d validating spaceborne observations;
d developing and implementing new measurement
techniques;
d training young scientists at postdoctoral, Ph.D., and
Masters levels.
Selected research highlights are presented inTable 29-2. The observatory is also used by the industry to test new technologies, either for comparison with similar in-struments or for long-term endurance tests. All data are freely available through the CESAR data portal (www. cesar-observatory.nl), which also lists all publications that report on the use of CESAR data.
2) THERICHARDASSMANNOBSERVATORY AND
GERMAN OBSERVATORY NETWORK
The Meteorological Observatory Lindenberg–Richard Assmann Observatory (MOL-RAO) at Lindenberg op-erated by the DWD was originally founded in 1905. Since 1991, the MOL-RAO has been part of the DWD with extensive facilities. MOL-RAO serves as a regional ref-erence station for many international programs and projects (Neisser et al. 2002). MOL-RAO (52.178N, 14.128E) is located in a rural environment dominated by farmland about 60 km to the southeast of Berlin (see
Fig. 29-3aandTable 29-1). The midlatitude site is char-acterized by moderate climate in the transition zone be-tween maritime and continental climate. In addition to the MOL-RAO, several advanced atmospheric profiling sites have become operational in Germany (see Fig. 29-2a). The Jülich Observatory for Cloud Evolution (JOYCE;Löhnert et al. 2014), located in the western-most part of Germany (50.918N, 6.418E, 111 m MSL), was established in 2011 to characterize boundary layer clouds in the environment in which they form and decay. The Environmental Research Station Schneefernerhaus (UFS) is a unique research station located at an eleva-tion of 2650 m in the Bavarian Alps just 300 m below the peak of the Zugspitze mountain (Germany’s highest mountain). Originally set up for atmospheric trace gas measurements, it has now turned into a multipurpose station managed as a virtual institute for altitude, envi-ronment, and climate research by the Bavarian State Ministry of the Environment. Two mobile atmospheric profiling facilities [i.e., Leipzig Aerosol and Cloud Re-mote Observations System (LACROS) by the Leibniz Institute for Tropospheric Research, and the Karlsruhe Institute of Technology’s (KIT) KITCube] were also developed. In total, seven K-band cloud radars operate continuously, giving Germany the world’s densest cloud radar network. Selected MOL-RAO and JOYCE re-search highlights are presented inTable 29-3.
3) THECHILBOLTONFACILITY FOR
ATMOSPHERIC ANDRADIORESEARCH
The Chilbolton observatory, located in Hampshire, United Kingdom (51.148N, 1.448W), was opened in 1967 when the construction of the 25-m dish was completed, and it now hosts the Chilbolton Facility for Atmospheric and Radio Research (CFARR). The S-band 3-GHz Advanced Meteorological Radar (CAMRa) installed on the big dish is the largest fully steerable meteoro-logical radar in the world and is able to probe clouds and storms with unparalleled sensitivity and resolution. In 1980, it provided the first demonstration of improved radar estimates of rainfall by transmitting and receiving pulses alternately polarized in the horizontal and verti-cal (Hall et al. 1984). CFARR now comprises 20 major instruments (Fig. 29-3e), 10 of which are new since 2005, for studying clouds, rainfall, boundary layer processes, and aerosols (seeTable 29-1). Many instruments oper-ate 24–7 including the 35-GHz cloud radar, ceilometer, and microwave radiometer to provide continuous moni-toring of the vertical structure of clouds and aerosol backscatter as part of the Cloudnet activity described in
section 2b. Meteorological instruments include high-resolution rain gauges and disdrometers to measure raindrop spectra. All data are archived at the British
T ABLE 29-1. List of main instrum ents operatin g contin uously at Europ ean observ atories for atmos pheri c profili ng of tempe rature, humid ity, clo uds, aeros o ls, dynami cs, and radiati on. All instrum ents are typical ly fou nd at U.S. ARM sites , excep t aeroso l mult iwavel ength Raman li dars. Instr ume nt MOL -RAO CESAR SIRTA CFAR R CIA O Lindenb erg C abauw Palaiseau Chilb olton Po tenza Aero sol m ultiwav eleng th Ra man lidar — — 355, 532, 1064 nm — 355, 532, 1064 nm 387-, 607-n m R a man 355-d b polariza tio n 387-, 607-nm Ra man 532-d b po larizati on Wate r vap or Ra man or di fferen tial abs orptio n li dar (DIAL ) 408-nm Ram an 408-nm Ra man 408-n m Raman Ra man 408-n m Raman Doppl er cloud rad ar (35 or 95 G Hz) 35-GHz pulse d 3 5 G H z pulsed 95-G Hz frequen cy-modu lated contin uous-wa ve (FMCW ) 35-and 95-GHz pulse d 35-GH z p u lsed La borato ry dev eloped Microw ave T and H profi ler Radiom etrics 20 and 50 G H z HAT PRO 20 and 50 GHz Ra diome ter Ph ysics Gmbh HAT PRO Ra diome trics Radi ometr ics M P3014 20 and 50 GHz MP 1516 A 2 2 and 60 GHz Auto matic back scatter li dar or profi ling ceil omete r Jenop tik CHM 15k 1 CHM 15kx CT7 5 LD4 0 (905 nm) C L31 (905 nm) C T75K (905 nm) CH M15k (106 4 nm) ALS45 0 (355 nm) C H M15 k (106 4 nm) A LS450 (355 nm) CT2 5k (905 nm) Rada r/sod ar 482-M Hz wind pro filer/ RASS sodar/R ASS 1.29 -GHz UHF radar Degre anne L-ban d rad ar — — Wind profi ler Re mtech sodar Lida r win d profi ler 1.5-m m HAL O-Ph otoni cs Strea mline — L e osph ere WLS7 0 H alo photo nics Fo reseen for 2014 D oppler li dar Atm ospheri c rad iosoud ing systems Vaisala RS92 Vaisa la RS92 Mod em M 1 0 — Vaisa la auto sond e; 4 times daily 0000 UTC daily Twi ce dai ly Wee kly Ozon esoundin g Vaisala (Scienc e P u mp) EC C At De Bilt — — Vaisa la MW2 1 Mont hly Mult iwavel ength sun ph otometer Cime l CE-318, PFR Yes C imel C E-318 C E-318 CE -318 340– 1640 nm 340– 1640 nm Surfac e rad iation station Kipp and Z onen (K& Z) CH1, CM22, CG4 (BSRN ) K&Z C H1, C M22, C G 4 (BSR N) K&Z CH1, CM22, CG4 (BSRN ) K&Z CH1, CM21, CMP21, C G 4 K&Z CH1, CM22, C G 4 (B SRN) SW, L W, up, down Surfac e sen sible and laten t heat fluxes Metek USA-1 Yes Met ek sonic Met e k sonic Fo reseen for 2014 LiCor LI7 500 Lic or 7500 Lic or 7500 Surfac e meteo rolog ical st ation 1–99-m m ast Yes In ground, 1–30 m Y e s; man y 1 distrom eters Vaisa la MIL OS520 GPS recei ver JPS Legacy, Ashte ch Z -18 Yes Trim ble RET 9 — Trimb le L1 /L2 with cho kerin gs All-sky imager WSI Yes Ye s TSI-440 JVC ORI ON KY55 -BE StarSh oot AllSk y Cam era II
Atmospheric Data Centre and are publicly available. Papers published from 1996 to 2011 have accrued 2307 citations. CFARR plays an important role in student training and was used by 9 Ph.D. students in 2013. Se-lected scientific highlights and campaigns over the past decade in areas such as cloud overlap, ice cloud physics, mixed-phase clouds, boundary layer dynamics, and volcanic ash are summarized inTable 29-4.
4) THEINSTRUMENTALSITE FORATMOSPHERIC
REMOTESENSINGRESEARCH INPALAISEAU
SIRTA is a French national atmospheric research ob-servatory developed by L’Institut Pierre-Simon Laplace
(IPSL; a research institute in environmental and climate sciences in the Paris metropolitan area) and its partners since the late 1990s (Haeffelin et al. 2005). The observa-tory is operated by staff from Centre National de la Re-cherche Scientifique, Ecole Polytechnique, Université Versailles Saint Quentin, Electricité de France, and Météo-France, and supported by the French Space Agency. SIRTA is located in a semiurban environment, 25 km south of the Paris city center (48.728N, 2.218E; see
Fig. 29-3c). It operates over 100 sensors, monitoring ground conditions, surface fluxes, and profiles of atmospheric constituents and physical processes (seeTable 29-1). Re-search objectives of SIRTA are to develop comprehensive
FIG. 29-3. National atmospheric profiling research observatories in Europe: (a) RAO, Lindenberg, Germany; (b) CESAR, the Netherlands; (c) SIRTA atmospheric research ob-servatory, Palaiseau, France; (d) CNR-IMAA atmospheric obob-servatory, Potenza, Italy; (e) CFARR, United Kingdom.
TABLE29-2. Selected research highlights at the CESAR Observatory.
Theme Highlight description References
Liquid water clouds Microphysical properties of water clouds are retrieved and validated with ground-based shortwave flux measurements.
Brandau et al. (2010),Wang et al. (2011)
KNMI Test Bed Single-column models and LES are confronted with long-term and continuous observations for a statistical evaluation of model performance.
Neggers et al. (2012)
Volcanic ash Optical properties of the Eyjafjallajökull ash cloud were characterized by detailed lidar measurements.
Donovan and Apituley (2013)
Climate model evaluation Aerosol properties in the aerosol–climate model ECHAM5-HAM were evaluated with CESAR data.
long-term atmospheric observations based on remote sensing and in situ sensors to study atmospheric pro-cesses and to analyze regional climate variability. The location of the observatory is designed to study both local/regional-scale processes typical to the urban–rural transition such as the formation mechanisms of gaseous and particulate pollution (Freutel et al. 2013) or the ef-fects of aerosols on fog and shallow cumulus (Haeffelin et al. 2010) under high-pressure situations and larger-scale cloud–aerosol processes associated with baroclinic fronts. The SIRTA database is also geared toward global circulation model and numerical weather prediction model evaluations (e.g.,Cheruy et al. 2013). Atmospheric process studies frequently take advantage of possible ground and satellite remote sensing synergies (e.g.,Protat et al. 2009;Dupont et al. 2010). Selected SIRTA research highlights are presented inTable 29-5.
5) THECNR-IMAA ATMOSPHERIC
OBSERVATORY INPOTENZA
The Institute of Methodologies for Environmental Analysis (IMAA) of the National Research Council of Italy (CNR) runs the CNR-IMAA Atmospheric Ob-servatory (CIAO). CIAO is located in Tito Scalo, 6 km from Potenza, in southern Italy, on the Apennine Mountains (40.608N, 15.728E, 760 m MSL) and less than
150 km from the west, south, and east coasts. The site is in a plain surrounded by low mountains (,1100 m MSL; see Fig. 29-3d). The observatory operates in a typical mountain weather environment strongly influenced by Mediterranean atmospheric circulation, resulting in generally dry, hot summers and cold winters, and is af-fected by a large number of Saharan dust intrusions each year (Mona et al. 2006).
CIAO represents the most equipped ground-based remote sensing station in the Mediterranean Basin for atmospheric profiling (see Table 29-1;Madonna et al. 2011;Boselli et al. 2012). Since 2000, CIAO is collecting systematic observations of aerosol, water vapor, and clouds. The main scientific objective is the long-term measurement for the climatology of aerosol and cloud properties to provide quality-assured measurements for satellite validation (Mona et al. 2009;Wetzel et al. 2013) and model evaluation (Pappalardo et al. 2004;Villani et al. 2006;Meier et al. 2012) and to fully exploit the synergy and integration of the active and passive sensors for the improvement of the atmospheric profiling (Madonna et al. 2010;Mona et al. 2012). CIAO provides access to data, services, and the research facility for conducting measurements campaigns, and instrument testing, with hundreds of users each year. Selected CIAO research highlights are presented inTable 29-6.
TABLE29-3. Selected research highlights at RAO and the German observatory network.
Theme Highlight description References
Reference networks MOL-RAO is the lead center for GRUAN and a WMO– Commission on Instruments and Methods of Observation (CIMO) Lead Centre on process-oriented observations. Furthermore, it contributes to EUMETNET/E-PROFILE, BSRN, Instruments and Methods of Observation Programme (IMOP)/CIMO, GEWEX–Coordinated Enhanced Observation Period (CEOP), and GEWEX Atmospheric Boundary Layer Studies (GABLS).
Engelbart and Steinhagen (2001),
Neisser et al. (2002)
Boundary layer structure At MOL-RAO, intensive campaigns to investigate bound-ary layer structure with additional in situ (including un-manned aerial vehicles) and remote sensing have been carried out, e.g., for entrainment studies. At JOYCE, the typical cumulus cloud-topped boundary layer is analyzed with respect to stability, turbulence, and cloud properties.
Martin et al. (2014),Löhnert et al. (2014)
Snowfall Ground-based remote sensing and in situ measurements used in synergy at the Environmental Station Schneefernerhouse help to characterize the vertical distribution of snowfall necessary for satellite retrieval applications as well as for numerical model evaluation.
Löhnert et al. (2011)
Mobile stations The KITcube consists of in situ and remote sensing systems including a scanningan X-band rain radar. It was deployed fully for the first time on the French island of Corsica during the Hydrological Cycle in the Mediterra-nean Experiment (HyMeX). Together with LACROS, it was deployed within the HOPE campaign a triangle of APROs around JOYCE.
Kalthoff et al. (2013),Bühl et al. (2013)
b. European networks of atmospheric profiling observations
1) TOOLS TO STRUCTUREEUROPEAN ATMOSPHERIC SCIENCE RESEARCH
The EU Framework Programme for Research and Technological Development is the main instrument for funding research in Europe (Defazio et al. 2009). By funding collaborative projects across Europe, the EU Framework Programme contributed significantly to de-velop collaboration between atmospheric research com-munities specializing in profiling atmospheric aerosols, clouds, and radiation in the early 2000s. Three initiatives that allowed construction of durable collaboration on aerosol and cloud profiling across Europe are presented in the three subsections below.
European Cooperation in Science and Technology (COST) is an intergovernmental framework whose goal is to reduce fragmentation in European research in-vestments. COST helps develop cooperation between scientists and researchers across Europe by increasing their mobility through travel funds for meeting and short-term missions. COST Action 720 (2000–06), enti-tled ‘‘Integrated Ground-Based Remote Sensing Sta-tions for Atmospheric Profiling,’’ supported researchers
from 12 countries (Engelbart et al. 2009). The main objective of the action was the development and as-sessment of cost-effective integrated ground-based re-mote sensing stations for atmospheric profiling of wind, humidity, and clouds. It made important contributions to the development of techniques for integrated pro-filing systems. COST Action ES0702 (2008–12), entitled ‘‘European Ground-Based Observations of Essential Variables for Climate and Operational Meteorology’’ (EG-CLIMET), supported researchers from 18 coun-tries. The main objective of the EG-CLIMET action was the specification, development, and demonstration of cost-effective ground-based integrated profiling systems suitable for future networks providing essential atmo-spheric observations for both climate and weather. Following conclusions from the EG-CLIMET action, the European network of national hydrological and meteorological services (EUMETNET) launched a new program called E-PROFILE that will aim at coordi-nating the provision of calibrated aerosol and cloud profiling data from profiling ceilometers across Europe. This EUMETNET initiative will be accompanied by a new COST action (ES1303, 2013–17) entitled ‘‘Towards Operational Ground Based Profiling with Ceilometers, Doppler Lidars and Microwave Radiometers for Im-proving Weather Forecasts’’ (TOPROF). The TOPROF
TABLE29-4. Selected research highlights at the CFARR Observatory.
Theme Highlight description References
EarthCARE algorithm validation CLARE’98 Campaign. Aircraft flights to validate radar/lidar re-trievals of clouds for future EarthCARE mission.
Hogan et al. (2003b)
Rain rates from polarization radar First demonstration of improved rainfall estimates and hydrome-teor identification using polarization diversity radar; these techniques now implemented on operational radars worldwide.
Hall et al. (1984)
Cloud overlap Measurements and parameterization of the degree of overlap of clouds and IWC; results implemented in many climate and weather forecast models worldwide.
Hogan and Illingworth (2000,2003)
Ice cloud physics Doppler radar demonstration that dominant growth mechanism in ice clouds is aggregation.
Westbrook et al. (2010)
Ice particle shattering Demonstration using Doppler lidar that high concentrations of ice particles reported from aircraft are an artifact due to shattering.
Westbrook and Illingworth (2009)
Mixed-phase clouds 95% of ice in clouds warmer than2208C originates via the freezing of liquid supercooled droplets.
Westbrook and Illingworth (2011)
Ice nucleation Observations demonstrating that ice nucleation in supercooled layer clouds is stochastic with a seemingly inexhaustible supply of ice nuclei.
Westbrook and Illingworth (2013)
Boundary layer dynamics Use of Doppler lidar observations of vertical velocity skewness and variance to infer the upward and downward convective forcing in cloud-topped boundary layer.
Hogan et al. (2009b)
Turbulence measurement. Using Doppler lidar observations in the boundary layer to infer turbulent kinetic energy dissipation rates.
O’Connor et al. (2010)
Volcanic ash Monitoring of ash with lidar and photometers during Eyjafjalla-jokull eruption and validation of Met Office dispersion model.
Dacre et al. (2011)
Convective clouds Cloud Storm Initiation Project (CSIP) 2004–05. Large in-ternational experiment based at Chilbolton to study convective cloud initiation.
action aims at developing the procedures to harmonize the provision of data from profiling ceilometers, micro-wave radiometers, and Doppler lidars.
The last decade has shown rapid advancement in ground-based remote sensing instrumentation being first implemented at reference sites with high potential for larger networks. Because the principles and appli-cations of these instruments are not reflected in past and current university curricula, training activities on vari-ous educational levels are required. In addition to training future users, this training also is interesting for small and medium enterprises with growing demand for well-trained personnel. The European Marie Curie Ini-tial Training Network on Atmospheric Remote Sensing (ITARS) aims to bridge the gap between the specialized development of single instruments and atmospheric ap-plications by providing individual training, courses, and summer schools with focus on sensor synergy for early stage and experienced researchers.1
2) THEFP5 CLIWA-NETPROJECT
The Cloud Liquid Water Network (CLIWA-NET) project (2000–03) was initiated in the context of the EU Baltic Sea Experiment (BALTEX). The objectives of CLIWA-NET were to improve parameterizations of cloud processes in atmospheric models with a focus on vertically integrated cloud liquid water path (LWP) and vertical structure of clouds. To achieve this goal, a pro-totype of a European Cloud Observation Network was set up, which consisted of 12 ground-based stations and satellite measurements. Because microwave radiometry is the most accurate way to measure liquid water path, more than 10 different microwave radiometers from European universities and research organizations op-erated successfully during three enhanced observation phases—all part of BRIDGE, the major field experi-ment of BALTEX. Most importantly, the BALTEX BRIDGE Campaign (BBC; Crewell et al. 2004) in-cluded multiple aircraft observations and a microwave intercomparison campaign that served as a baseline to develop an operational microwave radiometer for LWP and thermodynamic profiles (HATPRO; Rose et al. 2005). Methodologies focusing on the evaluation of model-predicted cloud parameters with CLIWA-NET inferred observations were developed and examined in various applications, for example, a statistical evaluation
TABLE29-5. Selected research highlights at the SIRTA Observatory.
Theme Highlight description References
Cloud and fog processes Subsidence and lifting of low stratus clouds can be driven by four different processes: coupling with the surface, changes in cloud-top radiative cooling, drizzle and precipitation rate, or large-scale subsidence.
Dupont and Haeffelin (2008),
Dupont et al. (2012),
Haeffelin et al. 2013
Origin of pollution 1/3 of regional particulate matter concentrations are due to local emissions, while 2/3 originate from continental transport. The pro-portion of the transported contribution increases in situations of high particulate matter concentrations.
Zhang et al. (2013)
GCM parameterization evaluation
Biases in temperature and humidity can be explained by biases in the partition between surface sensible and latent heat, underestimation of boundary layer clouds, and insufficient turbulent transport in the surface layer.
Cheruy et al. (2013)
Boundary layer structure Synergy between lidar backscatter profiles and a Monin–Obukov length classification derived from sonic anemometer measurements to reduce uncertainties in daytime and nighttime mixing-height re-trievals by more than a factor 2 compared to lidar rere-trievals alone.
Haeffelin et al. (2012) Pal et al. (2013) Cimini et al. (2013)
Access to the observatory The SIRTA Observatory provides nearly 1000 accesses per year, where an access is defined as 1 user (researcher, student, visitor) for 1 day. Users access the observatory mainly (50%) in the framework of continuous long-term observation programs but also (25%) for shorter deployments such as field campaigns [e.g., Megacities: Emissions, Urban, Regional and Global Atmospheric Pollution and Climate Effects, and Integrated Tools for Assessment and Mitiga-tion (MEGAPOLI), ParisFog], and 25% for experimental teaching sessions and outreach. Each year more than 2500 student hours of teaching are performed on the observatory.
Freutel et al. (2013) Haeffelin et al. (2010)
1For the first time ever, ARM hosted a summer workshop in
2015 to train graduate students to use data from ground-based remote sensors. The ARM summer workshop was a follow-on activity from the 2014 ITaRS summer school, which included sev-eral ARM principal investigators as instructors.
of LWP (van Meijgaard and Crewell 2005), the repre-sentation of vertically distributed liquid water content (Willen et al. 2005), and comparisons of model-predicted LWP fields with satellite retrieved spatial distributions. Activities to improve temperature and humidity profile retrievals from microwave radiometers were initiated during CLIWA-NET and are described insection 3a.
3) THEFP5 CLOUDNET PROJECT
Originally an EU-funded project running from 2001 to 2005 [Fifth Framework Programme (FP5)], the aim of Cloudnet is to provide a systematic evaluation of clouds in forecast models (Illingworth et al. 2007). This evaluation has been achieved by establishing several ground-based
remote sensing sites within Europe, which, like those of the U.S. ARM Program, are equipped with an array of instrumentation using active sensors such as lidar and Doppler millimeter-wave radar. These ground-based remote sensing sites provide vertical profiles at high spatial and temporal resolution of the main cloud vari-ables used in forecast models, namely cloud cover and cloud ice and liquid water contents. Previously, the ef-forts to improve clouds in forecast models had been hampered by the difficulty of making accurate and continuous observations of clouds. Aircraft studies by their nature provide incomplete spatial and temporal studies, and published papers concentrating on case studies may be atypical.
TABLE29-6. Selected research highlights at CIAO.
Theme Highlight description References
Aerosol Characterization of aerosol optical and microphysical properties using lidar sun photometer and radar measurements. Climatological studies, long-range transport events, Saharan dust outbreaks, plumes from volcanic eruptions and for model evaluation and sat-ellite data validation and integration.
Madonna et al. (2013),
Mona et al. (2012)
Aerosol–cloud interactions Study the variability of aerosol optical properties, relative humidity, updrafts, and downdrafts in broken thin liquid water clouds with the aim to gain a better insight in droplet activation process using Raman lidar, Doppler radar, and microwave radiometer observations.
Rosoldi et al. (2013)
Aerosol transport Analysis of the physical and dynamical processes related to aerosol transport as well the validation of the main transport modeled [Dust Regional Atmospheric Model (DREAM), Navy Aerosol Analysis and Prediction System (NAAPS), HYSPLIT] using advanced lidar observations for different aerosol types (e.g., Saharan, volcanic, biomass burning).
Villani et al. (2006),
Sawamura et al. (2012),
Pappalardo et al. (2013)
Satellite calibration/validation A strategy for EARLINET correlative measurements for CALIPSO has been developed at CIAO, allowing a reliable statistical analysis and validation of CALIPSO data.
Mona et al. (2009),
Pappalardo et al. (2010)
Advanced statistical analysis of atmosphere thermodynamics
General and versatile statistical modeling approach to understand to what extent measurement uncertainty and redundancy are related to environmental factors, height, and distance has been elaborated using data from the main highly instrumented station available worldwide.
Fassò et al. (2014),
Madonna et al. (2014)
Upper-air measurements In situ and ground-based remote sensing measurements in the upper troposphere are routinely performed to assess long-term trends and variability, providing traceable measurements with their uncertainty budget.
Mona et al. (2007)
Access to the observatory CIAO provides nearly 500 physical accesses per year, where an access is defined as 1 user (researcher, student, visitor) for 1 day accessing the infrastructure. CIAO provides also open access to its data ar-chive and to specific services on request. 60% of the access is pro-vided to European and international users through calibration services, data processing services, access to data, and physical access for specific experiments and training activities. International large field campaigns are organized with international partners in the framework of EU and international projects/programs. Access to new users is promoted through dissemination activities (per review articles, presentations at European and international conferences). Access to young scientists is promoted through Marie Curie Actions and European and international schools.
Madonna et al. (2011) www.ciao.imaa.cnr.it
Following the ethos of the ARM Program, these sites have operated continuously for many years in order to gain statistics and sample the full range of weather phenomena. An important aspect of Cloudnet was the involvement of a number of European operational forecast centers in a cooperative effort to evaluate and improve their skill in cloud predictions. These centers provided profiles of cloud properties hourly for the model grid box over the three original Cloudnet ob-serving stations (see map in Fig. 29-1): CESAR (the Netherlands), CFARR (United Kingdom), and SIRTA (France), but more recently extended to MOL-RAO (Germany) and many other sites as discussed insection 3c. The procedure for deriving cloud properties from ground-based observations for evaluating models is not trivial (e.g., seeShupe et al. 2016, chapter 19). Each of the sites has a different mix of instruments, so a crucial part of Cloudnet has been to devise a uniform set of procedures and data formats to enable the algorithms to be applied at all sites and used to test all models. Cloudnet algorithm developments are presented in
section 3a. The core instruments for use in cloud re-trievals at each site are a Doppler cloud radar, a lidar ceilometer, a dual- or multiwavelength microware ra-diometer, and a rain gauge, all operating 24 hours each day. A crucial aspect is to have a common calibration standard for the instruments, so techniques were devel-oped for automatically calibrating cloud lidars (O’Connor et al. 2004) and cloud radar (Hogan et al. 2003a) using the properties of the meteorological targets themselves. The evaluation of the representation of clouds in seven European operational forecast models as reported by
Illingworth et al. (2007)andBouniol et al. (2010)were quite revealing. In 2003, several gross errors in cloud fraction were identified in some models, but analysis of updated models for the year 2004 showed a considerable improvement. However, a common shortcoming of all models was the lack of midlevel cloud and the inability of many models to produce sufficient occasions when there was 100% cloud cover. Results are provided insection 3c.
4) THEFP5ANDFP6 EARLINETPROJECTS
EARLINET was established in 2000 as a research proj-ect funded by the European Commission, within the Fifth Framework Programme, with the main goal to provide a comprehensive, quantitative, and statistically significant database for the aerosol distribution on a continental scale. After the end of this project, the network activity continued based on a voluntary association. The 5-yr (2006–11) proj-ect EARLINET-Advanced Sustainable Observation Sys-tem (ASOS) in the Sixth Framework Programme (FP6), starting on the EARLINET infrastructure, has contrib-uted strongly to optimize the operation of the network.
The network started to perform measurements on 1 May 2000 with 22 lidar stations distributed over 14 European countries. Since then, the network has grown both in number of stations and observational capability. Currently, EARLINET consists of 27 lidar stations: 10 single backscatter lidar stations, 8 Raman lidar stations with the UV Raman channel for independent measure-ments of aerosol extinction and backscatter, and 9 multi-wavelength Raman lidar stations (elastic channel at 1064, 532, and 355 nm; Raman channels at 532 and 355 nm; plus a depolarization channel at 532 nm). (A complete list of stations can be found atwww.earlinet.org. The locations of these stations are shown as red stars inFig. 29-1.)
Lidar observations within the network are performed on a regular schedule of one daytime measurement per week around noon, when the boundary layer is usually well developed, and two nighttime measurements per week, with low background light, in order to perform Raman extinction measurements (Matthias et al. 2004a). In addition to the routine measurements, further observations are devoted to monitor special events such as Saharan dust outbreaks (Ansmann et al. 2003;Papayannis et al. 2008), forest fires (Balis et al. 2003) and volcano eruptions (Pappalardo et al. 2013). Since June 2006, additional measurements have been performed at EARLINET stations in coincidence with CALIPSO overpasses according to a strategy for correlative mea-surements developed within EARLINET (Pappalardo et al. 2010).
Data quality has been assured by instrument inter-comparisons using the reference transportable systems (Matthias et al. 2004b). The quality assurance also in-cluded the intercomparison of the retrieval algorithms for both backscatter and Raman lidar data (Böckmann et al. 2004;Pappalardo et al. 2004). Moreover, ad hoc tools for the continuous quality check of the instruments and algorithms are used regularly.
The EARLINET database is an important source of data that contributes to the quantification of anthropo-genic and bioanthropo-genic emissions and concentrations of aerosols, quantification of their budgets, radiative prop-erties, and prediction of future trends. It contributes therefore to the improvement of the understanding of physical and chemical processes related to aerosols, their long-range transport and deposition, and their interaction with clouds (e.g.,Guibert et al. 2005;Meier et al. 2012). c. Network of networks
Since 2000, significant efforts have been made in Europe to establish research infrastructures and net-works for atmospheric research. However, only in the EU Seventh Framework Programme was a coordinated research infrastructure for these observations established.
The ACTRIS network is an outstanding research infra-structure launched in 2011 that aims to coordinate the European ground-based network of stations equipped with advanced atmospheric probing instrumentation for aero-sols, clouds, and short-lived trace gases. The main objec-tives of ACTRIS are the following:
d To provide long-term observational data relevant to
climate and air quality research on the regional scale produced with standardized or comparable proce-dures throughout the network (Fig. 29-1).
d To provide a coordinated framework to support
trans-national access to large infrastructures (Fig. 29-4) strengthening high-quality collaboration in and out-side the European Union and access to high-quality information and services for the user communities (research, environmental protection agencies, etc.).
d To develop new integration tools to fully exploit the
use of multiple atmospheric techniques at ground-based stations, in particular for the calibration/validation/ integration of satellite sensors and for the improvement of the parameterizations used in global and regional-scale climate and air quality models.
d To enhance training of new scientists and new users in
particular students, young scientists, and scientists from eastern European and non-EU developing coun-tries in the field of atmospheric observation.
d To promote development of new technologies for
atmospheric observation of aerosols, clouds, and trace gases through close partnership with EU small and medium enterprises (SMEs).
A key for ACTRIS success is to build a new research infrastructure on the basis of a consortium joining existing networks/observatories that are already pro-viding consistent datasets of observations and that are performed using state-of-the-art measurement technol-ogy and data processing.
In particular, the ACTRIS consortium merges two existing research infrastructures funded by the Euro-pean Commission under FP6: EuroEuro-pean Supersites for Atmospheric Aerosol Research (EUSAAR) and EARLINET (section 2b). ACTRIS also includes the distributed infrastructure on aerosol interaction existing from the Cloudnet EU research project (section 2b) and by grouping the existing EU ground-based monitoring capacity for short-lived trace gases, which currently is not coordinated at any level—except for the European Monitoring and Evaluation Programme (EMEP) and the Global Atmosphere Watch (GAW) caring for a few specific compounds. Therefore, ACTRIS represents an unprecedented effort toward integration of a distributed network of ground-based stations, covering most cli-matic regions of Europe, and responding to a strong demand from the atmospheric research community. ACTRIS is a step toward better integration of aerosol, cloud, and trace gases communities in Europe necessary to match the integration of high-quality long-term ob-servations of aerosol, clouds, and short-lived gas-phase species and for assessing their impact on climate and environment. ACTRIS outcomes will be used for sup-porting decisions in a wide range of policy areas, in-cluding air quality, health, international protocols, and research requirements.
3. EU program initiatives opening to areas of collaboration with the U.S. ARM Program Projects funded by the European Commission, pre-sented in sections 2b and 2c, allowed European countries to develop and harmonize observation in-frastructures. These projects also allowed important scientific developments by supporting the improvement of retrieval methods and algorithms to derive essential climate variables (section 3a), the reanalysis of long-term atmospheric profiling observations to produce quality controlled and harmonized datasets to study climate variability and related atmospheric processes (section 3b), and the development of frameworks including better tools and methods to evaluate weather forecast and climate prediction models (section 3c).
a. Retrieval algorithm developments
EU research programs associated with atmospheric profiling observatories have focused on the development
of algorithms to retrieve aerosol properties; tempera-ture and humidity profiles; boundary layer height; and cloud properties from radars, lidars, and microwave radiometers. Developments focused on retrievals from sophisticated systems such as multiwavelength Raman lidars and polarized Doppler cloud radars. Recently, low-cost low-power elastic backscatter lidars (profiling ceilometers), profiling microwave radiometers, and continuous-emission cloud radars became available. In Europe alone, several hundred profiling ceilometers are gathering aerosol and cloud backscattering data con-tinuously as national weather services started to build up networks of ceilometers (e.g.,Flentje et al. 2010). About 30 microwave profilers are also available, and the po-tential for low-cost continuous-emission cloud radar networks to develop is high. Hence research develop-ments now also focus on assessing the performance of the low-cost instruments and developing specific re-trieval algorithms.
1) AEROSOL PROFILE RETRIEVALS
Detailed knowledge of optical, microphysical, and radiative properties of aerosol particles is required to understand their role in atmospheric processes as well as their impact on human health and the environment (Forster et al. 2007). The properties must be monitored as a function of time and space, where the vertical dimension is of particular importance because of high variability. Lidar techniques are ideal for collecting range-resolved data for the characterization of aerosol particles.
EU programs such as EARLINET and ACTRIS pro-vided collaboration frameworks within Europe and strongly supported developments of multiwavelength Raman lidar. These programs also motivated algo-rithm developments to retrieve aerosol optical prop-erties (backscatter and extinction profiles) as well as microphysical properties (size, shape) and types from Raman lidars. Recent developments now take advan-tage of the synergy between multiwavelength measure-ments of lidars and sunphotometers, as illustrated in
Fig. 29-5. Examples of developments are presented in
Table 29-7.
EU COST actions such as EG-CLIMET and TOP-ROF also provided useful collaboration frameworks to exploit existing, yet underexploited, low-power auto-matic backscatter lidars and profiling ceilometers (ALCs). Following spring 2010 when air traffic was disrupted in Europe because of the presence of volcanic ash plumes (e.g., Pappalardo et al. 2013), a renewed interest was gained in the potential of ALCs to retrieve aerosol properties. Techniques for calibrating ALCs and for retrieving backscatter profiles from ALCs developed in the framework of EU programs are presented in
Table 29-7.
2) TEMPERATURE AND HUMIDITY PROFILE RETRIEVALS
Tropospheric temperature and humidity are basic meteorological quantities that determine atmospheric stability. Therefore thermodynamic profiling with high
FIG. 29-5. (left) Time evolution of the lidar range-corrected signal at 1064 nm as measured at CIAO on 4 Sep 2011 during a Saharan dust outbreak. (right) Corresponding mass concen-tration profiles for fine (blue) and coarse particles, both spherical (green) and spheroid (red) as retrieved using collocated multiwavelength backscatter (355, 532, and 1064 nm) and de-polarization (532 nm) lidar and sky-scanning radiometer observations. Dashed white lines in (left) indicate the time window for the retrieval reported in (right) (2330 UTC 4 Sep– 0107 UTC 5 Sep).
temporal and spatial resolution is of high importance for many applications in atmospheric sciences, such as ini-tialization of weather forecasting, model evaluation, and process studies. Radiosonde soundings can provide high vertical resolution profiles along the balloon trajectory but are limited to time intervals of typically 12 h. Thefore, continuous profile observations by unattended re-mote sensing instruments are of high interest (Carbone et al. 2012) but suffer some drawbacks in vertical reso-lution and accuracy.
Microwave radiometry is commonly used to derive temperature and humidity profiles from brightness temperature (BT) measurements by applying regression-based retrieval algorithms relying on a comprehensive prior dataset. BT measurements typically in zenith di-rection are made at several frequencies along absorption complexes, that is, water vapor and oxygen, requiring a good knowledge on atmospheric absorption character-istics. Kadygrov and Pick (1998) introduced a single frequency technique for boundary layer temperature profiling where different opacities are realized via dif-ferent elevation angles. To improve accuracy and vertical resolution multifrequency and multiangle measurements can be combined (Crewell et al. 2009). A major advan-tage of microwave radiometer retrievals is that they are mostly independent on the occurrence of clouds, except for cases of heavy precipitation where saturation effects may occur or when the measurement is influenced by rainwater on the microwave radiometer radome. Infrared spectrometers also can provide thermodynamic profiles but are limited to clear-sky conditions where they are more accurate than the microwave retrievals (Löhnert et al. 2009; Fig. 29-6). However, in the lowest 500-m microwave-derived temperature profiles, derived from elevation scans are as accurate as the infrared retrievals. To optimally exploit the information content of micro-wave radiometers, variational techniques that combine BT measurements with a priori knowledge and/or auxiliary
information have been developed for physically con-sistent temperature and humidity profiling (Hewison 2007; Cimini et al. 2006). Table 29-8 presents tem-perature and humidity profile retrieval methods based on microwave radiances developed in the framework of EU programs. Further developments through col-laboration with the ARM Program are presented in
section 4b.
3) MIXING-HEIGHT RETRIEVALS
The atmospheric mixing height is the height of the layer adjacent to the ground over which constituents emitted within this layer or entrained into it become vertically dispersed by convection or mechanical tur-bulence within a time scale of about one hour (Seibert et al. 2000). During daytime the mixing layer tends to be unstable as a result of convection and is capped by an entrainment zone. At night a shallow stable layer forms near the surface in which mixing occurs through in-termittent turbulence, leaving a residual layer above. Mixing height is a necessary parameter to relate boundary layer concentrations of gases to upstream fluxes and to scale dispersion of trace gases and aero-sols for air quality applications.
As pointed out inSeibert et al. (2000), there is no ‘‘mixing-height meter’’ able to determine the mixing height without uncertainties and assumptions. Further-more, the definitions of mixing layer depend on the geophysical quantity employed in the definition. Be-cause of the importance of this parameter, in the past 20 years, no less than five EU COST actions were at least partially dedicated to better understanding and im-proving mixing-height retrieval techniques.Table 29-9
provides references to retrieval methods based on radio sounding, lidar, sodar, radar, and microwave radiome-ters derived in the framework of EU COST actions. The use of instrument synergy allows objective retrievals to be developed as illustrated inFig. 29-7(Pal et al. 2013).
TABLE29-7. Retrieval methods of aerosol properties developed in EU programs. Retrieved variables Input data References Backscatter coefficient
(from ceilometers)
Ceilometer-attenuated backscatter profile and optical depth from sunphotometer
O’ Connor et al. (2004),Markowicz et al. (2008),Flentje et al. (2010),Heese et al. (2010),Morille et al. (2007),Wiegner and Geiß (2012),Wiegner et al. (2014)
Aerosol backscatter and extinction
Raman lidar Ansmann et al. (1990,1992)
Microphysical properties Multiwavelength Raman lidars Müller et al. (1999),Veselovskii et al. (2002),Böckmann et al. (2005),Ansmann et al. (2012)
Microphysical properties and aerosol typing
Multiwavelength Raman lidars and sun photometers
Müller et al. (2004,2007),Wiegner et al. (2008),Gasteiger et al. (2011),Mona et al. (2012),Chaikovsky et al. (2012),Pappalardo et al. (2013),Wagner et al. (2013),Lopatin et al. (2013)
Giant aerosol Multiwavelength Raman lidars and millimiter-wavelength radars
The multi-instrument retrieval techniques could be of interest to derive mixing heights over ARM sites.
4) CLOUD PROFILE RETRIEVALS
Cloud property retrievals derived from cloud radars and lidars were developed in the framework of the EU Cloudnet project (presented insection 2b). These retrieval algorithms use continuous observations by millimeter-cloud radars, lidar ceilometers, microwave radiometers, and rain gauges to derive values of cloud fraction, ice, and liquid cloud water content (Illingworth et al. 2007). The overall retrieval framework consists of two steps, with the target classification being performed first fol-lowed by the microphysical retrievals. The retrieval al-gorithms were chosen based on their ability to be applied robustly to long periods of data with well-characterized errors. The first step in processing is to perform 30-s averaging from each site with the in-strument vertical resolution of 30 or 60 m, followed by
classifying the target in terms of liquid cloud, ice cloud, rain, aerosol, insects, and combinations thereof. The target classification then guides the retrieval of ice and liquid water content at the instrument resolution. Values of cloud fraction, liquid water content, and ice water content (seeTable 29-10for details) are derived and then averaged onto the vertical grid of each forecast model, and also averaged in time by an amount equivalent to the horizontal resolution of the model given the profile of wind speed. Application of this retrieval scheme to ARM Program measurements is presented insection 4c.
As well as being used for model evaluation, the target classification and microphysical retrievals have been used to study cloud processes. For example, the identi-fication of supercooled water clouds has been used in an analysis (Fig. 29-8) of four years of data at Chilbolton to reveal that 95% of ice forming at temperatures warmer than2208C originates via the freezing of liquid drops in supercooled clouds.
FIG. 29-6. Histograms of the number of degrees of freedom for (left) temperature and (right) humidity retrievals at the (top) Payerne and (bottom) Darwin sites. The different shading indicates the retrieval methods: microwave radiometer zenith only (MZ) in green horizontal lines, microwave radiometer with variable elevation angles (ME) in green slanted lines, and Atmospheric Emitted Radiance Interferometer (AE) in red.
5) SYNERGETIC LIQUID CLOUD PROFILE RETRIEVALS AND BLIND TEST INITIATIVE
State-of-the-art liquid cloud profile retrievals typically use information from cloud radar, microwave radiome-ter (MWR) and lidar to retrieve liquid cloud parameradiome-ters like liquid water content, cloud droplet number con-centration (N), effective radius (Reff), and cloud optical
depth (COD). Various methods to retrieve these prop-erties exist and may differ in the measurements used and assumptions made. Some methods combine cloud radar and MWR information, for example, the Technical University Delft Remotely-Sensed Cloud Property Profiles (TUD-RSCCP) algorithm (Brandau et al. 2010) or the integrated profiling technique (IPT;Löhnert et al.
2004;Löhnert et al. 2008). In contrast to TUD-RSCCP
TABLE29-8. Retrieval methods of temperature and humidity profiles developed in EU programs.
Retrieved variables Input data References
Temperature profile (by micro-wave radiometry)
Brightness temperatures at several frequencies along 60-GHz oxygen absorption complex taken in zenith direction
Westwater et al. (2005)
Temperature profile with improved vertical resolution in boundary layer (by microwave radiometry)
Brightness temperatures taken at several elevation angles along 60-GHz oxygen absorption bands
At a single frequency Kadygrov and Pick (1998)
At several frequencies Löhnert and Maier (2012)
Humidity profile (by microwave radiometry)
Brightness temperatures at several frequencies along water vapor absorption bands
22-GHz water vapor line Güldner and Spänkuch (2001)
183-GHz water vapor line (dry conditions) Ricaud et al. (2010)
Temperature and humidity pro-filing (by infrared
interferometry)
Spectral infrared radiance in different bands, spectral ob-servations: 612–713 and 2223–2260 cm21(i.e., 15- and 4.3-mm CO2bands, respectively) for temperature
pro-filing; 538–588 and 1250–1350 cm cm21for water vapor
Spänkuch et al. (1996)
Temperature and humidity profiles (1D VAR method)
Brightness temperatures along 22.235-GHz water vapor absorption and 60 GHz, ambient temperature and hu-midity, infrared temperature
Hewison (2007) Cimini et al. (2006)
Temperature and humidity pro-files, LWC (IPT method)
Brightness temperatures along 22.235-GHz water vapor absorption and 60-GHz oxygen absorption complex, cloud radar reflectivity profile
Löhnert et al. (2008)
TABLE29-9. Mixing-height retrieval methods developed in EU programs.
Retrieved variables Input data References
Mixing height from numerical model output Parameterizations in meteorological preprocessors
COST Action 710
Fisher et al. (1998),Seibert et al. (2000)
Mixing height from measurements Radiosonde profiles, sodar, and wind profiler measurements
COST Action 710
Seibert et al. (2000)
Urban mixing height from numerical model output and measurements
Mesoscale numerical simulations COST Action 715 Radiosonde profiles and sodar
measurements
Fisher et al. (2001) Piringer et al. (2007)
Mixing height from surface-based remote sensing
Sodar, radar, and lidar profiling measurements
Emeis et al. (2008)
Mixing height traced by aerosols Attenuated backscatter profiles mea-sured by automatic lidars and ceilometers
COST Action ES0702
[Structure of the Atmosphere (STRAT) methods]
Backscatter profiles alone Haeffelin et al. (2012)
Backscatter and surface stability condi-tions derived from sonic anemometers
Pal et al. (2013)
Mixing height traced by temperature profilers Microwave radiometer temperature profiles
COST Action ES0702 Microwave brightness temperatures Cimini et al. (2013)
Mixing-height dynamics using Doppler lidar Vertical velocity profiles and velocity variance profiles
Barlow et al. (2011)
Boundary layer types Vertical velocity profiles and velocity variance profiles
and IPT, the synergistic remote sensing of cloud (SYRSOC) algorithm (Martucci and O’Dowd 2011;
Martucci et al. 2012) also makes use of lidar observations (seeTable 29-11for more information on the algorithms). Within the EG-CLIMET COST action (http://www.cost. eu/COST_Actions/essem/ES0702), the above-listed al-gorithms were assessed thoroughly via an observing system simulation experiment (OSSE). Using synthetic observations based on scenes from cloud-resolving model output, an independent evaluation of the different re-trieval algorithms was conducted. All methods are very sensitive to the correct description of the cloud bound-aries and the correct discrimination between cloud droplets and precipitation. The accuracy of the SYRSOC liquid water content depends on the accuracy of the re-trieved lidar extinction. For nonprecipitating cases, the TUD-RSCCP method provides the best results with ac-curacy in liquid water content of;15% (Fig. 29-9). In precipitating cases, drizzle drops dominate the radar re-flectivity factor signal resulting in an overestimation (underestimation) of the effective radius (droplet num-ber concentration). However, both IPT and TUD-RSCCP still provide robust results for the liquid water content with errors in the range of 20%–50%.
During the EU–DOE Ground-Based Cloud and Precipitation Retrieval Workshop, which took place on
13–14 May 2013 in Cologne, it was decided that an ex-tended experiment within the same framework that would also include DOE ARM retrieval algorithms would be conducted in the future.
b. Long-term climate datasets
Atmospheric profiling observatories are useful for modeling applications and climate studies, in particular because local processes can be used to explain the sea-sonal and interannual variability of climate (e.g.,
Chiriaco et al. 2014). Nevertheless, climate trends or variability cannot be detected in a dataset if the climate signal is less than the measurement biases. These biases must be reduced using specific procedures. The data from each APRO must be reprocessed carefully to in-clude better quality control and better retrieval algo-rithms, to make use of instrument synergy, to reduce biases, and to evaluate uncertainties and spatial repre-sentativeness. Further, APRO data must be harmonized in temporal and vertical grids and must follow naming conventions and commonly adopted user-friendly for-mats. This work consists in reanalyzing the original data to reach a high level of harmonization and standardization. Ad hoc activities within the U.S. and European at-mospheric observation communities have been initiated to produce comprehensive datasets of clouds, radiation,
FIG. 29-7. Ceilometer-attenuated backscatter gradients (black circles, red circles, and green stars); cloud-base height (blue stars); attributed mixing height (black line); air temperature (blue line); sunrise (SR) and sunset (SS)—vertical blue solid lines; early morning transition (EMT) and early evening transition (EET)—vertical blue dashed lines. Parameters are derived from lidar-attenuated backscatter and sonic anemometer measurements at the SIRTA Observatory.
TABLE29-10. Retrievals of cloud profiles developed in the EU Cloudnet program.
Retrieval variables Input data References
Cloud fraction Cloud radar, ceilometer; fraction of pixels in model grid box classified as cloud
Illingworth et al. (2007)
LWC Cloud radar and ceilometer for cloud top and base: assume linear LWC with height scaled to agree with water path from radiometer
Illingworth et al. (2007)
IWC Cloud radar reflectivity corrected for attenuation by LWC and humidity Hogan et al. (2006)
and atmospheric profiles for driving and evaluating large-eddy simulation (LES) models, for assessing cli-mate model simulations and NWP forecasts, and for performing climate studies and climate feedback ana-lyses. The U.S. ARM Program developed a dataset specifically designed for modelers to evaluate climate models. This dataset, called ARM Climate Modeling Best Estimate (CMBE; Xie et al. 2010), consists of a dozen cloud and radiation quantities provided as hourly averages, standard deviations within each hour, and quality control flags to qualify data quality and temporal
variability. CMBE products were derived from data at each ARM observation facility.
In Europe, a similar initiative was started in the frame of the European Union Cloud Intercomparison, Process Study and Evaluation (EUCLIPSE) Project (seesection 3c). A dataset was developed from data gathered at the observatories of CESAR (only EUCLIPSE period for now), CFARR (only EUCLIPSE period for now), and SIRTA (all the available period, starting in 2002 for the earliest observations). The European Climate Testbed Dataset (ECTD) includes meteorological parameters, cloud and surface fluxes parameters, and instrument observables. For each parameter, a retrieval algorithm was identified to harmonize data interpretation across the three observatories. A quality control procedure was developed for each parameter. Spatial representative-ness was evaluated over a 50-km domain around the observatory using observations from standard meteo-rological stations. Similarly to the CMBE dataset, ECTD provides data as hourly averages, standard de-viations within each hour, and quality control flags to qualify data quality and temporal and spatial variability. Data files are in netCDF format, which includes all necessary metadata associated with each parameter. An important feature is that the ECTD data nomenclature (names of geophysical variables) is made consistent with the ARM CMBE nomenclature and the nomenclature used by CMIP5 climate models. A description of the ECTD of the SIRTA Observatory is provided inCheruy et al. (2013)andChiriaco et al. (2014), including a de-scription of the quality control procedure.Table 29-12
provides the content of the SIRTA file (available online athttp://sirta.ipsl.polytechnique.fr/sirta.old/reobs.html). EU and U.S. scientists have recognized that there is a strong need to have these activities coordinated in a better way so that U.S. and EU datasets have common retrieval methods, data formats, naming conventions, common grids, etc. This coordination would help in-crease the number of studies that make combined use of EU and U.S. APRO datasets. As suggested during the
FIG. 29-8. The fraction of ice clouds containing liquidlike layers as a function of cloud-top temperature derived from four years of continuous observations at CFARR. To test the sensitivity of the identification of supercooled water and ice from radar and lidar observations, the diamonds are for data when the dBZ radar threshold was increased from220 to 210 dBZ to ensure that no liquid droplet clouds are being diagnosed as containing ice. The triangles are for cases when the presence of ice was confirmed by specular reflection from oriented ice particles.
TABLE29-11. Liquid cloud retrievals that participated in the OSSE within the EG-CLIMET COST Action.
Retrieved variables Input data References
LWC, N, Reff, COD, aerosol
indirect effect index
Lidar extinction profile, T and q profiles from MWR, LWP from MWR, Z and linear depolarization ratio (LDR) from cloud radar
SYRSOC (Martucci and O’Dowd 2011;
Martucci et al. 2012) LWC T and p profiles, LWP from MWR, Cloudnet
classification product
Cloudnet scaled-adiabatic LWC (Illingworth et al. 2007) LWC, N, Reff, COD Z from cloud radar, cloud base from lidar,
LWP from MWR
TUD-RSCCP (Brandau et al. 2010) LWC, LWP, T, and q profiles Z from cloud radar, brightness temperatures
from MWR, prior information on LWC, T, and q profiles