HAL Id: hal-00565216
https://hal.archives-ouvertes.fr/hal-00565216
Submitted on 2 Dec 2019
HAL is a multi-disciplinary open access
archive for the deposit and dissemination of
sci-entific research documents, whether they are
pub-lished or not. The documents may come from
teaching and research institutions in France or
abroad, or from public or private research centers.
L’archive ouverte pluridisciplinaire HAL, est
destinée au dépôt et à la diffusion de documents
scientifiques de niveau recherche, publiés ou non,
émanant des établissements d’enseignement et de
recherche français ou étrangers, des laboratoires
publics ou privés.
Stéphane Mazières, Sidia Maria Callegari-Jacques, Shaiane Crossetti,
Jean-Michel Dugoujon, Georges Larrouy, Etienne Bois, Eric Crubézy, Mara
Hutz, Francisco Mauro Salzano
To cite this version:
Stéphane Mazières, Sidia Maria Callegari-Jacques, Shaiane Crossetti, Jean-Michel Dugoujon, Georges
Larrouy, et al..
French Guiana Amerindian demographic history as revealed by autosomal
and Y-chromosome STRs..
Annals of Human Biology, Taylor & Francis, 2011, pp.38(1):76-83.
�10.3109/03014460.2010.492793�. �hal-00565216�
HAL Id: hal-00565216
https://hal.archives-ouvertes.fr/hal-00565216
Submitted on 2 Dec 2019
HAL is a multi-disciplinary open access
archive for the deposit and dissemination of
sci-entific research documents, whether they are
pub-lished or not. The documents may come from
teaching and research institutions in France or
abroad, or from public or private research centers.
L’archive ouverte pluridisciplinaire HAL, est
destinée au dépôt et à la diffusion de documents
scientifiques de niveau recherche, publiés ou non,
émanant des établissements d’enseignement et de
recherche français ou étrangers, des laboratoires
publics ou privés.
revealed by autosomal and Y-chromosome STRs.
Stéphane Mazières, Sidia Maria Callegari-Jacques, Shaiane Crossetti,
Jean-Michel Dugoujon, Georges Larrouy, Etienne Bois, Eric Crubézy, Mara
Hutz, Francisco Mauro Salzano
To cite this version:
Stéphane Mazières, Sidia Maria Callegari-Jacques, Shaiane Crossetti, Jean-Michel Dugoujon, Georges
Larrouy, et al..
French Guiana Amerindian demographic history as revealed by autosomal
and Y-chromosome STRs..
Annals of Human Biology, Taylor & Francis, 2011, pp.38(1):76-83.
�10.3109/03014460.2010.492793�. �hal-00565216�
Jean-Michel Dugoujon, Georges Larrouy, Etienne Bois, Eric Crubezy, Mara Helena Hutz & Francisco Mauro Salzano
Article title: French Guiana Amerindian demographic history as revealed by autosomal and Y-chromosome STRs
Article no: 492793
Dear Author,
Please check these proofs carefully. It is the responsibility of the corresponding author to check against the original manuscript and approve or amend these proofs. A second proof is not normally provided. Informa Healthcare cannot be held responsible for uncorrected errors, even if introduced during the composition process. The journal reserves the right to charge for excessive author altera-tions, or for changes requested after the proofing stage has concluded.
The following queries have arisen during the editing of your manuscript and are marked in the mar-gins of the proofs. Unless advised otherwise, submit all corrections using the CATS online correc-tion form. Once you have added all your correccorrec-tions, please ensure you press the “Submit All Corrections” button.
Q1 Please abbreviate journal title.
Q2 All authors needed.
Q3 All authors needed.
Q4 What is this?
Q5 Please abbreviate journal title.
Q6 What is this?
Q7 All authors needed.
Q8 All authors needed.
Q9 All authors needed.
Q10 Define bold within table.
Q11 A declaration of interest statement reporting no conflict of interest has been inserted. Please confirm whether the statement is accurate.
Q12 We have inserted a running head. Please approve or provide an alternative running head. Q13 Please check that the author names and affiliations have been set correctly.
ORIGINAL ARTICLE
French Guiana Amerindian demographic history
as revealed by autosomal and Y-chromosome STRs
STEPHANE MAZIERES
1, SIDIA MARIA CALLEGARI-JACQUES
2,3,
SHAIANE GOULART CROSSETTI
2, JEAN-MICHEL DUGOUJON
1,
GEORGES LARROUY
1, ETIENNE BOIS
1, ERIC CRUBEZY
1,
MARA HELENA HUTZ
2& FRANCISCO MAURO SALZANO
21
Laboratoire AMIS Anthropologie Mole´culaire et Imagerie de Synthe`se, CNRS FRE2960, Universite´ Paul Sabatier, 31073 Toulouse, France,2Departamento de Gene´tica, Instituto de Biocieˆncias,
Universidade Federal do Rio Grande do Sul, 91501-970 Porto Alegre, RS, Brazil, and3Departamento de Estatı´stica, Instituto de Matema´tica, Universidade Federal do Rio Grande do Sul, 91501-970 Porto Alegre, RS, Brazil
Q13
(Received 24 November 2009; accepted 4 May 2010)
Abstract
Background: Previous investigations of French Guiana Amerindians performed by this group included blood group and protein genetic markers, mitochondrial DNA and Y-chromosome investigations. Molecular autosomal data and more extensive Y-chromosome determinations were lacking.
Subjects and methods: The genetic variability of 15 autosome (ASTRs) and 17 Y-chromosome (YSTRs) microsatellite loci was studied in four French Guiana (Emerillon, Palikur, Wayampi, Kali’na) and one Brazilian (Apalai) Amerindian populations. A sixth group, the Peruvian Matsiguenga of the Maipurean linguistic family, was included in the data analysis since they could provide information about the past migration of people from that linguistic stock into northeastern Amazonia.
Results: Marked ASTR and YSTR variability was found, with 96% of the YSTR haplotypes being found in one population only. There was excellent agreement between the present and previous autosomal or uniparental results. Multidimensional scaling based on FSTgenetic distances and population structure
analysis revealed heterogeneity in gene distribution, with a clear difference between the Matsiguenga and Emerillon and the other groups. In the latter, Wilcoxon sign-rank test between observed and expected heterozygosity and the mode of allele frequency distribution revealed clues of a significant past genetic bottleneck. The Wayampi stand genetically closer to the Apalai, Palikur and Kali’na when examined for the autosome but not the Y-chromosome panel of markers, suggesting preferential female gene flow.
Conclusion: The new data provided additional important information about the biological history of people from a remote South American region, indicating how gene diversity analyses can be used to increase understanding of human microevolutionary processes.
Keywords: French Guiana, Amerindians, microsatellites, bottleneck events
Correspondence: Ste´phane Mazie`res, Laboratoire AMIS, Faculte´ de Me´decine de Purpan, 37 alle´es Jules Guesde, 31073 Toulouse, France. Tel: þ33 (0) 5 6114 5987; Fax: þ33 (0) 5 6114 5979; E-mail: stephanemazieres@voila.fr
ISSN 0301-4460 print/ISSN 1464-5033 online DOI: 10.3109/03014460.2010.492793
Annals of Human Biology, 2010; 00(0): 1–13
1 2 3 4 5 6 7 8 9 10 11 12 13 14 15 16 17 18 19 20 21 22 23 24 25 26 27 28 29 30 31 32 33 34 35 36 37 38 39 40 41 42 43 44 45 46 47 48 49
Introduction
French Guiana is located in South America approximately between latitudes 28 and 5850’ North and longitudes 51830’ and 54840’ West, on the eastern part of the vast Guiana Plateau that straddles Venezuela, northern Brazil and the three Guianas, which consist of the former Dutch and British colonies and the present French department. The French Guianan region is made up of a Precambrian insular shelf mostly covered by Amazonian rainforest bordered by littoral sandy savannah and mangrove swamps.
The coastal part of this apparently harsh environment was settled as early as 100 AD by members of the Maipurean branch of the Arawak linguistic family, followed by Karib-speaking populations circa 900 AD (Grenand and Grenand 1985; Rostain 1994). The Maipure originated from northern Peru, the Karib from either Venezuela, the Guiana Plateau or even the upper Xingu (Urban 1992; Campbell 1997). Later, between the 15thand 19th centuries, populations of the Tupi-Guarani linguistic family moved into the French Guiana hinterland from the south, completing the radial diffusion of the Tupi linguistic stock which may have started at the southern rim of the Amazon river (Campbell 1997; Marrero et al. 2007).
Historical observations of the coastal groups by Europeans date from the turn of the 17th century (1606), but it took a century for them to meet the hinterland populations (1720). At the time of contact, no less than 20 Amerindian ‘nations’ were identified (Hurault 1965). Currently, six Amerindian populations of three linguistic stocks live in French Guiana: Palikur and Arawak-Lokono (Maipurean), Kali’na and Wayana (Karib), Emerillon and Wayampi (Tupi-Guarani) (Nimuendaju´ 1926; Grenand and Grenand 1985; 1987). These populations are geographically close to the Brazilian Apalai, another Karib-speaking group that merged with a portion of the French Guianan Wayana during the 19thcentury (Salzano et al. 1988). Today the Palikur and Arawak-Lokono represent the most eastern Maipurean-speaking tribes of South America, deriving from people of the Arawak linguistic phylum that may have spread into the northern part of South America from the Peruvian Andean foothills , 3000 years ago (Campbell 1997).
Previous genetic studies of French Guiana and related Amerindian populations have shown interesting features. The Karib tribes present lower inter-population genetic distances than the Tupi-Guarani, probably due to the fact that their higher effective population sizes would have prevented genetic drift (Callegari-Jacques and Salzano 1989). Among the Tupi-Guarani, the Emerillon seem to have suffered genetic drift effects due to small population size (Mazie`res et al. 2009). Additionally, data from previous genetic systems (i.e. red cell and serum proteins, the first region of the hypervariable segment of mitochondrial DNA and eight Y-chromosome SNPs) have suggested a two-stage peopling of French Guiana, starting in the littoral and then moving into the hinterland (Mazie`res et al. 2007; 2008; 2009).
STR data have proved to be very informative for studies of Amazonian Native populations (Dos Santos et al. 2009). On the other hand, little genetic information has been obtained for the specific male fraction in the area of our interest, besides the knowledge that Amerindians display few polymorphisms for the major Y-chromosome lineages (Ruiz-Linares et al. 1999; Bortolini et al. 2003).
To scrutinize the patterns of Amerindian peopling in the northeastern corner of Amazonia we investigated 15 autosomal and 17 Y-chromosome short tandem repeat polymorphisms (ASTRs, YSTRs) in four French Guianan (Emerillon, Palikur, Wayampi and Kali’na) and two related (Brazilian Apalai and Peruvian Maipurean-speaking Matsiguenga) Amerindian populations. The results were compared with previously obtained uni- and biparental data from the same populations, and the following questions were addressed: (a) Are the data
108 109 110 111 112 113 114 115 116 117 118 119 120 121 122 123 124 125 126 127 128 129 130 131 132 133 134 135 136 137 138 139 140 141 142 143 144 145 146 147 148 149 150 151 152 153 154 155 156
consistent regardless of their mode of inheritance? (b) To what extent is the population structure compatible with geographical, linguistic or historical data? and (c) Can we infer the main patterns of Amerindian peopling in that Amazonian region?
Subjects and methods
Population sampling and pedigree recording
Q12
The present study includes samples of the Emerillon from the margins of the Camopi and Tampock tributaries (median point: 38N, 53810W), the Wayampi from the margins of the mid and lower Oyapock river (3810’N, 52820’W), the Palikur from a place near the Oyapock estuary (48N, 51845’W) and the Kali’na who live in a region between the Mana and Maroni mouths (5844’N, 53855W). Additional Brazilian (Apalai: 1810’N, 54850’W) and Peruvian (Matsiguenga: 128S, 72830’W) populations complete our population data set. All samples were collected during the 1964 – 1985 missions, led by three of us (G.L., E.B. and F.M.S), under the auspices of the Centre National de la Recherche Scientifique (Centre d’Hemotypologie, Toulouse, France), Institut National de la Sante´ et de la Recherche Me´dicale, Universidade Federal do Rio Grande do Sul, and Fundac¸a˜o Nacional do Indio (FUNAI) who gave permission to contact the Brazilian Apalai. All blood samples were collected into vacutainers containing EDTA or ACD anti-coagulants and conserved in isothermal boxes at 48C. Simultaneously with the sample collections, individuals were questioned about their pedigree and clan membership. Genealogical trees were then sketched so that relatives could be traced as far back as three generations on average.
Laboratory determinations
Using pedigree records, unrelated family founders were preferentially analysed because they would provide a more representative sample of the population studied. Additionally the researcher who performed most of the determinations (S.M.) was typed for the studied genetic markers to detect possible sample contamination.
A total of 30 Emerillon, 30 Palikur, 29 Wayampi and 23 Kali’na from French Guiana, 26 Apalai from northern Brazil and 29 Matsiguenga from southern Peru were screened for the 15 (CSF1PO, D2S1338, D3S1358, D5S818, D7S820, D8S1179, D13S317, D16S539, D18S51, D19S433, D21S11, TH01, FGA, TPOX and vWA) autosomal STR loci identified by the commercial AmpF‘STRw IdentifilerwPCR Amplification kit (Applied Biosystems,
Darmstadt, Germany). Population descriptions and geographic locations have been presented in Mazie`res et al. (2007; 2008). All DNA amplifications and genotyping were performed at the Departamento de Gene´tica of the Universidade Federal do Rio Grande do Sul (Porto Alegre, Brazil) following the kit user manual instructions. Length fragments were amplified in single reactions for all 15 loci using fluorescently labelled primers in a GeneAmp PCR System 9600 thermocycler (Applied Biosystems). Electrophoresis of the amplified fragments, mixed with formamide and GS500 LIZ Size Standard was carried out in an ABI PRISM 310 Genetic Analyser using the separation medium performance optimized polymer (POP) 4 and 47 cm capillaries (Applied Biosystems). The 3.2.1 version of GENESCANTM was used to track lanes and measure fragment sizes, while the GENOTYPERTM version 2.5.2 software was used to automatically designate alleles in comparison with locus-specific allelic ladders.
DNA from male subjects of the six studied populations (13 Emerillon, 28 Palikur, 30 Wayampi, 17 Kali’na, 28 Apalai and 13 Matsiguenga) were genotyped at the Laboratoire AMIS (Toulouse, France) for 17 Y-chromosomal STR loci (DYS19, DYS389I, DYS389II, ASTRs and YSTRs in French Guiana Amerindians 3
215 216 217 218 219 220 221 222 223 224 225 226 227 228 229 230 231 232 233 234 235 236 237 238 239 240 241 242 243 244 245 246 247 248 249 250 251 252 253 254 255 256 257 258 259 260 261 262 263
DYS390, DYS391, DYS392, DYS393, DYS385a, DYS385b, DYS437, DYS438, DYS439, DYS448, DYS456, DYS458, DYS635 and GATA H4) using the AmpF‘STRw YFilerw
PCR Amplification kit (Applied Biosystems). Previous SNPs screening ensured that no non-Amerindian admixture occurred in the selected samples (Mazie`res et al. 2008). DNA amplification was carried out in a GeneAmp 2700 Thermal cycler (Applied Biosystems) following the manufacturer’s instructions. The target length fragment, mixed with formamide and GS600 LIZ Size Standard was then separated by electrophoresis in a ABI PRISM 3100 Genetic Analyser using the separation medium performance optimized polymer (POP) 6. Runs were performed at the Sequencing and Genotyping Service, IFR30, UMR 5165 CNRS-UPS III, Purpan University Hospital, Toulouse, France. The version 3.2 GENEMAPPERwanalysis software was used to assign allele sizes in comparison with locus
specific allelic ladders.
Statistical analyses
Allele frequencies were calculated using the GENEPOP web utility (Raymond and Rousset 1995). Mean number of alleles, estimates of gene diversity over YSTR loci and mean expected heterozygosity H were obtained with the ARLEQUIN v3.1 package (Excoffier et al. 2005). Levels of gene diversity for the YSTR loci were estimated through the POWERMARKER v3.25 package (Liu and Muse 2005). The FST-based distances
(Weir and Cockerham 1984) were calculated from the autosomal and Y-chromosomal STR genotypes assuming the stepwise mutation model using ARLEQUIN v3.1. Genetic relationships were finally displayed through a metric multidimensional scaling (MDS) plot using XLSTAT-Pro 7.5.2q.
To evaluate total patterns of genetic diversity in the French Guiana area, ASTRs and YSTRs genetic diversities were also compared to those previously obtained for the blood group and protein systems, mtDNA haplogroup frequencies and HVS-I variation (Mazie`res et al. 2007; 2008). Pairwise and general correlation between ranks of genetic diversities calculated with different markers were measured with Spearman’s correlation coefficient and Kendall’s coefficient of concordance (Siegel 1956), respectively. Friedman’s and Nemenyi’s tests were used to compare the populations for the ranked diversities (Zar 1999), using the SPSSwv.13 for Windowse program.
Estimation of a putative genetic bottleneck (i.e. reduction of the population effective size Ne) from allele frequencies is possible using the BOTTLENECK package (Cornuet and
Luikart 1996). This program contrasts recently bottlenecked from non-bottlenecked populations, whose Neremained stationary for more than the past dozen generations, testing
two genetic peculiarities: the mode of distribution of allele frequencies and the difference between observed and expected gene diversities. Briefly, it assumes that in stationary populations alleles at low frequencies are expected to be more abundant than alleles at intermediate frequencies, the allele frequencies distribution being L-shaped (Luikart et al. 1998a). During a reduction of the effective population size rare alleles tend to be lost rapidly, shifting the allele frequency distribution toward the intermediate allele frequency class (Luikart et al. 1998a). Also, in recently reduced populations, allele numbers decrease faster than gene diversity (Allendorf 1986), conditioning the observed gene diversity to be significantly higher than the expected one, since the latter is computed from the observed number of alleles under the assumption of a constant-size population (Luikart et al. 1998b). The ASTRs distribution was tested with the mode-shift indicator and the Wilcoxon sign-rank test furnished by BOTTLENECK (Cornuet and Luikart 1996). One thousand iterations per locus were performed and the loci were assumed to fit both the stepwise
322 323 324 325 326 327 328 329 330 331 332 333 334 335 336 337 338 339 340 341 342 343 344 345 346 347 348 349 350 351 352 353 354 355 356 357 358 359 360 361 362 363 364 365 366 367 368 369 370
(SMM) and the two-phased (TPM) mutation models, which are both likely to be realistic mutation models for microsatellite loci in human populations (Valdes et al. 1993; Di Rienzo et al. 1994). Three markers (D19S433, D21S11 and THO1) accounting for 20% of the 15 ASTR loci studied present intermediate allelic forms (e.g. D21S11*32.2) and thus could evolve following a multistep mutation model (namely the Infinite Allele Model or IAM). Therefore, 20% of multistep mutations were assumed together with lower proportions (10% and 5%) for TPM, as recommended by the BOTTLENECK manual. A variances2of 28
was used since s is roughly equal to the typical step size (Di Rienzo et al. 1994), which amounts to 5.3 allele repeats in the total sample investigated.
Our sampled populations were investigated to verify if they constituted different genetic entities, by clustering individuals as a function of their genotypes using STRUCTURE 2.2 (Pritchard et al. 2000; Falush et al. 2003). The autosomal set of markers was used, since the method requires non-linked markers only. For each number of clusters (K ¼ 2 – 11), 10 runs were performed with a burn-in period of 20 000 iterations followed by 10 000 Monte Carlo Markov Chain replications. All runs were based on the admixture model, in which each individual is assumed to have ancestry in multiple genetic clusters. The Greedy CLUMPP 1.1.1 algorithm (Jakobsson and Rosenberg 2007) was used to find the optimal cluster membership. Finally, the allele frequencies for 11 ASTRs (CSF1PO, D3S1358, D5S818, D7S820, D8S1179, D13S317, D16S539, D18S51, D21S11, TH01 and TPOX) were compared to those from 21 other populations available in the literature (Hutz et al. 2002; Kohlrausch et al. 2005; Crossetti et al. 2008; Gonza´lez-Andrade et al. 2008; Dos-Santos et al. 2009). The Da
genetic distances were then computed using DISPANq (Ota 1993) and the genetic
relationships were estimated through a neighbour joining tree with 1000 bootstrap replications to test the reliability of the branches. Using the Mantel test furnished by XLSTAT-Pro 7.5.2q
, the Da matrix was then compared to the geographic distances
calculated with the Google Earth 5.0.1 ruler tool. Geographic coordinates of the populations (Table S1) were gathered from the authors’ works or estimated according to the linguistic maps available at www.ird.fr and www.ethnologue.com websites.
Results
Supplementary Material Table S2 provides the allele frequency distribution for the 15 ASTRs investigated in our six sampled populations from the French Guiana area and the Peruvian Matsiguenga. After Bonferroni correction for multiple comparisons (Bonferroni 1936) no deviations from Hardy-Weinberg equilibrium were observed with the exception of the D21S11 and FGA loci in the Palikur sample. Considering the five populations from northern Amazonia as one group, 107 alleles were detected, 111 if the Peruvian Matsiguenga are included, ranging from three (TH01) to 13 (D18S51). The most frequent allele shared by the six groups is the same at only one locus: D3S1358 (*15). This allele was also found to be the most frequent in 11 out of 14 populations from Paraguay, northern Argentina (Chaco) and Brazil (Hutz et al. 2002; Kohlrausch et al. 2005; Crossetti et al. 2008).
YSTRs haplotypes detected in the male fraction of the studied populations are presented in Supplementary Material Table S3. A total of 55 different arrangements were found in the 129 males. Only two haplotypes (3.6%) were detected in more than one population: H5 was observed in one Wayampi and five Emerillon lineages while H9 is shared by two Apalai and two Kali’na men. No variation was observed in 11 YSTRs, DYS389I, DYS393, DYS438, DYS439, DYS448, DYS459 and GATAH4 in the Emerillon; DYS19 in Emerillon and Wayampi; DYS391 in Emerillon and Palikur; DYS392 in Apalai, Emerillon and Matsiguenga; and DYS437 in Apalai, Kali’na and Matsiguenga.
ASTRs and YSTRs in French Guiana Amerindians 5
429 430 431 432 433 434 435 436 437 438 439 440 441 442 443 444 445 446 447 448 449 450 451 452 453 454 455 456 457 458 459 460 461 462 463 464 465 466 467 468 469 470 471 472 473 474 475 476 477
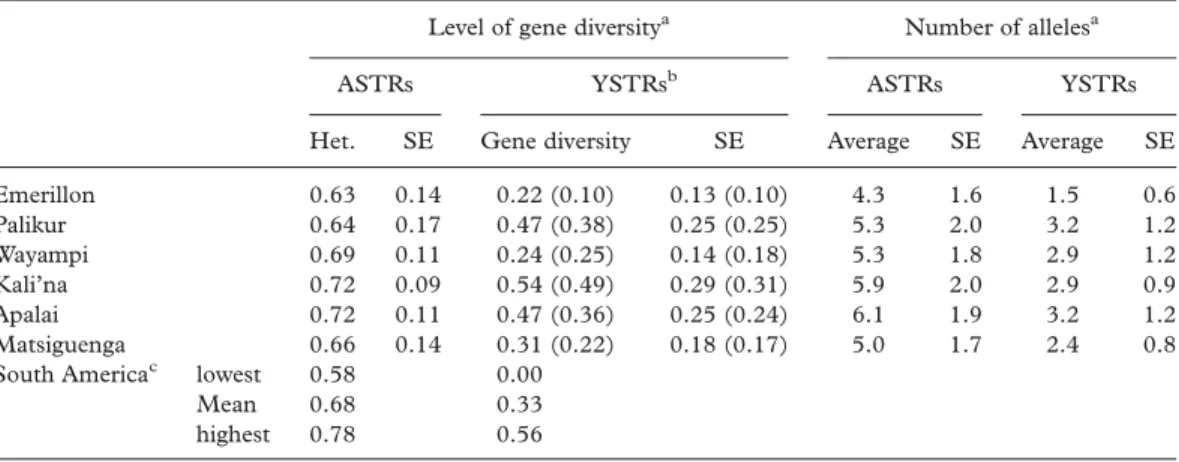
Gene diversity estimates across loci are listed in Table I. Values vary from 0.63 (Emerillon) to 0.72 (Apalai and Kali’na) for the ASTRs and from 0.22 (Emerillon) to 0.54 (Kali’na) for the YSTRs. When comparing the same 15 ASTRs and five YSTRs (DYS19, DYS390, DYS391, DYS392 and DYS393) in other South Amerindians, the six populations under study fall within the observed range for the continent (Table I). The average number of alleles per locus vary from 4.3 (Emerillon) to 6.1 (Apalai) for the ASTRs and from 1.5 (Emerillon) to 3.2 (Apalai) for the YSTRs.
The French Guianan populations plus the related Apalai and Matsiguenga were compared using the FST-based genetic distance for the ASTRs genotypes and YSTRs haplotypes
(Tables S4 and S5). All pairwise comparisons were statistically significant ( p, 0.05) and the genetic relationships are displayed in Figure 1. To ensure the reliability of the FSTdistances
calculated for the ASTRS, the Dagenetic distance (Table S6; Nei et al. 1983), which was
found to perform comparatively well in estimation of population trees from autosomal microsatellite allele frequency data (Takezaki and Nei 1996), has been estimated with POWERMARKER (Liu and Muse 2005) and the matrices compared through a Mantel test. A highly significant correlation (rFst-Da¼ 0.919, p ¼ 0.001) links the two distance methods, highlighting the accuracy of all results with the FSTdistance estimator in our ASTRs data set.
In Figure 1, general agreement between bi- (Figure 1(a)) and uniparental (Figure 1(b)) genetic markers can be observed, with a central core clustering the coastal Palikur and Kali’na together with the Apalai, while the Emerillon and Matsiguenga occupy peripheral positions. The Wayampi stand differently depending on the genetic markers considered; they are placed closer to the Apalai-Palikur-Kali’na cluster for the autosomal dataset, but not for the YSTRs. The STRUCTURE analysis, based on the 167 ASTR genotyped individuals, indicated a number of clusters equal to the number of populations tested as the best adjustment. Table II presents the average membership scores. High mean scores were obtained in cluster 1 by the Matsiguenga (0.89), in cluster 3 by the Emerillon (0.92) and in cluster 5 by the Wayampi
Table I. Gene diversity estimates and number of alleles for 15 ASTRs and 17 YSTRs in six South Amerindian populations.
Level of gene diversitya Number of allelesa
ASTRs YSTRsb ASTRs YSTRs
Het. SE Gene diversity SE Average SE Average SE
Emerillon 0.63 0.14 0.22 (0.10) 0.13 (0.10) 4.3 1.6 1.5 0.6 Palikur 0.64 0.17 0.47 (0.38) 0.25 (0.25) 5.3 2.0 3.2 1.2 Wayampi 0.69 0.11 0.24 (0.25) 0.14 (0.18) 5.3 1.8 2.9 1.2 Kali’na 0.72 0.09 0.54 (0.49) 0.29 (0.31) 5.9 2.0 2.9 0.9 Apalai 0.72 0.11 0.47 (0.36) 0.25 (0.24) 6.1 1.9 3.2 1.2 Matsiguenga 0.66 0.14 0.31 (0.22) 0.18 (0.17) 5.0 1.7 2.4 0.8
South Americac lowest 0.58 0.00
Mean 0.68 0.33
highest 0.78 0.56
aHeterogeneity assessment with Friedman’s non-parametric test using exact the Monte Carlo method: (1) ASTR
average heterozygosity:x2¼ 15.191; df ¼ 5; p , 0.01; Y STR average diversity:x2¼ 26.906; df ¼ 5; p , 0.01.
(2) number of alleles: ASTRs:x2¼26.671; df ¼ 5; p, 0.001; YSTRs:x2¼ 32.682; df ¼ 5; p , 0.001.
bValues in parentheses were obtained for the commonly analysed DYS19, DYS390, DYS391, DYS392 and
DYS393 microsatellites.
cData from 472 and 418 individuals examined for 15 ASTRs and five YSTRs, respectively (Bianchi et al. 1998;
Hutz et al. 2002; Bortolini et al. 2003; Kohlrausch et al. 2005; Crossetti et al. 2008; Gonza´lez-Andrade et al. 2008; Tirado et al. 2009). 536 537 538 539 540 541 542 543 544 545 546 547 548 549 550 551 552 553 554 555 556 557 558 559 560 561 562 563 564 565 566 567 568 569 570 571 572 573 574 575 576 577 578 579 580 581 582 583 584
(0.74). Clusters 2 and 6 show composite affiliations (2: Apalai 0.46/Kali’na 0.62; 6: Palikur 0.54/Apalai 0.41). Although no clear main affiliation can be distinguished for cluster 4, in this inferred group the highest scores were observed for Palikur and Kali’na. These results basically confirm those observed in the MDS plot: Apalai, Kali’na and Palikur have higher genetic similarities while Matsiguenga, Emerillon and Wayampi each have a more particular ASTR profile.
The five French Guianan and Northern Brazilian populations were sorted according to level of genetic variability and the ranks compared with previously published data for bi- and uniparental genetic systems (Table III). Kendall’s concordance coefficient among the four markers (r ¼ 0.863; p, 0.01), as well as Spearman’s correlation coefficients between the
Figure 1. Metric multidimensional scaling plots of FSTbased distances between five northern Amazonian and one
related Peruvian Amerindian populations considering (a) 15 ASTRs (stress: 0.011) and (b) 17 YSTRs (stress: 0.003).
ASTRs and YSTRs in French Guiana Amerindians 7
643 644 645 646 647 648 649 650 651 652 653 654 655 656 657 658 659 660 661 662 663 664 665 666 667 668 669 670 671 672 673 674 675 676 677 678 679 680 681 682 683 684 685 686 687 688 689 690 691
two biparental or uniparental markers (r¼0.900, p, 0.05) suggest that the STR pattern of
gene diversity agrees with protein and mtDNA data in our set of populations. It is especially important for uniparental markers (mtDNA and Y-chromosome) to match the biparental protein and ASTR systems, since genetic diversity can be altered by their lower effective size Ne.
When tribes were compared for the level of variability at the four sets of markers,
Q10
significant differences were found (Friedman’s test: 13.8, p, 0.001). The Emerillon showed the lowest level followed by the Palikur and Wayampi, while the Apalai and Kali’na had the highest values. Multiple comparisons using the Nemenyi method revealed that the Emerillon significantly differed from both the Apalai and the Kali’na (Table III).
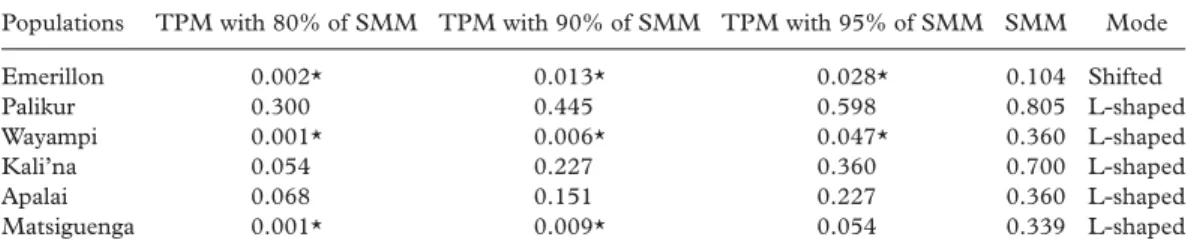
The diploid loci were then analysed to test whether their distribution suggested stationary or recently bottlenecked populations (Table IV). Excess of observed heterozygosity with significant p-values were found for the Emerillon ( p80%SMM¼ 0.002, p90%SMM¼ 0.013),
Wayampi ( p80%SMM¼ 0.001, p90%SMM¼ 0.006) and Matsiguenga ( p80%SMM¼ 0.001,
p90%SMM¼ 0.009) when the markers were assumed to fit the two-phase (TPM) allowing for 80% and 90% of the stepwise (SMM) models. Although the p-values increased along with the SMM proportion, the Emerillon and the Wayampi still showed a significant excess of observed heterozygosity ( p95%SMM¼ 0.028 and 0.047, respectively) at 95% of SMM. As far as the allele frequency distributions are concerned, L-shaped modes, expected in non-recently bottlenecked populations, were observed in all studied tribes with the exception of the Emerillon.
Discussion
The autosomal and Y-chromosome STRs tested proved to be highly variable, as has been observed in other populations, and the intervals of variation found were within the range previously observed in Amerindians. However, there is clear inter-tribal heterogeneity, with the Emerillon showing a more restricted variability and the Apalai (a hinterland) and Kali’na (a coastal) Karib populations presenting the highest amount of variation.
The distinctiveness between the two Maipurean-speaking groups, Matsiguenga and Palikur, had been previously found (Mazie`res et al. 2008), suggesting that people of this language are genetically heterogeneous. This heterogeneity could have predated their postulated southwest – northeastern movement (suggested on linguistic grounds; Urban 1992; Campbell 1997) or may have developed during this migration process. Analyses of a more representative number of Maipurean tribes are necessary to clarify this issue.
The population clustering between the Palikur, Kali’na and Apalai in Figure 1 agree first with an independent settlement of the littoral (Rostain 1994) and second with lower
Table II. Average membership scores in the six inferred clusters obtained by the STRUCTURE analysis of 167 individuals from four French Guiana and two related Amerindian populations.
Average membership in the inferred cluster
Population N8 of individuals 1 2 3 4 5 6 Emerillon 30 0.014 0.022 0.916 0.017 0.017 0.013 Palikur 30 0.050 0.058 0.011 0.319 0.020 0.524 Wayampi 29 0.042 0.091 0.059 0.010 0.744 0.053 Kali’na 23 0.076 0.617 0.048 0.159 0.043 0.056 Apalai 26 0.041 0.456 0.044 0.012 0.038 0.410 Matsiguenga 29 0.890 0.021 0.037 0.012 0.023 0.017 750 751 752 753 754 755 756 757 758 759 760 761 762 763 764 765 766 767 768 769 770 771 772 773 774 775 776 777 778 779 780 781 782 783 784 785 786 787 788 789 790 791 792 793 794 795 796 797 798
T able III . Ascending ra nks of fiv e Ame rindian po pulations from the French Guia na ar ea ac cording to four gene div ersity param eters obtained with bi-an d unipar ental genet ic marke rs. a Autos omic Unipa rental Protein ASTR s M tDNA b YSTRs A v erage Nemen yi’ s test for pair wise co mparisons c Emerillon 2 1 1 1 1.3 A P alikur 1 2 2 3 2 A,B W a yampi 3 3 3 2 2.8 A,B Ka lin ˜ a 4 4 5 5 4.5 B A palai 5 5 4 4 4.5 B Spe ar man’ s c o rrelation co efficient 0.90 (p ¼ 0.037 ) 0.9 0 ( p ¼ 0.037) aPr otein and mtD NA data from M azie `res et al. (200 7; 2008 ). bBased on mtD NA haplogroup frequ encie s. cSam e capit al letter ind icates statistically non -significant pair wise diffe rences ( p . 0.0 5).
ASTRs and YSTRs in French Guiana Amerindians 9
857 858 859 860 861 862 863 864 865 866 867 868 869 870 871 872 873 874 875 876 877 878 879 880 881 882 883 884 885 886 887 888 889 890 891 892 893 894 895 896 897 898 899 900 901 902 903 904 905
inter-population variation among the northern Amazonian Karib populations (Callegari-Jacques and Salzano 1989). To better examine this pattern in the French Guiana area, we performed additional analyses of variance (AMOVA) considering groups based on geographic location or linguistic affiliations. Geographic groups were ‘littoral’ (Palikur, Kali’na) and ‘interior’ (Emerillon, Wayampi, Apalai), whereas language groups were ‘Karib’ (Kali’na, Apalai), ‘Maipure’ (Palikur, Matsiguenga) and ‘Tupi’ (Emerillon, Wayampi). An interesting feature is the lower amount of inter-population variation in the littoral (FASTRsST ¼ 0:044; FYSTRsST ¼ 0:097) than in the interior groups (F
ASTRs
ST ¼ 0:057;
FYSTRsST ¼ 0:448). When comparing groups according to linguistic stock, more homogeneity is found within the Karib (FASTRsST ¼ 0:014; FYSTRsST ¼ 0:104) than in the other linguistic
clusters, namely ‘Maipure’ (FASTRsST ¼ 0:061; FYSTRsST ¼ 0:221) and ‘Tupi’ (F ASTRs
ST ¼ 0:061;
FYSTRsST ¼ 0:651), all in agreement with the inferences cited above.
To accurately estimate the level of sex differences in gene flow, the YSTR AMOVA results were compared with those from the mtDNA HVS-I nucleotide results (Mazie`res et al. 2008). A slightly less pronounced population similarity was observed for the mtDNA in the littoral and Karib populations (littoral:FmtDNAST ¼ 0:126; FYSTRs
ST ¼ 0:097; Karib: F mtDNA
ST ¼ 0:210;
FYSTRsST ¼ 0:104), whereas the opposite pattern could be observed in all the other geographic or linguistic groups (interior:FmtDNAST ¼ 0:198; FYSTRs
ST ¼ 0:448; Maipure: F mtDNA
ST ¼ 0:200;
FYSTRsST ¼ 0:221; and Tupi: FmtDNA
ST ¼ 0:177; F YSTRs
ST ¼ 0:651). In this context, the
clustering of the Tupi-speaking and hinterland Wayampi with the Palikur, Kali’na and Apalai when the ASTRs (Figure 1) or other systems were considered (Mazie`res et al. 2007; 2008), but not when the YSTRs were taken into consideration, suggests that directional sex-biased gene flow occurred in this ethnic group. This is historically confirmed by reports of capture of women as the Wayampi settled along the Oyapock river (Hurault 1965).
When the genetic distances observed for the ASTRs and YSTRs were compared to those of protein systems and mtDNA (Mazie`res et al. 2007; 2008), positive correlations for all pair-wise comparisons of genetic distances for markers with partially or fully maternal inheritance (Mantel’s test: rASTRs-protein¼ 0.850, rmtDNA-protein¼ 0.195, r
ASTRs-mtDNA¼ 0.045) and a negative association between YSTRs and mtDNA genetic distances
(r ¼2 0.150) were found. These results, together with the high FSTvalues among interior
and Tupi groups for the YSTRs, are in accordance with the historical event we have just mentioned for the Wayampi.
Comparison of the allele frequencies for 11 ASTRs examined in the six populations under study and 21 other South Amerindian groups through a neighbour joining tree did not yield a clear separation either by geography or language, with very low bootstrap values and a Multidimensional Scale (MDS) analysis did not improve the pattern (data not shown), in accordance with Dos Santos et al. (2009) who, using the same 11 genetic markers, could not
Table IV. P-values of the Wilcoxon sign-rank test for excess of observed heterozygosity and mode distribution of the allele frequencies assuming the stepwise (SMM) and two-phase (TPM) mutation models.
Populations TPM with 80% of SMM TPM with 90% of SMM TPM with 95% of SMM SMM Mode
Emerillon 0.002* 0.013* 0.028* 0.104 Shifted Palikur 0.300 0.445 0.598 0.805 L-shaped Wayampi 0.001* 0.006* 0.047* 0.360 L-shaped Kali’na 0.054 0.227 0.360 0.700 L-shaped Apalai 0.068 0.151 0.227 0.360 L-shaped Matsiguenga 0.001* 0.009* 0.054 0.339 L-shaped *Significant p-values. 964 965 966 967 968 969 970 971 972 973 974 975 976 977 978 979 980 981 982 983 984 985 986 987 988 989 990 991 992 993 994 995 996 997 998 999 1000 1001 1002 1003 1004 1005 1006 1007 1008 1009 1010 1011 1012
find clear geographic or linguistic patterns among Amazonian Amerindians. Indeed, no correlation has been detected in our data between the Daand geographic distances (Table S7)
(Mantel test, r ¼2 0.012; p ¼ 0.48).
The result indicating a recent genetic bottleneck in the Emerillon agrees with our previous findings (Mazie`res et al. 2007) and is undoubtedly related to the demographic decrease that occurred among Amerindians during the last century (Hurault 1965; Mazie`res et al. 2009). Genetic and demographic bottlenecks (i.e. reduction of the effective and census sizes of the population, respectively) are not automatically linked (Luikart et al. 1998b). The former can occur without reduction of the total population size if the next generation descends from a few mating pairs or a few breeders of one sex (Low 1988; Kittles et al. 1999; Wilder et al. 2004; Hammer et al. 2008). Conversely, a demographic reduction does not always lead to a severe loss of genetic diversity (Allendorf 1986). Central African Pygmies present an enlightening illustration of these phenomena. These hunter-gatherers show more variability for the HVS-I mtDNA (haplotype diversity above 0.80, Destro-Bisol et al. 2004), ASTRs (mean heterozygosity ¼ 0.76, Destro-Bisol et al. 2000) and YSTRs (gene diversity ¼ 0.56, Coia et al. 2004) than South Amerindians (mean values for HVS-I ¼ 0.77, Mazie`res et al. 2008; ASTRs ¼ 0.68; YSTRs ¼ 0.34, Table I), but no signs of population expansion (Excoffier and Schneider 1999) or substantial population decrease (Patin et al. 2009).
Conclusions
Answers to the questions posed in the introduction are as follows: First, agreement of patterns found across the genetic markers was observed, and our multiple comparison analysis revealed a meaningful pattern of genetic diversity and relationships in the area. Second, geography seems to be more important than language in shaping the relationships found, and our data largely agree with historical records. Special note should be made of the Emerillon results; their population decline was clearly reflected in the genetic parameters considered. Lastly, the clustering of all groups besides the Matsiguenga and Emerillon on a single nucleus prevents inferences about early colonization patterns. However, different histories may have existed between Wayampi males and females.
Acknowledgements
Thanks are due to Catherine The`ves and Evelyne Guitard (Laboratoire AMIS FRE2960 CNRS, Universite´ Paul Sabatier) and Fabiana Barzotti Kohlrausch (Departamento de Gene´tica, Universidade Federal do Rio Grande) for their technical assistance. Funding was provided by the Centre National de la Recherche Scientifique in the name of the ‘Amazonie’ collective research program, Institutos do Mileˆnio and Apoio a Nu´ cleos de Exceleˆncia Programs, Conselho Nacional de Desenvolvimento Cientı´fico e Tecnolo´gico, and Fundac¸a˜o de Amparo a` Pesquisa do Estado do Rio Grande do Sul.
Declaration of interest: The authors report no conflicts of interest. The authors alone are responsible for the content and writing of the paper.
Q11
References
Allendorf FW. 1986. Genetic drift and the loss of alleles versus heterozygosity. Zoo Biol 5:181 – 190.
Bianchi NO, Catanesi CI, Bailliet G, Martinez-Marignac VL, Bravi CM, Vidal-Rioja LB, Herrera RJ, Lo´pez-Camelo JS. 1998. Characterization of ancestral and derived Y-chromosome haplotypes of New World native populations. Am J Hum Genet 63:1862 – 1871.
ASTRs and YSTRs in French Guiana Amerindians 11
1071 1072 1073 1074 1075 1076 1077 1078 1079 1080 1081 1082 1083 1084 1085 1086 1087 1088 1089 1090 1091 1092 1093 1094 1095 1096 1097 1098 1099 1100 1101 1102 1103 1104 1105 1106 1107 1108 1109 1110 1111 1112 1113 1114 1115 1116 1117 1118 1119
Bonferroni CE. 1936. Teoria statistica delle classi e calcolo delle probabilita`. Publicazioni del R Istituto Superiore di Scienze Economiche e Commerciali di Firenze 8:3 – 62.
Q1
Bortolini MC, Salzano FM, Thomas MG, Stuart S, Nasanen SP, Bau CH, Hutz MH, Layrisse Z, Petzl-Erler ML, Tsuneto LT, et al. 2003. Y-chromosome evidence for differing ancient demographic histories in the Americas. Am J Hum Genet 73:524 – 539.
Q2
Callegari-Jacques SM, Salzano FM. 1989. Genetic variation within two linguistic Amerindian groups: Relationship to geography and population size. Am J Phys Anthropol 79:313– 320.
Campbell L. 1997. American Indian languages. The historical linguistics of Native America. New York: Oxford University Press. p 512.
Coia V, Caglia A, Arredi B, Donati F, Santos FR, Pandya A, Taglioli L, Paoli G, Pascali V, Spedini G, et al. 2004. Binary and microsatellite polymorphisms of the Y-chromosome in the Mbenzele pygmies from the Central African Republic. Am J Hum Biol 16:57 – 67.
Q3
Cornuet JM, Luikart G. 1996. Description and power analysis of two tests for detecting recent population bottlenecks from allele frequency data. Genetics 144:2001 – 2014.
Crossetti SG, Demarchi DA, Raimann PE, Salzano FM, Hutz MH, Callegari-Jacques SM. 2008. Autosomal STR genetic variability in the Gran Chaco native population: Homogeneity or heterogeneity? Am J Hum Biol 20: 704 – 711.
Destro-Bisol G, Boschi I, Caglia A, Tofanelli S, Pascali V, Paoli G, Spedini G. 2000. Microsatellite variation in Central Africa: An analysis of intrapopulational and interpopulational genetic diversity. Am J Phys Anthropol 112:319 – 337.
Destro-Bisol G, Coia V, Boschi I, Verginelli F, Caglia A, Pascali V, Spedini G, Calafell F. 2004. The analysis of variation of mtDNA hypervariable region 1 suggests that Eastern and Western Pygmies diverged before the Bantu expansion. Am Nat 163:212 – 226.
Di Rienzo A, Peterson AC, Garza JC, Valdes AM, Slatkin M, Freimer NB. 1994. Mutational processes of simple-sequence repeat loci in human populations. Proc Natl Acad Sci USA 91:3166 – 3170.
Dos Santos SE, Ribeiro-Rodrigues EM, Ribeiro-Dos-Santos AK, Hutz MH, Tovo-Rodrigues L, Salzano FM, Callegari-Jacques SM. 2009. Autosomal STR analyses in native Amazonian tribes suggest a population structure driven by isolation by distance. Hum Biol 81:71 – 88.
Excoffier L, Schneider S. 1999. Why hunter-gatherer populations do not show signs of Pleistocene demographic expansions. Proc Natl Acad Sci USA 96:10597 – 10602.
Excoffier L, Laval G, Schneider S. 2005. Arlequin (version 3.0): An integrated software package for population genetics data analysis. Evol Bioinform Online 1:47 – 50.
Falush D, Stephens M, Pritchard JK. 2003. Inference of population structure using multilocus genotype data: Linked loci and correlated allele frequencies. Genetics 164:1567 – 1587.
Gonza´lez-Andrade F, Sa´nchez D, Martı´nez-Jarreta B, Budowle B. 2008. Y-chromosome STR haplotypes in three different population groups from Ecuador (South America). J Forensic Sci 53:512 – 514.
Grenand P, Grenand F. 1985. La question ame´rindienne en Guyane franc¸aise: Ele´ments d’histoire ame´rindienne. Ethnies 1:11 – 17; 23 – 26.
Q4
Grenand F, Grenand P. 1987. La coˆte d’Amapa´, de la bouche de l’Amazone a` la baie d’Oyapock, a` travers la tradition orale Palikur. Boletim do Museu Paraense Emı´lio Goeldi, se´rie Antropologia, Bele´m, Para´ 3:1 – 78. Q5
Hammer MF, Mendez FL, Cox MP, Woerner AE, Wall JD. 2008. Sex-biased evolutionary forces shape genomic patterns of human diversity. PLoS Genet 4:e1000202.
Hurault J. 1965. La population des Indiens de Guyane franc¸aise. Population 20:603 – 632; 801 – 828. Q6
Hutz MH, Callegari-Jacques SM, Almeida SE, Armborst T, Salzano FM. 2002. Low levels of STRP variability are not universal in American Indians. Hum Biol 74:791 – 806.
Jakobsson M, Rosenberg NA. 2007. CLUMPP: A cluster matching and permutation program for dealing with label switching and multimodality in analysis of population structure. Bioinformatics 23:1801 – 1806.
Kittles RA, Bergen AW, Urbanek M, Virkkunen M, Linnoila M, Goldman D, Long JC. 1999. Autosomal, mitochondrial, and Y chromosome DNA variation in Finland: Evidence for a male-specific bottleneck. Am J Phys Anthropol 108:381 – 399.
Kohlrausch FB, Callegari-Jacques SM, Tsuneto LT, Petzl-Erler ML, Hill K, Hurtado AM, Salzano FM, Hutz MH. 2005. Geography influences microsatellite polymorphism diversity in Amerindians. Am J Phys Anthropol 126: 463 – 470.
Liu K, Muse SV. 2005. PowerMarker: Integrated analysis environment for genetic marker data. Bioinformatics 21: 2128 – 2129.
Low BS. 1988. Measures of polygyny in humans. Curr Anthropol 29:189 – 194.
Luikart G, Allendorf FW, Cornuet JM, Sherwin WB. 1998a. Distortion of allele frequency distributions provides a test for recent population bottlenecks. J Hered 89:238 – 247.
1178 1179 1180 1181 1182 1183 1184 1185 1186 1187 1188 1189 1190 1191 1192 1193 1194 1195 1196 1197 1198 1199 1200 1201 1202 1203 1204 1205 1206 1207 1208 1209 1210 1211 1212 1213 1214 1215 1216 1217 1218 1219 1220 1221 1222 1223 1224 1225 1226
Luikart G, Sherwin WB, Steele BM, Allendorf FW. 1998b. Usefulness of molecular markers for detecting population bottlenecks via monitoring genetic change. Mol Ecol 7:963 – 974.
Marrero AR, Silva-Junior WA, Bravi CM, Hutz MH, Petzl-Erler ML, Ruiz-Linares A, Salzano FM, Bortolini MC. 2007. Demographic and evolutionary trajectories of the Guarani and Kaingang natives of Brazil. Am J Phys Anthropol 132:301 – 310.
Mazie`res S, Guitard E, Crube´zy E, Dugoujon JM, Bortolini MC, Bonatto SL, Hutz MH, Bois E, Tiouka F, Larrouy G, et al. 2008. Uniparental (mtDNA, Y-chromosome) polymorphisms in French Guiana and two related populations – implications for the region’s colonization. Ann Hum Genet 72:145 – 156.
Q7
Mazie`res S, Sevin A, Bonnet F, Crube´zy E, Salzano FM, Larrouy G. 2007. Genetic studies in French Guiana populations: Synthesis. Am J Phys Anthropol 132:292 – 300.
Mazie`res S, Sevin A, Callegari-Jacques SM, Crube´zy E, Larrouy G, Dugoujon JM, Salzano FM. 2009. Population genetic dynamics in the French Guiana region. Am J Hum Biol 21:113 – 117.
Nei M, Tajima F, Tateno Y. 1983. Accuracy of estimated phylogenetic trees from molecular data. II. Gene frequency data. J Mol Evol 19:153 – 170.
Nimuendaju´ C. 1926. Die Palikur-Indianer und ihre Nachbarn. Go¨teborgs Kungl Vet Vitt Handl 31:1 – 114.
Ota T. 1993. DISPAN: Genetic distance and phylogenetic analysis. University Park: Institute of Molecular Evolutionary Genetics, Pennsylvania State University.
Patin E, Laval G, Barreiro LB, Salas A, Semino O, Santachiara-Benerecetti S, Kidd KK, Kidd JR, Van der Veen L, Hombert JM, et al. 2009. Inferring the demographic history of African farmers and pygmy hunter-gatherers using a multilocus resequencing data set. PLoS Genet 5:e1000448.
Q8
Pritchard JK, Stephens M, Donnelly P. 2000. Inference of population structure using multilocus genotype data. Genetics 155:945 – 959.
Raymond M, Rousset F. 1995. GENEPOP (version 1.2): Population genetics software for exact tests and ecumenicism. J Hered 86:248– 249.
Rostain S. 1994. L’occupation ame´rindienne ancienne du littoral de Guyane. PhD Thesis: archaeology. Universite´ de Paris, 1, 2 volumes. p 953.
Ruiz-Linares A, Ortiz-Barrientos D, Figueroa M, Mesa N, Munera JG, Bedoya G, Velez ID, Garcia LF, Perez-Lezaun A, Bertranpetit J, et al. 1999. Microsatellites provide evidence for Y chromosome diversity among the founders of the New World. Proc Natl Acad Sci USA 96:6312 – 6317.
Q9
Salzano FM, Black FL, Callegari-Jacques SM, Santos SE, Weimer TA, Mestriner MA, Pandey JP, Hutz MH, Rieger TT. 1988. Genetic variation within a linguistic group: Apalai-Wayana and other Carib tribes. Am J Phys Anthropol 75:347 – 356.
Siegel S. 1956. Nonparametric statistics for the behavioral sciences. New York: McGraw-Hill. p 312.
Takezaki N, Nei M. 1996. Genetic distances and reconstruction of phylogenetic trees from microsatellite DNA. Genetics 144:389 – 399.
Tirado M, Lo´pez-Parra AM, Baeza C, Bert F, Corella A, Pe´rez-Pe´rez A, Turbo´n D, Arroyo-Pardo E. 2009. Y-chromosome haplotypes defined by 17 STRs included in AmpFlSTR Yfiler PCR amplification kit in a multi ethnical population from El Beni Department (North Bolivia). Leg Med (Tokyo) 11:101 – 103.
Urban G. 1992. A histo´ria da cultura brasileira segundo as lı´nguas nativas. In: Carneiro da Cunha M, editor. Histo´ria dos ı´ndios no Brasil. Sa˜o Paulo: Companhia das Letras. p 87 – 103.
Valdes AM, Slatkin M, Freimer NB. 1993. Allele frequencies at microsatellite loci: The stepwise mutation model revisited. Genetics 133:737 – 749.
Weir BS, Cockerham CC. 1984. Estimating F-statistics for the analysis of population structure. Evolution 38: 1358 – 1370.
Wilder JA, Mobasher Z, Hammer MF. 2004. Genetic evidence for unequal effective population sizes of human females and males. Mol Biol Evol 21:2047 – 2057.
Zar JH. 1999. Biostatistical analysis, 4th ed. Upper saddle River, New Jersey: Prentice Hall. p 663.
ASTRs and YSTRs in French Guiana Amerindians 13
1285 1286 1287 1288 1289 1290 1291 1292 1293 1294 1295 1296 1297 1298 1299 1300 1301 1302 1303 1304 1305 1306 1307 1308 1309 1310 1311 1312 1313 1314 1315 1316 1317 1318 1319 1320 1321 1322 1323 1324 1325 1326 1327 1328 1329 1330 1331 1332 1333