HAL Id: cea-02383154
https://hal-cea.archives-ouvertes.fr/cea-02383154
Submitted on 27 Nov 2019HAL is a multi-disciplinary open access
archive for the deposit and dissemination of sci-entific research documents, whether they are pub-lished or not. The documents may come from teaching and research institutions in France or abroad, or from public or private research centers.
L’archive ouverte pluridisciplinaire HAL, est destinée au dépôt et à la diffusion de documents scientifiques de niveau recherche, publiés ou non, émanant des établissements d’enseignement et de recherche français ou étrangers, des laboratoires publics ou privés.
Adsorption and retarded diffusion of Eu
III-EDTA
-through hard clay rock.
Michael Descostes, Ingmar Pointeau, Jean Radwan, Jenna Poonoosamy,
Jean-Luc Lacour, Denis Menut, Thomas Vercouter, Romain V.H. Dagnelie
To cite this version:
Michael Descostes, Ingmar Pointeau, Jean Radwan, Jenna Poonoosamy, Jean-Luc Lacour, et al.. Adsorption and retarded diffusion of EuIII -EDTA -through hard clay rock.. Journal of Hydrology,
S1
Supplementary material for
Adsorption and retarded diffusion
of Eu
III-EDTA
-through hard clay rock.
Michael Descostes
a, Ingmar Pointeau
a, Jean Radwan
a, Jenna Poonoosamy
a,
Jean-Luc Lacour
b, Denis Menut
b, Thomas Vercouter
b, Romain V. H. Dagnelie
a,*.
(a) DEN-Service d’Etude du Comportement des Radionucléides (SECR), CEA, Université Paris-Saclay, F-91191, Gif-sur-Yvette, France
(b) DEN-Service d’Etudes Analytiques et de Réactivité des Surfaces (SEARS), CEA, Université Paris-Saclay, F-91191, Gif-sur-Yvette, France
* Corresponding author. E-mail: romain.dagnelie@cea.fr
Content:
Table S1: Composition of synthetic porewater used for experiments S2
Figure S1: Scheme of solid samples sliced for LIBS-micro probe characterization S2 Figure S2: Adsorption kinetic of Eu-EDTA on clay rock sample S3 Figure S3: Effect of adsorption kinetic on through-diffusion modelling S4
S2
Table S1. Synthetic poral water composition used for this study.
Na+ K+ Ca2+ Mg2+ Sr2+ Cl- ΣCO2 SO4
2-pH C (10-3 moles L-1) 35.6 1.48 8.79 7.00 0.13 33.6 2.20 16.9 7.15
Figure S1. Scheme of solid samples sliced for LIBS-micro probe characterization.
(Left) Scheme of through-diffusion cell (diffusion gradient along X-axis). (Right) Scheme of C1 and C2 solid samples sliced after diffusion.
A post-mortem characterization of the clay rock was performed after diffusion. To this aim, two rock samples were sliced. Eu mapping was measured by LIBS-micro probe technique. Several mapping were performed on center of C1 and C2 slices. Typical dimensions of mapping were dX×dZ~10×1 mm² as shown in Fig. S1.
Adsorption kinetics of
152Eu-EDTA and
14C-EDTA on COx clay rock
Adsorption kinetics for 152Eu in presence of EDTA and 14C-EDTA was measured on COx clay rock up to 14 days. A rough estimation was performed assuming an exponential decay of concentration in solution. The kinetic rate was then extrapolated by linear regression on ln[(C(t)-C∞)/(C0-C∞)] (Figure S2, top). The corresponding rate, k
EXP
= 1.71 10-6 s-1, was used to model run C. All kinetics data are gathered in Figure S2 (bottom) and were in the range [10-6 - 2 10-5] s-1.
dX = 10 mm
Ø=35mm
Solid cutting for
LIBS-micro probe
X
Y
C1 slice: y=0 1.5
C2 slice: y=6 1.5
Z
Eu
mapping
Through-diffusion cell
Upstream reservoir
V~175 mL
Downstream reservoir
V~125 mL
Clay rock
sample
X
Eu
profile
S3
Figure S2. Experimental adsorption kinetics of EDTA complexes on COx clay rock.
(top) Example of linear regression for [Eu]eq. = 8 10 -9
mol L-1.
(bottom) Experimental adsorption rates as a function of concentration of adsorbates.
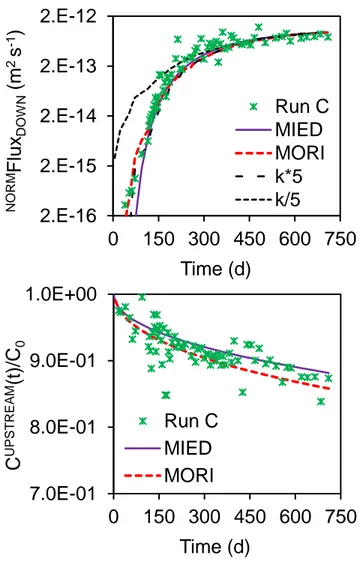
Effect of kinetics on through-diffusion modelling
The effect of slow reversible adsorption kinetics was modelled using semi-analytical solutions provided for through-diffusion cells by Moridis (1998). The adsorption rate for run C was supposed equal to the value measured by batch experiments: k = 1.71 10-6 s-1. The best fit was obtained with values De = 1.74 10
-12
m2.s-1 and Kd = 2.08 L.kg -1
is presented in figure S3. This modelling highlights two results. Firstly, an early rise of the downstream flux before 70 days may be explained by slow adsorption. Secondly, such adsorption kinetic fail to explain the main difference between Rd measured
in batch experiments and Kd adjusted from diffusion experiments.
y = -
1.71E-06
x
R² = 9.64E-01
-3.0
-2.0
-1.0
0.0
1.0
0.E+00 5.E+05 1.E+06 2.E+06
ln[
(C(t
)-C
∞)/(C
0-C
∞)]
Time (s)
7d. 14d. 1d.1.E-06
1.E-05
1.E-04
1.E-09
1.E-06
1.E-03
k
(s
-1)
C
eq.(mol/L)
14C-EDTA
152Eu-EDTA
S4
Figure S3. Modelling of downstream flux (top) and upstream concentration (bottom) with two
models: MIED and MORI respectively without and with taking into account adsorption kinetics. Adjusted parameters are (De, Kd) = (1.5 10
-12
, 1.8) and (1.7 10-12 m2 s-1, 2.1 L kg-1) for MIED and MORI respectively. Dark curves represent effect of adsorption rates five times higher
or five times lower than the experimental value: k = 1.71 10-6 s-1.
Bibliography:
Moridis, G.J., 1998. A Set of Semianalytical Solutions for Parameter Estimation In Diffusion Cell Experiments. Sci. New-York.
Wu, S.L., Horrocks, W.D., 1996. General Method for the Determination of Stability Constants of Lanthanide Ion Chelates by Ligand-Ligand Competition: Laser-Excited Eu3+ Luminescence Excitation Spectroscopy. Anal. Chem. 394–401.