Publisher’s version / Version de l'éditeur:
Vous avez des questions? Nous pouvons vous aider. Pour communiquer directement avec un auteur, consultez la première page de la revue dans laquelle son article a été publié afin de trouver ses coordonnées. Si vous n’arrivez pas à les repérer, communiquez avec nous à [email protected].
Questions? Contact the NRC Publications Archive team at
[email protected]. If you wish to email the authors directly, please see the first page of the publication for their contact information.
https://publications-cnrc.canada.ca/fra/droits
L’accès à ce site Web et l’utilisation de son contenu sont assujettis aux conditions présentées dans le site LISEZ CES CONDITIONS ATTENTIVEMENT AVANT D’UTILISER CE SITE WEB.
Canadian Geotechnical Journal, 19, pp. 511-517, 1982
READ THESE TERMS AND CONDITIONS CAREFULLY BEFORE USING THIS WEBSITE. https://nrc-publications.canada.ca/eng/copyright
NRC Publications Archive Record / Notice des Archives des publications du CNRC : https://nrc-publications.canada.ca/eng/view/object/?id=085a9ec9-d94f-405d-a13d-8e7c0f0ccfd5 https://publications-cnrc.canada.ca/fra/voir/objet/?id=085a9ec9-d94f-405d-a13d-8e7c0f0ccfd5
NRC Publications Archive
Archives des publications du CNRC
This publication could be one of several versions: author’s original, accepted manuscript or the publisher’s version. / La version de cette publication peut être l’une des suivantes : la version prépublication de l’auteur, la version acceptée du manuscrit ou la version de l’éditeur.
Access and use of this website and the material on it are subject to the Terms and Conditions set forth at
Locating the frozen-unfrozen interface in soils using time-domain
reflectometry
Scr
THl
N21d
~
no.
1048
1
National ~esearch Conseil national c . 2 ,Council Canada de recherches CanadaBLDG
II
LOCATING THE FROZEN-UNI?ROZEN INTERFACE
IN
SOILS USING
TIME-DOMAIN REFLECTOMETRY
1
I .
by T. H. W. Baker, J. L. Davis, H. N. Hayhoe, and G . C. Topp
ANALYZED
Reprinted from
Canadian Geotechnical Journal Vol. 19, 1982
pp. 511-517
DBR Paper No. 1048
Division of Building Research
This publication is being distributed by the Division of Building Research of the National Research Council of Canada. It should not
be reproduced in whole or in part without permission of the original publisher. The Division would be glad to be of assistance in obtaining such permission.
Publications of the Division may be obtained by mailing the appropriate remittance (a Bank, Express, or Post Office Money Order, or a cheque, made payable to the Receiver General of Canada, credit NRC) to the National Research Council of Canada, Ottawa. KIA 0R6. Stamps are not acceptable.
A list of all publications of the Division is available and may be obtained from the Pjl- l X & r : n m
--
. .Researcb 0R6.
Locating the frozen-unfrozen interface in soils using time-domain reflectometry
T . H. W. BAKERDivision of Building Research, National Research Council of Canada, Ottawa, Ont., Canada KIA OR6
J . L. DAVIS'
Geological Survey of Canada, Energy, Mines and Resources, Ottawa, Ont., Canada KIA OE8
A N D
H. N. HAYHOE AND G . C. TOPP
Land Resource Research Institute, Agriculture Canada, Ottawa, Ont., Canada KIA 0C6
Received December 1 1, 198 1 Accepted June 10, 1982
The time-domain reflectometry technique was compared with the temperature measurement method for locating the frozen-unfrozen interface in water and sandy soils. This technique depends on the high-frequency (1-1000 MHz) electrical properties of water that change significantly and abruptly between the liquid and solid phases. Parallel wire transmission lines were inserted into the soil to guide electromagnetic pulses produced by a time-domain reflectometer (TDR). The frozen-unfrozen interface produced reflections measured by the TDR which were in turn used to locate the interface as it moved along the transmission line. In the laboratory it was possible to locate the interface using the TDR to within k0.5 cm and in the field to within +2.4 cm. These errors were equal to those associated with the temperature measurements.
Keywords: soil freezing, temperature measurements, dielectric constant, time-domain reflectometry.
Can. Geotech. J., 19, 511-517 (1982)
'Present address: EarthTech Research Ltd., Baltimore, MD 21227, U.S .A. 0008-3674/82/0405 11-07$01 .OO/O
514 CAN. GEOTECH. J. VOL. 19, 1982
I N S U L A T I O N 7
! P A R A L L E L Time-domain reflectometer measurements of the loca-
t a l T R A N S M I S S I O N
tion of the frozen-unfrozen interface were compared with temperature measurements using copper-constant-
Ft;.
,, ,
, ,,
an thermocouples spaced at 2 cm intervals to a depth of20 cm and one thermocouple placed next to the bottom heater. Precision of the temperature measurement was
A +0.05"C as determined by a constant temperature bath
B C D accurate to ?0.00l0C. Adjustments to the heater
uu
F R O Z E N U N F R O Z F N allowed changes in the thermal gradient to control the
freezing rate. In the vicinity of the frozen-unfrozen i
i
J
,
i-1
!;iFlr,
interface the temperature gradient was maintained atabout 0. 1°C/cm. In the freezing water experiment the
b,
0
3 ice thickness was also measured using a hot-wire
+
-
technique (Untersteiner 1961) and an ultrasonic pulse-2
&
I echo technique (ASTM Standard E3 17).
a
Figure 3 shows typical TDR scans in freezing sand.
T I M E Figure 3a shows the response before freezing begins.
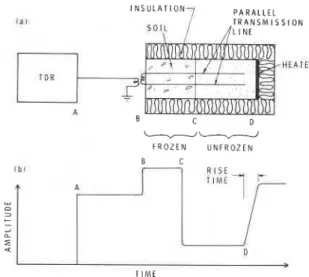
FIG. 2. Time-domain reflectometry: ( a ) schematic diagram The travel time, t,, for the pulses moving along the full of TDR and transmission line inserted in soil; ( b) an idealized 25 cm of the transmission line in the unfrozen material
TDR response curve from the experimental arrangement Was 8.20ns. Using 121, the dielectric constant of the shown in ( a ) . unfrozen soil (K,) was calculated as 24.2. From the
equation presented by Topp et al. (1980), this gives an the reflected signal. Point D is easily located in Fig. 2b average volume~c water content of 39 .3%. The since the rise time of the reflected signal is relatively sand had been placed and compacted at a volumetric short. Topp et al. (1980), in their study of water content water content of 40%.
determination, found that this rise time increased with a decrease in soil grain size or an increase in the impurity content of the soil water.
'U
If one knows the dielectric constant in either the
-
1
8.20 nsfrozen or unfrozen zones, the respective travel times and the length of the transmission line permit calculation of the distance of the frozen-unfrozen interface relative to point B on the frozen side or to point D on the unfrozen
side. If the dielectric constants of both the frozen and l a 1
unfrozen media are known then one measurement can be
>
used to check the other and measurement precision can be improved. This technique can be used to locate the
frozen-unfrozen interface as it moves along the length b, a
of the transmission line.
-
= +2 k
I
Laboratory measurements 4:
I b l
Laboratory tests of frost penetration in a saturated
Ottawa sand and the freezing of distilled water were
>
undertaken to establish the feasibility and precision ofusing time-domain reflectometry to locate the frozen- unfrozen interface. These media were chosen to ensure little or no freezing point depression.
The transmission lines in the laboratory sand and distilled water experiments consisted of two parallel
steel rods, 0.2 cm in diameter, spaced 3 cm apart and ( c 1
inserted into the unfrozen media to a depth of 25 cm.
A
>
These transmission lines are of similar configuration to T I M Ethose used by Davis and Annan (1977). Uniaxial FIG. 3. Typical TDR scans in freezing sand: (a) completely
freezing of the media in the cold room was achieved by unfrozen; (b) frozen layer overlying unfrozen layer; (c)
the use of insulation and a heater as shown in Fig. 2a. completely frozen.
Figure 3b shows the sample partly frozen along the length of the transmission line. The location of the frozen-unfrozen interface can be determined, using the unfrozen dielectric constant (K,,) given above and the time for the pulses to move through the unfrozen soil, as t,, = 4.39 ns. Using [2], the distance from the bottom of the transmission line to the frozen-unfrozen interface is calculated to be 13.4 cm. The thickness of the frozen soil is therefore 25.0
-
13.4 = 11.6 cm.Figure 3c shows the sample completely frozen along the length of the transmission line. The travel time, tf, for pulses moving along the full length (25 cm) of the transmission line in the frozen material was 3.40ns. From [2], the dielectric constant of the frozen soil (Kaf) is calculated to be 4.2 This value can now be used to calculate directly the thickness of the frozen layer of soil. In Fig. 3b the time for the pulses to move through the frozen soil is tf = 1.66 ns. Using [2], the distance from the beginning of the transmission line to the frozen-unfrozen interface is calculated to be 12.2 cm. Using this technique the thickness of the frozen soil layer can be calculated from the unfrozen side using tu and
K,,,,
or from the frozen side using tf and Kaf.In order to verify these measurements the foregoing values were compared with the thermocouple tempera- ture measurements, as shown in Fig. 4. Note from Fig. 1 that the temperature gradient in the vicinity of the zero-degree isotherm (O.l0C/cm) induces an uncer- tainty of k0.5 cm in accurately locating the zero degree isotherm.
Figure 5 shows a comparison of two methods for measuring depth to the frozen-unfrozen interface in a saturated sand during freezing along the length of the transmission line. Measurements are presented using data from both the frozen and unfrozen side. The
. D R I N T E R P R E T A T I O N T E M P E R A T U R E , " C
FIG. 4. Comparison of TDR and temperature measure- ments. I I I I T l I T I - Y = (0.99 ? .02)X + (0.56 + .21)
-
R~ = 0.99I
@
C *-
-
-
&
-
-
z 5
-
-
-
U 0.5 rn3
>""
-
-
/;" 0 FROZEN-
-
tE
UNFROZEN-
--
I I I I I l I 1 I T H E R M O C O U P L E M E A S U R E M E N T S , c mFIG. 5. Comparison of two methods for measuring depth to frozen-unfrozen interface during freezing of saturated sand.
regression line through the data points indicates an excellent correlation. The standard deviation was 0.5 cm. Note that this is equal to the uncertainty in accurately locating the zero-degree isotherm from the thermocouple measurements. Horizontal lines in the figure indicate the accuracy of the thermocouple mea- surements.
Figure 6 shows a similar comparison for the depth to the frozen-unfrozen interface in distilled water. Mea- surements were made in a large tank. The position of the ice-water interface was determined using the TDR, thermocouple, hot-wire, and ultrasonic methods. A standard deviation of 0.2cm was obtained for the comparisons between the thermocouple measurements
I
-
-
-
-
o FROZW-
UNFROZEN-
-
I I I I ! I I I l A V E R A G E O F H O T - W I R E , U L T R A S O N I C A N D T H E R M O C O U P L E M E A S U R E M E N T S , c mFIG. 6. Comparison of methods for measuring depth to frozen-unfrozen interface during freezing of distilled water.
516 CAN. GEOTECH. J. VOL. 19, 1982
and the hot-wire and ultrasonic measurements. The average of these three methods is compared with the TDR measurements in Fig. 6. Again the regression line through the data points indicates an excellent correla- tion. The standard deviation was 0.7 cm. The accuracy of the hot-wire and ultrasonic measurements was about 0.1 cm. Since these measurements were not taken at exactly the same location as the transmission lines the thermal effect of the steel rods could not be evaluated. From Fig. 1 the temperature gradient of 0. 1°C/cm would indicate an uncertainty of e 0 . 5 cm in accurately locating the zero-degree isotherm. The standard devia- tion above could reflect the error in all of these measurements.
Field measurements
During the summer of 1980, TDR transmission lines were installed in a sandy loam soil at a field site in Ottawa, Ontario. The installation comprised three pairs of 50-cm long lines placed horizontally at depths of 7.5, 15, and 22.5 cm and three vertical lines 50, 80, and 120cm long inserted from the surface. The 50-cm stainless steel rod lines were 0.3 cm in diameter and the balance were 0.6 cm in diameter. Each pair of rods was spaced 5 cm apart. Copper-constantan thermocouples were installed at 5-cm intervals down to 100cm, and lOcm apart to a depth of 140cm. Precision of the temperature measurement system was 20.3"C. The site was kept clear of snow during the 1980- 198 1 winter and periodic readings were taken of the ground temperature and the response of the TDR lines. From the temperature measurements the temperature gradients during this period were 0.13
+
0.03"C/cm. From Fig. 1 an error of k2.5 cm is associated with locating the zero-degree isotherm.The location of the frozen-unfrozen interface was determined using [2], with the frozen dielectric constant determined from the horizontal transmission lines lo- cated within the frozen zone. In an open system, such as occurs in the field, it was possible for water contents and thus dielectric constants to change with depth and time. More than one transmission line was necessarv to determine the value of the dielectric constant to be Lsed for calculating the position of the frozen-unfrozen interface (freezing front). For example, when the interface had reached about 10 cm depth, the horizontal transmission line at 7.5cm provided a measure of dielectric constant (Kaf) for the frozen zone that was used to determine the location of the frozen-unfrozen interface along the 50,80, and 120-cm vertical lines. As the other horizontal lines became frozen in, their readings could be used to obtain a better value of the average dielectric constant of the frozen zone.
Figure 7 shows the correlation between the TDR and thermocouple measurements at the field site; the stan- dard deviation was 2.4 cm.
T H E R M O C O U P L E M E A S U R E M E N T S , c m
FIG. 7. Comparison of two methods for measuring depth to frozen-unfrozen interface in sandy loam soil in situ, Novem-
ber 1980 to January 198 1.
Conclusions
Time-domain reflectometry has been used to locate the frozen-unfrozen interface in freezing soils where the freezing boundary is moving along the axis of the transmission line. Measurements of the dielectric con- stant of the frozen (Kaf) and/or unfrozen (K,,) material were required to locate the interface relative to the ends of the transmission line.
The correlations between time-domain reflectometry and other techniques for locating the frozen-unfrozen interface were excellent as indicated by the slopes of the regression lines, which were close to 1 .O.
In each of the experiments, the standard deviation for the TDR data correlated with the temperature data was about equal to the error associated with the temperature measurements as determined from Fig. 1. For this reason one can say only that the precision of the TDR technique is as good as the temperature technique for locating the frozen-unfrozen interface in soils.
Laboratory experiments were also undertaken using fine-grained clay soils where the frozen-unfrozen inter- face was not necessarily at the zero-degree isotherm (Baker and Davis 1982). The position of the interface determined by X-ray techniques (Penner and Goodrich 1980) was compared with that determined by time- domain reflectometry
.
Acknowledgements
The authors would like to thank K. White for his assistance in obtaining the field data.
This paper is a joint contribution of the Division of Building Research, National Research Council of Can- ada, and of the Land Resource Research Institute of Agriculture Canada, and is published with the approval of the Director of the Division.
NOTES
1
ANNAN, A. P., and DAVIS, J. L. 1978. High frequency electrical methods for the detection of freeze-thaw inter- faces. Proceedings, 3rd International Permafrost Confer- ence, Edmonton, pp. 496-500.
ARCONE, S. A. 1979. Review of electrical resistivity of frozen ground and some electromagnetic methods for its measure- ment. Materials Performance, 18, pp. 32-37.
BAKER, T. H. W., and DAVIS, J. L. 1982.' Application of time-domain reflectometry to determine the thickness of the frozen zone in soils. Proceedings, 3rd International Sym- posium on Ground Freezing, Hanover, Vol. 2, 8 p. BANNER, J. A., and VAN EVERDINGEN, R. 0. 1979. Frost
gauges and freezing gauges. National Hydrology Research Jnstitute, Paper No. 3, Inland Waters Directorate, Bull. No. 110, Ottawa, 18 p.
DAVIS, J. L., and ANNAN, A. P. 1977. Electromagnetic detection of soil moisture: Progress Report 1. Canadian Journal of Remote Sensing, 3, pp. 76-86.
HEINRICH, D., MUELLER, G., and VOORT, H. 1979. Ground freezing monitoring techniques. Engineering Geology (Am- sterdam), 13(1-4), pp. 455-47 1.
PATTERSON, D. E., and SMITH, M. W. 1980. The use of
time-domainreflectometry for the measurement of unfrozen water content in frozen soils. Cold Regions Science and Technology, 3, pp. 205-210.
1981. The measurement of unfrozen water content by time-domain reflectometry: results from laboratory tests. Canadian Geotechnical Journal, 18, pp. 13 1
-
144. PENNER, E., and GOODRICH, L. E. 1980. Location ofsegregated ice in frost susceptible soil. Proceedings, 2nd International Symposium on Ground Freezing, Trondheim, pp. 626-639.
PILON, J. A., ANNAN, A. P., DAVIS, J. L., and GRAY, J. T. 1979. Comparison of thermal and radar active layer mea- surement techniques in the Leaf Bay Area, Nouveau- Qukbec. Ghgraphie Physique et Quaternaire, Universit6 de Montr6al Press, 33(3-4), pp. 3 17-326.
TOPP, G. C., DAVIS, J. L., and ANNAN, A. P. 1980. Electromagnetic determination of soil water content: mea- surements in coaxial transmission lines. Water Resources Research, 16, pp. 574-582.
UNTERSTEINER, N. 1961. On the mass and heat budget of Arctic sea ice. Archiv fiir Meteorologie, Geophysik und Bioklimatologie, Ser. A, 12(2), pp. 15 1 - 182.