HAL Id: hal-01359839
https://hal.archives-ouvertes.fr/hal-01359839
Submitted on 5 Sep 2016
HAL is a multi-disciplinary open access
archive for the deposit and dissemination of sci-entific research documents, whether they are pub-lished or not. The documents may come from teaching and research institutions in France or abroad, or from public or private research centers.
L’archive ouverte pluridisciplinaire HAL, est destinée au dépôt et à la diffusion de documents scientifiques de niveau recherche, publiés ou non, émanant des établissements d’enseignement et de recherche français ou étrangers, des laboratoires publics ou privés.
Lifetime Model of the Inverter-fed Motors Secondary
Insulation by using a Design of Experiments
Nadine Lahoud, Manh Quan Nguyen, Pascal Maussion, David Malec,
Dominique Mary
To cite this version:
Nadine Lahoud, Manh Quan Nguyen, Pascal Maussion, David Malec, Dominique Mary. Lifetime Model of the Inverter-fed Motors Secondary Insulation by using a Design of Experiments. IEEE Transactions on Dielectrics and Electrical Insulation, Institute of Electrical and Electronics Engineers, 2015, vol. 22 (n° 6), pp. 3170-3176. �10.1109/TDEI.2015.005202�. �hal-01359839�
O
pen
A
rchive
T
OULOUSE
A
rchive
O
uverte (
OATAO
)
OATAO is an open access repository that collects the work of Toulouse researchers and
makes it freely available over the web where possible.
This is an author-deposited version published in :
http://oatao.univ-toulouse.fr/
Eprints ID : 16028
To link to this article : DOI:10.1109/TDEI.2015.005202
URL :
http://dx.doi.org/10.1109/TDEI.2015.005202
To cite this version : Lahoud, Nadine and Nguyen, Manh Quan and
Maussion, Pascal and Malec, David and Mary, Dominique Lifetime
Model of the Inverter-fed Motors Secondary Insulation by using a
Design of Experiments. (2015) IEEE Transactions on Dielectrics and
Electrical Insulation, vol. 22 (n° 6). pp. 3170-3176. ISSN 1070-9878
Any correspondence concerning this service should be sent to the repository
administrator:
staff-oatao@listes-diff.inp-toulouse.fr
DOI 10.1109/TDEI.2015.005202
Lifetime Model of the Inverter-fed Motors Secondary
Insulation by using a Design of Experiments
Nadine Lahoud, Manh Quan Nguyen, Pascal Maussion, David Malec
andDominique Mary
University of Toulouse; UPS, INPT, CNRS LAPLACE (LAboratoire PLAsma et Conversion d’Energie)
118, route de Narbonne F-31062 Toulouse cedex 9, France
ABSTRACT
Numerous parameters (environmental conditions, material and equipments design) affect the ageing (and consequently the lifetime) of the Electrical Insulation System (EIS) of motors supplied by static converters.In order to find a modeling of the lifetime of such materials, accelerated tests have to be considered. The problem is that if we consider all the relevant parameters, these tests become costly and take a lot of time. Consequently the topic of this study is to use a statistical method called: the ‘Design of Experiments’ (DoE) to obtain the lifetime modeling by only a ‘reasonable’ number of experiments. Only electrical and thermal parameters will be modified in this study (vibrations and thermal cycling are not taken into account).In this work, the ageing of the secondary insulation of a motor fed by an inverter is supposed to be originated from partial discharges.In this kind of machine, if a partial discharge activity begin to grow, the first insulation link of the EIS to be affected by these discharges will be the secondary one (i.e.: the impregnation varnish).Consequently, this study is focused only on this secondary insulation.The results obtained by using the DoE method show that it is possible to classify the different ageing parameters and to find their effects on the insulation lifetime. The interactions between all the parameters will also be shown by this method. Finally, a mathematical model of the insulation lifetime taking into account all the parameters and their interactions will be presented and discussed. Index Terms - Insulation ageing, Lifetime, Design of experiments, Modeling, Partial discharges, Low voltage rotating machine, Inverter.
1 INTRODUCTION
THEageing of polymeric insulators submitted to different affecting parameters has been largely studied and analyzed during these past twenty years.The ageing and the lifetime of such insulating materials have been studied by considering physico-chemical, thermal and electromechanical impact [1-4] but nothing about partial discharges.
The aim of this work is to prepare new electrical equipment that will be use in the next generation of aircraft called ‘more electric aircraft’. In this next generation, the AC supply voltage will have been increased from 115 Vac to 230 Vac and
a DC supply voltage bus of 540 Vdc will be used. On that DC
bus, different Pulsed Width Modulation (PWM) inverters will feed different loads, such as motors. In that aircraft, over-voltages, occurring at the motors terminals when fed by inverters [5-8], will be dangerously high because of the high value of the DC bus voltage. These over-voltages are due to a mismatch between both cable and motor impedances.
Moreover, the higher the feeding cable length, the higher these overvoltages. The effect of the voltage rising rate is the same: the higher the dV/dt, the higher these overvoltages. These over-voltages will probably, if anything is done to avoid this phenomenon, induce partial discharge within the motor windings. Indeed, these over-voltages may reach the threshold value given by the Paschen’s law.This may be critical especially when these machines are located in non-pressurized areas of the aircraft, because this threshold depends on the pressure.
Our knowledge about the electrical insulation ageing in motors supplied by static converters is poor, because of the probable synergy between electrical end environmental parameters acting together [9]. However, manufacturers qualify their products by using of accelerated (severe) ageing tests but unfortunately, there is no evidence that the main ageing mechanism acting under severe tests is the same as under ‘normal’ service stresses. Moreover, testing samples with modification of just one parameter cannot bring a full understanding of such a complex ageing mechanism. A large number of experimental tests have to be performed. To decrease this number of experiments and to find the most relevant parameters, a statistical method has to be used.
Among the available statistical methods used to study insulation ageing [10], we have chosen the “Design of Experiments (DoE)” one.Indeed, because of its structure and its organization, this method allows the study of the output of a process (Y) with different factors (Xi) acting together [11],
[12]. In this work, the DoE is used to establish a correlation between the secondary insulation lifetime and the different factors affecting it and their interactions as well.
First of all, a brief description of the DoE is given and secondly, how this method is used for the insulation lifetime analysis is detailed. In this paper, we have focused our attention on the impregnation varnish of a motor fed by an inverter (secondary insulation). Indeed, this varnish is the first insulation part of the EIS that is attacked and damaged by PD.
2 THE
DESIGN
OF
EXPERIMENTS
In a classical “One Factor At a Time” method (OFAT), only one of the relevant parameters (i.e.: controlling the ageing) is controlled and adjusted, while the other ones are fixed [11]. Consequently, this method may be used only when the different factors have no interaction. Moreover, this interaction between different factors cannot be estimated when only one parameter is controlled.In conclusion, modeling an ageing process where different parameters act together needs another kind of method.
Among the available methods, the DoE method is a fast and cost-effective approach to provide information from collected experiments. It needs to establish a set of experiments involving all the relevant parameters.To identify the effect of the different parameters on the output response, changes are correctly done on the input variables [12]. Fisher was the first one to introduce this method in 1935 [13]. The power of this method was proved in different topics such as chemistry, agriculture, electronics, in which numerous parameters must be taken into account together. In electronics, it has been successfully applied to design and optimize industrial applications [14], to control power converters [15], to track relevant parameters on insulating films reliability [16] or to analyze the development of a reliable water-treeing test [17].
This method needs to suitably structure a data matrix of experiments. Its particularity is that even if the matrix is small, its use brings accurate results. In this work, it is used to analyze both ageing and lifetime of the secondary insulation of motors supplied by static converters. In order to develop partial discharges within the windings (causing premature failure [5-8]) the applied voltages are correctly adjusted.The matrices which allow the analysis of the factor effects, will be built from insulation lifetime results obtained fromaccelerated ageing experiments under different stresses.
3 ACCELERATED
AGEING
EXPERIMENTS
The aim of this study is to find how a DoE may be used to provide a model of the secondary insulation lifetime.For that purpose, short ageing experiments are undertaken to find the relationship between the influential factors and the corresponding lifetime.
3.1 EXPERIMENTAL SETUP AND PROTOCOL As already mentioned in the introduction, this work is only focused on the lifetime of the impregnation varnish of a motor. This secondary insulation is the first part of the EIS to be touched by partial discharges, if the motor is supplied by a static converter having high dV/dt.
In our experiments, samples where composed of steel plates coated with polyester-imide varnish (PEI) whose thermal class is 180°C, as shown in Figure 1. The size of these specimens is approximately: 15 cm x 9 cm and the coating thickness is about 90 µm. The high voltage is applied between two electrodes:
- the first one which is spherical (stainless steel -diameter: 1 mm), in contact with the insulator surface - the second one which is a steel plate (connected to the
earth).
Figure 1. PEI-coated steel plate.
By using a spherical electrode, the area of the insulated submitted to partial discharges is relatively large and well defined (compared to twisted pairs for exemple).
These specimens were submitted to strong ageing conditions where the temperature and the shape of the applied voltage have beencontrolled.The experimental setup may be found in Figure 2. The voltage supplied by this setup is a square voltage with a rising rate of about 30kV/s.
Figure 2. Experimental bench for lifetime mesurement under PWM stress.
Different stress levels (temperature, voltage, frequency) are applied on the samples. For each experiment, eight samples are tested simultaneously in an oven [18] and their lifetimes are recorded. All the lifetime values presented in Fig. 3, 4 and 5 are the result of the use of the Weibull’s statistical treatment [19]. The 90% confidence bounds are added on each experimental lifetime value. Taking into account the size of the confidence bounds and the fact that there is no overlap (in log scales) between them allow us to
get conclusion about the lifetime evolution versus voltage, frequency and temperature and prove that only eight samples are sufficient.
3.2 APPLIED STRESSES
When a rotating machine is fed by an inverter, two main reasons may lead to the beginning of partial discharges activity. First of all, over-voltages occur at the motor terminals. These over-voltages appear because the cable and the motor do not have the same impedance. Secondly, the transient voltage distribution within the motor coils is not homogeneous. Consequently partial discharges may occur between turns, phases and turns to ground.In our experiments, the ageing of the insulation is extrinsic (and not intrinsic), i.e.: due to the partial discharges effect. Indeed, the level of the applied voltage is sufficiently high to induce partial discharges between the spherical electrode and the insulation surface (see Figure 1). In order to use the DoE method, three factors of influence have been chosen:
• the applied voltage (square waveform) level: V • the frequency of the applied voltage: f
• the environmental temperature: T.
As other parameters should modify the ageing (i.e.: voltage dV/dt, moisture, pressure, thermal cycling,…), they will be considered in a forthcoming study.
4
THE DOE USED TO MODEL THE SECONDARY INSULATION LIFETIMEThe method that is used in this study to correctly design our experiment is composed of 4 steps allowing the correlation between factors and response. Indeed, the analysis may fail because of a lack of planning [20].
4.1 STEP 1: THE PREPARATION 4.1.1 DESIGN OBJECTIVES
The first objective of this study is to prioritize the effects of the different factors and their interactions. The second objective is to provide a mathematical relationship of the insulation lifetime.
4.1.2 CHOICE OF THE FACTORS
As mentioned before, three main parameters have been chosen to study their effects on the insulation lifetime: V, f and
T. The pre-experimental stage of our study consists of collecting data about the factors and response variation forms.
4.1.2.1 THE ELECTRICAL STRESS FORM Ageing experiments have been performed in a ‘partial discharges’ (PD) regime.A partial discharge may occur either on an insulator surface or in a gas pocket embedded in this insulator. Different species, such as ions and electrons, bombard the surface of the insulator. Polymeric insulators are not able to withstand such bombardments that can break chemical bonds (for example: C-H bonds). Moreover, these PD increase locally the temperature that may reach the melting temperature of the polymer. Chemical degradation of the
polymer (i.e.: oxidation) may also be initiated by active oxygen species such as O, O3, O2-, diffusing between the
polymer chains. These species are originated from gas decomposition. Finally, electrical trees may develop from discharging voids by charge injection into the polymer [21]. These mechanical, thermal and chemical effects will erode a hole through the polymer, leading to dielectric breakdown.
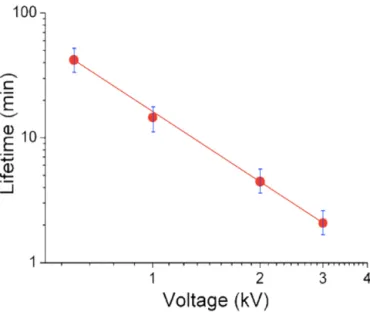
Under partial discharges activity, the inverse power model has been often applied to describe the voltage level (V) effect on the insulation lifetime (L) [9, 22-24]:
L = cV-n (1)
where c is a material constant and n is the power law constant. If L versus V is drawn in a log-log plot, the slope of the line according to equation (1) is n.Figure 3, drawn for f = 15 kHz and T = 180 °C, shows the linear evolution of the lifetime versus the applied voltage level, following formula (1).
Figure 3. Lifetime evolution versus the applied voltage: (f= 15 kHz and T=180 °C).
The use of the inverse power law in order to model the lifetime evolution versus electrical stress level has two advantages:
- it clearly shows a partial discharges inception voltage (PDIV), below which there is no extrinsic ageing - the inverse power law shows that the electrical stress
level strongly modifies the insulation lifetime in a partial discharge regime.
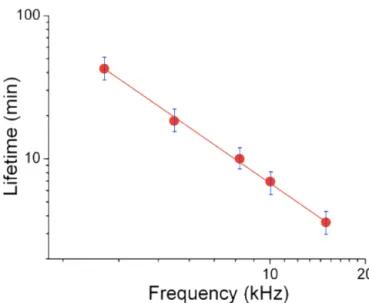
The same type of inverse power relationship has also been found versus frequency as shown in Figure 4, drawn for T =20 °C and V=+/- 3kV.
4.1.2.2 THE THERMAL STRESS FORM The operating temperature is well known to cause thermal stress in the winding, leading to deterioration and finally to the ultimate failure. This temperature is due to Joule’s heating, eddy current, stray load and core losses., High temperatures cause chemical degradations of polymeric materials, if they reach the degradation threshold.
Figure 4. Lifetime evolution versus frequency in a log-log plot (T=20°C and V = ± 3 kV).
Approximately, the oxidation process is considered to be a first-order chemical reaction governed by the Arrhenius law: L may be related to T by the relationship (firstly proposed by Dakin [25]):
L = Aexp(B / T) (2)
where A and B are assumed to be constant parameters. However, equation (2) is approximate, because:
- it can only be applied at high temperatures (and not under the thermal class of the studied polymers)
- there is more than only one chemical reaction occurring in the same time.
In this work, experimental results drawn in Figure 5 suggest that the evolution of L versus T is governed by the relationship (3) [26-27]:
log(L) = aexp(-bT) (3)
where a and b are constant parameters.
Both equations (1) and (3) show that, according to the lifetime evolution versus electrical and thermal stresses, log(L) should be studied versus log(E), log(f) and a form of exp(T).
4.1.3 CHOICE OF THE FACTOR LEVELS For each influential factor, we have to fix two levels (low and high values) to establish a simple DoE data matrix.These values may not be too far from the operating ones.
For the applied voltage, the two chosen levels are: ±1 kV and ±3 kV. ±1 kV may appear in ‘normal’ conditions if the impedances of the motor and its cable are strongly different. ±3 kV has been chosen to accelerate the ageing.
The chosen levels of the frequency are: 5 kHz and 15 kHz that correspond to nominal PWM frequencies of modern inverters.
The chosen values of the temperature are: -55 °C and +180 °C that correspond to aeronautic service conditions. It should be noted that +180°C is the thermal class of PEI-insulation.
Figure 5. Lifetime evolution versus temperature. (f=15kHz and V = ± 3 kV).
Table 1 indicates the factor forms and levels where (-1) is the low level value and (+1) is the high level value.
4.2 STEP 2: EXPERIMENTAL DESIGN CHOICE Efficient test plans have been developed by statisticians in order to analyze a phenomenon involving different factors, all varying differently in each experiment. In this study, we will use test plans known as “Full factorial designs”. It consists in combining all the levels of all the factors to identify the effect of all the factors on the response. By multiplying the number of levels of each factor, we obtain the number of experiments [28].
First of all, the effects and the interactions of just two of the three parameters will be investigated (the third parameter is fixed) [26]. As soon as the correct use of the method is verified, the effect of the all the three parameters (acting together) will be presented.
4.3 STEP 3: EXPERIMENTS
Accelerated ageing experiments have been undertaken. These experiments are detailed in Section 3.
4.4 STEP 4: DATA ANALYSIS: THE EFFECT OF TWO FACTORS
The “Full factorial design” is used to analyze the effect of two factors when fixing the third one at a given value. The number of tests to be done is consequently 22: 2 factors with 2
levels for each. In Table 2 (the experience plan) are reported all the possible combinations between the factors.In Table 2, the colored columns represent the experience matrix (noted X). The first column is the mean value of the ageing tests results (M). The level combinations of the factors (F1 and F2) and
their interactions (F1.F2) are presented in the other columns. Table 1. Factor forms and levels.
Factors Level: -1 Level: +1
Log(V)* Log(1) Log(3) Log(f)* Log(5) Log(15) Exp(-bT)** Exp(55b) Exp(-180b) *Voltage V in kV, frequency f in kHz and temperature T in °C
The response is given in the last column: the response matrix (noted Y). This response is the Weibull’s value of the insulation lifetime.
The effect of the different factors and their corresponding interactions are found by using a matrix product, as follows:
E
X1Yi (4)where Ê is the vector of the different actions effects, X is the experience matrix and Yi is the response matrix. This method
provides a mathematical model formulated by:
Y M EF1F1
EF 2F2
EF1F 2IF1F 2 (5) In this relationship, Y is the logarithm of the lifetime, M is the mean value of all the ageing tests, Fi are the factor levels, IFiFjare the interactions between the factor Fi and the factor Fj and
Ei are the effects of the factor levels or the effects of their
interactions on the response.
The actions effects values gives a first mathematical model (equation (5)) whose validity will be checked in § 4.4.1, 4.4.2 and 4.4.3 by performing one experiment at the middle of the level domain (i.e. level 0). This experiment corresponds to: Log(L) = (M).
4.4.1. VOLTAGE AND FREQUENCY EFFECTS In Table 2, F1 and F2 are respectively changed by Log(V)
and Log(f) while T=180 °C (kept unchanged).. By replacing the effect results in the relationship (5), the effect of both voltage and frequency levels (and their interaction) may be done by the following relationship:
log(L) 0.93 - 0.37log(V) - 0.19log(f) - 0.005log(V)log(f) (6) The results may be presented in a diagram form such as presented in Figure 6. From the left to the right, the columns represent: the average value M, the influence of the voltage V, the influence of the frequency f and the influence of the interaction of V and f.
Figure 6. Effects of the voltage and the frequency and their interaction.
At the middle of the domain, the corresponding experimental value of log(L) is: 0.99, the theoretical one is 0.93: the error level is 6.6 % only.
4.4.2 EFFECTS OF THE VOLTAGE AND THE TEMPERATURE
F1 and F2 are now changed respectively by Log(V) and
exp(-bT) while f=15 kHz (kept unchanged). Figure 7 indicates the corresponding effects; the model is given by:
log(L) 1.28 0.53log(V ) 0.54 exp(bT ) 0.05log(V )exp(bT )
(7) where b is an experimentally calculated (b = 5.64 10-3).
Figure 7. Effects of the voltage and the temperature and their interaction
At the middle of the domain the corresponding experimental value of log(L) is: 1.3, the theoretical one is 1.28: the error level is 2.4 % only.
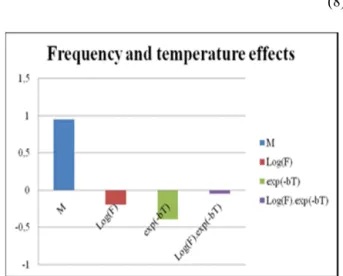
4.4.3 THE EFFECT OF THE FREQUENCY AND THE TEMPERATURE
F1 and F2 are now changed respectively by Log(f) and
exp(-bT) while V= ±3 kV (kept unchanged). Figure 8 indicates the corresponding effects; the model is given by:
log(L) 0.95 0.20 log( f ) 0.39 exp(bT ) 0.05log( f )exp(bT ) (8)
Figure 8. Effects of the frequency and the temperature and their interaction.
At the middle of the domain the corresponding experimental value of log(L) is: 0.88, the theoretical one is 0.95: the error level is 7.8 % only.
Table 2. Full factorial design matrix.
Test n° M F1 F2 F1.F2 Y
1 1 -1 -1 1 -
2 1 -1 1 -1 -
3 1 1 -1 -1 -
The analysis of Figures 6, 7 and 8 shows that:
- the effect of the voltage (V) and the temperature (T) on the lifetime is almost the same
- the effect of the voltage (V) and the temperature (T) on the lifetime are bigger than that of frequency (f) one - the interactions between (V), (T) and (f) are weak. Our first analysis has given satisfying results concerning the modeling of the insulation lifetime.Moreover, it was possible to quantify and classify the factors effects and their interactions. Now, the analysis of the impact of the three factors must be done.
4.5 DATA ANALYSIS: THE EFFECT OF THREE FACTORS
With three factors (2 levels by factor), 23 experiments have
to be performed. In Table 3 are reported all the possible combinations between the three factors. The colored part of Table 3 is the experience matrix while the responses matrix is presented in the last column [27].
The whole expected mathematical model of the insulation lifetime with three factors is finally given by:
Y M EF1F1
EF 2F2
EF 3F3
EF1F 2IF1F 2
EF1F 3IF1F3
EF 2F 3IF 2 F 3
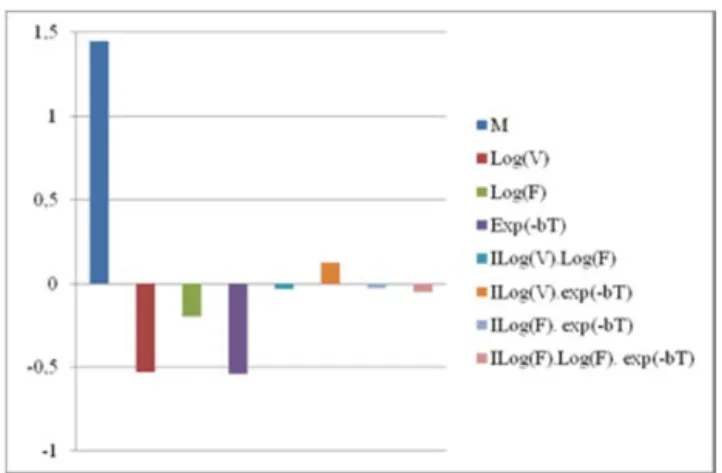
EF1F 2F 3IF1F 2 F3 (9)The relationship (9) has the same form as (5) with an additional third order interaction between the three factors. Introducing the results of Table 3 in equation (9), the insulation lifetime model becomes:
Log(L) 1.45 0.53log(V ) 0.19 log( f ) 0.54 exp(bT ) 0.03log(V )log( f ) 0.12 log(V )exp(bT )
0.03log( f )exp(bT ) 0.05log(V )log( f )exp(bT )
(10)
At the middle of the domain the corresponding experimental value of log(L) is: 1.43, the theoretical one is 1.45: the error level is 1.4 % only.
In the three-factors effect diagram of Figure 9, both voltage and temperature exhibit the highest impact on the insulation lifetime.
This analysis agrees well with the two-factors one and allows comparing the second (between two factors) and third (between three factors) order interactions between the different factors. The applied voltage and the temperature show the highest impact on the lifetime. Moreover, the higher a factor impact is, the higher its interaction is.
5
CONCLUSION
The main objective of this study was to model the electrical insulation lifetime (under partial discharges activity) of the secondary insulation of new equipment for the next generation of more electric aircraft and to better understand the influence of the different parameters acting together.
The DoE statistical method has been used to identify the influence of different operating factors and their corresponding interactions on the insulation lifetime. Accelerated ageing experiments have been conducted and the results analyzed to track the most influential parameters on the insulation lifetime.
To classify the impact of the studied factors (voltage, frequency and temperature) and their interactions, a reduced number of experiments are sufficient by using the DoE method. The main result is that the greater impact on the insulation lifetime is due to the applied voltage and the temperature rather than to the frequency.However, it must be considered that if the frequency was greatly increased, its effect would probably have been greater because of both dielectric losses and polarization.
Based on previous experimental results showing the evolution of the insulation lifetime (L) versus electric stresses (V and f) and temperature (T), taken separately, we have considered that Log(L) is linear with respect to Log(V), Log(f) and exp(-bT). Theoretical and experimental results at the middle of the domain have shown a good agreement.
To verify the good use of the DoE method, only three parameters have been used. In future investigations, more ageing factors will be taken into account, such as the effect of moisture, atmospheric pressure and thermal cycling whose effect on PD are well known.Moreover, only a simple structure of the insulation system, i.e. flat specimens, has been studied. The use of this method on a more realistic insulation system (i.e.: varnished twisted pairs) will be investigated in the future.
REFERENCES
[1] N. Lahoud, L. Boudou and J. Martinez-Vega, “A new approach to describe the electrical ageing by considering the distributed nature of processes in polymeric materials”, J. Non-Cryst. Sol., Vol 356, pp. 652-656, 2010.
[2] G. Mazanti, G.C. Montanari and L.A. Dissado, “Electrical ageing and life models: The role of space charge”, IEEE Trans. Dielectr. Electr. Insul, Vol. 12, No. 5, pp. 876-890, 2005.
[3] J.P. Crine, “On the interpretation of some electrical aging and relaxation phenomena in solid dielectrics”, IEEE Trans. Dielectr. Electr. Insul., Vol. 12, No. 6, pp. 1089-1107, 2005.
Figure 9. Effects of the voltage, the temperature and the frequency and their
interactions.
Table 3. Experience and response matrices for 3-factors plan.
. M F1 F2 F3 F1.2 F1.3 F2.3 F1.2.3 R 1 1 -1 -1 -1 1 1 1 -1 2.8 2 1 -1 -1 1 1 -1 -1 1 1.4 3 1 -1 1 -1 -1 1 -1 1 2.5 4 1 -1 1 1 -1 -1 1 -1 1.2 5 1 1 -1 -1 -1 -1 1 1 1.5 6 1 1 -1 1 -1 1 -1 -1 0.8 7 1 1 1 -1 1 -1 -1 -1 1.2 8 1 1 1 1 1 1 1 1 0.2
[4] T.J. Lewis, “Ageing – A perspective”, IEEE Electr. Insul. Mag., Vol. 7, No. 4, pp. 6-16, 2001.
[5] O.M. Nassar, “Motor insulation degradation due to switching surges and surge protection requirements”, IEEE Trans. Energy. Convers., Vol. EC-1, No. 3, pp. 182-189, 1986.
[6] V. Divljakovic and J. Kline, “Aging of magnetic wire in the presence of variable frequency, high rise time and high voltage pulses”, IEEE Conf. Electr. Insul. Dielectr. Phenom. (Arlington), pp. 391-399, 1994. [7] M. Melfi, A.M. Jason Sung, S. Bell and L. Skibinski Gary, “Effect of
surge voltage risetime on the insulation of low-voltage machines fed by PWM converters”, IEEE Trans. Ind. Appl. Vol. 34, No. 4, pp. 766-775, 1998.
[8] Partial discharge in electric motor fed by a PWM inverter: off-line and on-line detection, Billard, T. ; Lebey, T. ; Fresnet, F., IEEE Trans. Dielectr. Electr. Insul., Vol. 21, No. 3, pp. 1235-1242, 2014
[9] N. Lahoud, L. Boudou, C. Mayoux and J. Martinez-Vega, Dielectric
Materials for Electrical Engineering, ISTE Ltd and Wiley & Sons, Ch.
9, 2010.
[10] G.C. Stone, “The statistics of aging models and practical reality”, IEEE Trans. Electr. Insul., Vol. 28, No. 5, pp. 716-728, 1993.
[11] L. Guo and L. Parsa, “Torque improvement of synchronous reluctance machines by utilizing orthogonal experimental design methodology”, IEEE Conf. Ind. Electron. (Florida USA), pp 1427-1432, 2008.
[12] D.C. Montgomery, Design and Analysis of Experiments, John Wiley & Sons Inc, 2005.
[13] R.A. Fisher, The Design of Experiments, Oliver and Boyd (Edinburgh), 1935.
[14] L. Teck-Seng, C. Shixin and G. Xianke, “Robust torque optimization for BLDC spindle motors”, IEEE Trans. Ind. Electr., Vol. 48, No. 3, pp. 656-663, 2001.
[15] J. Faucher and P. Maussion, “On-line electrical quality improvement of a single-phase boost rectifier with fuzzy controller and experimental designs”, Electromotion Vol.13, No. 3, pp. 221-232, 2006.
[16] Y. Khelil, P. Maussion and T. Lebey, “Experimental designs for tracking the influential operating parameters on insulation reliability”, 7th IEEE Int’l. Sympos. Diagnostics for Electrical Machines, Power Electronics & Drives (Cargèse France), 2009.
[17] J.P. Crine, “When Taguchi meets water treeing”, IEEE Electr. Insul. Mag., Vol. 16, No. 3, pp. 13-18, 2000.
[18] M.Q. Nguyen, D. Malec, D. Mary, P. Werynski, B. Gornicka, L. Therese and P. Guillot, “Silica nanofilled varnish designed for electrical insulation of low voltage inverter-fed motors”, IEEE Trans. Dielectr. Electr. Insul., Vol. 17, No. 5, pp. 1349-56, 2010.
[19] W. Weibull, “A statistical distribution function of wide applicability”, ASME J. Appl. Mech., pp. 293-7, 1951.
[20] G.C. Peace, Taguchi Methods: A Hands-on Approach, Addison Wesley, New York, 1993.
[21] G. Bahder, T. Garrity, M. Sosnowski, R. Eaton and C. Katz, “Physical model of electric aging and breakdown of extruded polymeric insulated power cables”, IEEE Trans. Power App. Syst., Vol. 101, No. 6, pp. 1379-1390, 1982.
[22] G.C. Stone, E.A. Boulter, I. Culbert and H. Dhirani, Electrical
Insulation for Rotating Machines: Design, Evaluation, Aging, Testing and Repair, 2nd edition, Wiley-IEEE Press, pp. 43-71, 2014.
[23] L.A. Dissado and J.C. Fothergill, Electrical Degradation and
Breakdown in Polymers, ed G C Stevens, London: Peregrinus, 1992.
[24] H.S. Endicott, B.D. Hatch and R.G. Sohmen, “Application of the Erying model to capacitor aging data”, IEEE Trans. Comp. Parts, Vol. CP-12, pp. 34-41, 1965.
[25] T.W. Dakin, “Electrical insulation deterioration treated as a chemical rate phenomenon” AIEE Trans. 1, Vol. 67, pp. 2588-2597, 1948. [26] N. Lahoud, M.Q. Nguyen, P. Maussion, D. Malec and D. Mary, “Using
the design of experiments method to elaborate an electrical ageing model for the insulation of low voltage rotating machines fed by inverters”, IEEE Int’l. Conf. Solid Dielectr. (Potsdam, Germany), pp. 24-27, 2010.
[27] N. Lahoud, M.Q. Nguyen, P. Maussion, D. Malec and D. Mary, “Electrical ageing of the insulation of low voltage rotating machines fed by inverters: The use of the design of experiments (DoE)”, IEEE Int’l. Sympos. Electr. Insul. (San Diego), 2010.
[28] M. Tanco, N. Costa and E. Viles, “Experimental design selection: guidelines for practitioners”, Int’l. J. Prod. Qual. Manag., Vol. 4, No. 3, pp. 283-302, 2009.
Nadine Lahoud received the M.Sc. degree in
Polymer Materials Science from the Université
Claude Bernard Lyon1, France in 2005 and the Ph.D.
degree from the Université de Toulouse, France in 2009. Her thesis topic concerned the organic electrical insulation ageing. Thus, a phenomenological approach has been developed in order to describe the multi-parameters aspect of this process. In 2009/10, she held a postdoctoral position at Plasma and Energy Conversion Laboratory, where she worked on the use of the Design of Experiments for the electrical insulation lifetime modeling. Since two years, she is Associate Professor in Paul Sabatier University of Toulouse.
Manh Quan Nguyen was born in Hanoi, Vietnam,
on 27 August 1981. He received the M.Sc. degree in electrical engineering in 2008 and the Ph.D. degree in 2012 from Paul Sabatier University, Toulouse, France. His research interest concerns the electrical insulation of low voltage motors fed by inverters.
Pascal Maussion (member IEEE) got his M.Sc. and
Ph.D. degrees in Electrical Engineering in 1985 and 1990 from Toulouse Institut National Polytechnique (France). He is currently full Professor at the University of Toulouse and researcher with CNRS research Laboratory : LAPLACE, Laboratory for PLAsma and Conversion of Energy. His research activities deal with control and diagnosis of electrical systems such as power converters, drives, lighting and with the design of experiments for optimisation in control and diagnosis. He is currently Head of Control and Diagnosis research group in the LAPLACE. He teaches control and diagnosis in a school of engineers of the Université de Toulouse.
David Malec was born in France in 1964. He
obtained the Eng. degree in 1992 from the National
Conservatory of Arts and Crafts and the Ph.D.
degree in 1996 from Paul Sabatier University of Toulouse. He is Professor in the Electrical Engineering department of this University. His scientific activities deal with the study of solid insulating materials (polymers and ceramics) used in both low and high voltage electrical engineering domains. He is a Senior-member of the SEE (French Society of Electricians and Electronics Specialists) and an active member of the SFE (French Society of Electrostatics).
Dominique Mary was born in 1967 in Chenôve,
France. He received his M.Sc. degree in physics (electronic material and components) in 1990 from the Paul Sabatier University of Toulouse, France and graduated in the same year. Then he joined the Electrical Engineering Laboratory of Toulouse (LGET). He also received the Ph.D. degree in 1994. During his Ph.D. he spent few months in Québec (Canada) in the Research Institute of Hydro-Québec (IREQ). He joined the Paul Sabatier University in 1995 as an Associate Professor. His research activities concern the development of approach to electrical aging and space charge in polymeric materials based on electroluminescence analysis. He is a Senior-member of the SEE (French Society of Electricians and Electronics Specialists) and Head of the SEE-Midi-Pyrénées Group.