-1-THE CHEMILUMINESCENCE OF LUCIGENIN
by
Kenneth D. Legg
B.S. Union College
(1964)
Submitted in Partial Fulfillment
of the Requirements of the
Degree of
DOCTOR OF PHILOSOPHY
at the
MASSACHUSETTS INSTITUTE OF TECHNOLOGY
August, 1969
Signature of Author
Department
'
f YChemistry,
August 6, 1969
Certified by
Accepted by
Thesis Supervisor
Chairman,
Departmental (Committee on Graduate Students
Archives
NMSS NST. TTCH.This doctoral thesis has been examined by a Committee of the
Department of Chemistry as follows:
Professor David
N. Hume
Cha rman
Professor David M. Hercules
Thesis Supervisor
Professor Kerry W. Bowers
i
-2--3-,
The Chemiluminescence of Lucigenin
Kenneth D. Legg
Submitted to the Department of Chemistry on 6 August 1969 in partial fulfillment of the requirement for the degree of Doctor of Philosophy.
- Abstract
The electrochemical behavior of lucigenin has been studied in both aqueous and non-aqueous systems. The initial reduction of
lucigenin has been shown to proceed by a one-electron charge trans-fer step leading to the mono-cation radical of lucigenin. The charge transfer step is followed by a rapid disproportionation of the radical yielding dimethyl biacridene (DBA) as the end product. The rate constant of the following disproportionation step has been estimated as 8 x 10³ 1/M-sec. The oxidation of DBA has been shown to proceed via two, consecutive one-electron oxidations, occurring at the same potential, yielding lucigenin as the product.
The electrochemically generated chemiluminescence (ECL) of lucigenin has been studied in both aqueous and non-aqueous media. The non-aqueous ECL has been shown to arise from the reaction of superoxide with lucigenin. The spectral characteristics of the ECL, when compared with the fluorescence spectra and quantum effi-ciencies of N-methyl acridone (NMA), DBA and lucigenin allow iden-tification of the emitting species. NMA is the primary emitter formed in the excited state by the reaction of superoxide with lu-cigenin. In several systems a second, longer wavelength component of emission was observed. This was the fluorescence of either DBA or lucigenin, depending on their respective concentrations and quan-tum efficiencies. Both DBA and lucigenin act as energy acceptors from excited NMA via singlet-singlet energy transfer.
Chemiluminescence has been observed in three non-aqueous sol-vents (DMSO, DMF and acetonitrile) from the reaction of potassium tert-butoxide with lucigenin and oxygen. Spectra of this chemilum-inescence show the same gross behavior as those observed in the ECL studies. The same considerations as to extent of reaction, quantum efficiencies of acceptor fluorescence and energy transfer probabilities may be used to explain these spectra as were used for the ECL spectra. At high base and lucigenin concentrations a third yet unidentified product is formed.
-4-A study has been made of the quenching of lucigenin's fluores-cence by various anions,notably chloride. As in the case of amine quenching, a direct relationship between ionization potential of
the quencher and its quenching efficiency is seen. Rate constants for the quenching are diffusion controlled and a charge-transfer, mechanism is proposed. Photoreaction of lucigenin has been obser-ved and studies have shown this process to occur from the first excited singlet state of lucigenin.
Thesis Supervisor: David M. Hercules
-5-"THERE IS NOTHING - ABSOLUTELY NOTHING - HALF SO MUCH WORTH DOING AS SIMPLY MESSING ABOUT IN BOATS,"
The Water Rat
from
"The Wind in the Willows" by
-6-Acknowledgements
The author would like to thank Professor David M. Hercules for his help and encouragement during the course of the research. His willingness to allow the author to follow his own whims in this work
is especially appreciated. Thanks are also due to Professors David N. Hume and Kerry W. Bowers for their constructive criticism in pre-paring the final draft of this thesis.
A special note of thanks goes to Dr. Donald W. Shive for his invaluable aid and suggestions pertaining to the electrochemical measurements. The author is also indebted to Dr. Jack Chang for further aid in the electrochemistry and to Dr. Stanley Ness for building the Image Intensifier Spectrograph without which much of this work would have been impossible. The extent of help of the "group" as a whole cannot be estimated and I am greatly appreciative of their contribution.
The author wishes to thank the National Institutes of Health for a fellowship for the years 1965-1968.
Thanks are due to Miss Louise Harris for typing the manuscript and to Dr. Ness for proof reading the final draft.
Finally, the author would like to extend his most sincere thanks to his able "first mate" for her steady hand at the wheel during the past two years. How she has put up with him during this time is beyond understanding.
-7-Table of Contents
I. Index of Figures 10
II. Index of Tables 12
III. Introduction 14 IV. Experimental 16 A. Chemicals 16 B. Solvents 17 C. Solutions 17 D. Apparatus 17 1. Electrochemical Instrumentation 17 2. Electrochemical Cell 18 3. Spectroscopic Instrumentation 19 E. Procedures 20 1. Current-Voltage Curves 20 a) Current-Voltage Curves 20 b) Oscillograms 20 c) Coulometry 20 d) ESR 23 2. ECL 24
a) Qualitative Observation of ECL 24
b) Measurement of ECL Spectra 24
3. Energy Transfer 25
a) Quantum Efficiency Measurements 25
b) Lifetime Measurements 26
d8-a) Qualitative Observation of Chemiluminescence 27 b) Measurement of Non-Aqueous Chemiluminescence Spectra 27 V. Electrochemical Results 29 A. Cyclic Voltammetry 29 B. Coulometry 32
C. Scan Rate Studies 33
D. ESR 44
VI. Electrochemistry Discussion 47
VII. ECL Results 56
A. Production of Lucigenin ECL 56
B. Spectral Study of Lucigenin ECL 57
1. Non-aqueous ECL Spectra 57
2. Aqueous ECL Spectra 64
C. Summary of ECL Results 64
D. Energy Transfer Studies 79
VIII. ECL Discussion 94
A. Qualitative Observations 94
B. ECL Spectra 95
C. Singlet-Singlet Energy Transfer Studies 101
D. Correlation of ECL Spectra with Quantum
Efficiencies of Acceptor Fluorescence, Extent
of Reaction and Energy Transfer 103
IX. Preliminary Investigations of the Non-Aqueous
-9-A. Results 109 1. Qualitative observations 109 2. Chemiluminescence Spectra 109 B. Discussion 109 1. Qualitative observations 109 2. Chemiluminescence spectra 126
Appendix A. Quenching of Lucigenin Fluorescence 128
References 146
I. Index of Figures
IV-1 Cell used for taking ECL spectra 21
V-I Current - voltage curves for lucigenin and oxygen
in DMSO at platinum and in water at mercury 30
1/2
V-2 Current function (i/ V 1/2) corrected for
concen-tration vs scan rate for lucigenin reduction in DMSO 39 1/2
V-3 Current function (ip/V ) vs scan rate for DBA
oxidation in DMSO 42
V-4 Current-voltage curve of lucigenin in DMSO at a
scan rate of 80 V/sec. 45
VII-1 ECL spectra in DMSO 58
VII-2 ECL spectra in DMF 60
VII-3 ECL and fluorescence spectra in DMF 62
VII-4 ECL spectra in AN 65
VII-5 ECL spectra in AN at various times of reaction 67
VII-6 ECL and fluorescence spectra in Ethanol 69
VII-7 Sensitivity curve for the Image Intensifier Spectrograph 71
VII-8 ECL spectra in water 73
VII-9 "Classical" CL spectra in water 75
VII-10 Fluorescence and ECL spectra in water 77
VII-11 Fluorescence quenching of NMA by DBA in DMSO 80
VII-12 Stern-Volmer plot for energy transfer from NMA to
lucigenin in DMSO 84
VII-13 Overlap of NMA fluorescence with DBA and lucigenin
absorption 88
VII-14 Probability plots for energy transfer from NMA to DBA
and lucigenin in AN 90
VIII-1 Corrected ECL spectra in AN 96
VIII-2 Comparison of ECL spectra taken on the Aminco-Bowman
-11-IX-1 Chemiluminescence Spectra in DMSO 110
IX-2 Chemiluminescence Spectra in DMF 112
IX-3 Chemiluminescence and Fluorescence Spectra in DMF 114
IX-4 Chemiluminescence Spectra in AN 116
IX-5 Chemiluminescence Spectra in AN at Various Flow Rates 118
IX-6 Absorption and Fluorescence Spectra of Compound Formed by Reaction of lucigenin with KOtBu in AN
IX-7 NMR Spectrum of lucigenin in trifluoroacetic acid 124
A-I Relationship between Ionization potential of amines and
their efficiency of quenching lucigenin fluorescence 133
A-2 Absorption spectra of lucigenin in water before and
after photoreaction 136
A-3 Amount of photoreaction (AA) vs lifetime of lucigenin
fluorescence at various chloride concentrations 141
A-4 State diagrams showing mode of, energy dissipation in
-12-II. Index of Tables
V-1 Coulometry of Lucigenin Reduction in DMSO 34
V-2 Coulometry of DBA Oxidation in DMSO 35
V-3 Scan Rate Study of Lucigenin Reduction (2.14 X 10- 3
M
lucigenin in DMSO) - 36
V-4 Scan Rate Study of Lucigenin Reduction (1.07 X 10- 2
M
lucigenin in DMSO) - 37
V-5 Scan Rate Study of Lucigenin Reduction (2.14 X 10- 2
M
lucigenin in DMSO) - 38
V-6 Scan Rate Study of DBA Oxidation in DMSO 41
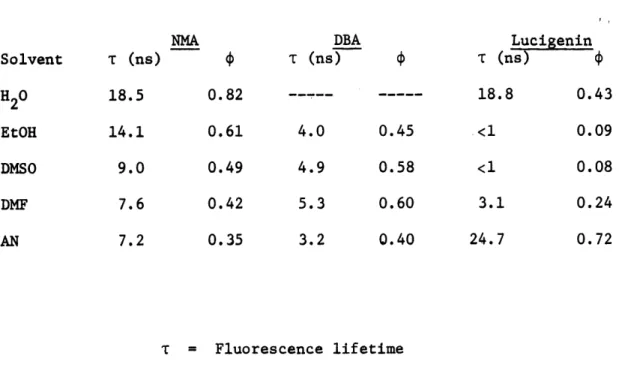
VII-1 Fluorescence Lifetimes and Quantum Efficiencies 82
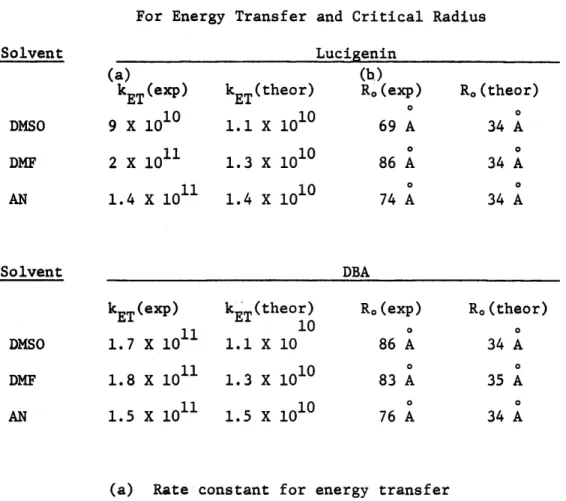
VII-2 Experimental and Theoretical Rate Constants for Energy
Transfer and Critical Radius 86
VII-3 Concentration of Acceptor where Total Probability of Energy Transfer and the "Trivial" Process from NMA
Equals 0.5 93
A-I Anion Quenching of Lucigenin Fluorescence 130
A-2 Quenching of Lucigenin Fluorescence by Amines 131
A-3 Chloride Quenching of Lucigenin Fluorescence in Various
Solvents 135
A-4 Photolysis of Lucigenin as a Function of Chloride
-13-Commonly Occurring Structures and their Abbreviations Structure CH3
0
'00
C)b
Name Abbreviation Luciguin CH 3 CH3 gO0O 0ONODimethyl biacridene DBA
N-methyl acridone Dimethylsulfoxide Acetonitrile (CH3)2 N-COH KOC(CH3)3 Dimethyl Formamide DMF Potassium tert-butoxide CH 3
CHi
II NMA (CH3) 2SO CH3CN DMSO KOtBu
4-14-III Introduction
Chemiluminescence (CL), the production of light from a chemical reaction, is not an unusudlphenomenon. Indeed, light emission, albiet low level, has been shown to occur in a seemingly endless number of re-actions. The phenomenon is not new since CL was observed from the oxi-dation of Lophine in 1877 (1). Luminol (2) and lucigenin (3) are two of the best known examples of chemiluminescent reactions and have re-ceived a great deal of attention because of their intense emission.
Most solution CL studied to date falls into one of four major categories: reactions involving molecular oxygen or peroxides (4), oxidation of an-ion radicals (5), alternating current electrolysis of aromatic hydro-carbons (6,7) and reduction of ruthenium chelates (8).
The chemiluminescence of lucigenin (dimethyl biacridinium ion) is a reaction involving peroxide, and was first reported in 1935 by
Gleu and Petsch (3). They observed intense CL when lucigenin was treated with hydrogen peroxide in basic solution. It was also observed that the emission was either green or blue, depending on the conditions under which the reaction was run. Addition of alcohols, reducing agents or
heating caused the emission to change from green to blue (3, 9, 10). N-met4yl acridone, the major product of the reaction, was tentatively
(10) and later conclusively (11) identified as the primary emitter in the blue CL reaction. Kautsky and Kaiser (9) attributed the green emission to lucigenin fluorescence excited by emission from N-methyl acridone. This was later shown not to be the case by Spruit-van der Berg (10). Until now the green emitter had not been identified.
Since the discovery of the lucigenin CL, numerous studies have been carried out concerning its mechanism (9-16). The subject has been re-viewed by McCapra (17) and Gundermann(4). The reaction has been shown
to be of a redox type (2, 11, 18) but the exact nature of the redox step has not yet been ascertained. The electrochemistry of lucigenin has been briefly treated by Totter (11) but an extensive analysis of its behavior has not been reported.
The electrochemical generation of lucigenin CL at a platinum electrode in basic solution was reported by Tammamushi and Akiyama
(19). They observed light at the platinum cathode, along the path of hydrogen evolution. No further work has been reported concerning the electrochemically generated CL (ECL) of lucigenin.
Driscoll et. al. (20) have reported the observation of lucigenin CL in methanol by reaction with potassium t-butoxide. Observation of this CL in other non-aqueous solvents has not been reported.
The purpose of the present investigation was two-fold. First, it was evident that a detailed study of the electrochemical behaviour of lucigenin would be of interest as applied to redox nature of the CL reaction. The second objective was the production of lucigenin CL in non-aqueous media. It was hoped that, like luminol, the CL process in non-aqueous media would be simpler than that seen in water. The production of lucigenin CL by electrochemical means seemed to be the logical starting place for such studies.
-16-IV. Experimental
A. Chemicals
Lucigenin (nitrate salt) was obtained from Columbia Organic Ch4mi' .cals and was recrystallized twice from 1:1 methanol-ethanol before use.
N-methyl acridone was obtained as a sample synthesized in the MIT Organic Laboratories (21) and was recrystallized from ethanol until a constant melting point of 2020 - 2030 C was obtained.
Dimethyl biacridene (DBA) was prepared according to Decker and Petsch (22). 5 grams of lucigenin were dissolved in 75 ml of Glacial Acetic acid. 25 grams of zinc pellets were added and the solution was
allowed to stand overnight. The DBA produced is insoluble in the re-action medium and the bulk precipitates out on the zinc surface. The zinc-DBA precipitate was washed thoroughly with water and dried in a vacuum oven at 1000. The DBA was then dissolved in chloroform and, after concentration in a rotary evaporator, recrystallized twice from chloroform. 2.5 grams of DBA were obtained from the recrystallization.
Tetrabutyl ammonium perchlorate was prepared from 1 M tetrabutyl ammonium hydroxide (Southwestern Analytical). 70% perchloric acid
(G. Frederick Smith) was diluted 1:1 with water and was added dropwise with stirring to the hydroxide until the solution was acidic (pH -2). The precipitated perchlorate was collected by filtration and washed several times with hot water to remove all traces of acid. The per-chlorate was then recrystallized twice from 70% H20 -30% methanol and
dried in a vacuum oven at 1000.
Potassium t-butoxide was used as obtained from MSA Research Corp-oration. It was stored in a dry nitrogen atmosphere to ensure no
re-action with water.
Baker Analyzed Reagent 30% Hydrogen Peroxide was used as obtained. All other organic and inorganic chemicals used were reagent grade or better.
B. Solvents.
Absolute ethanol (U.S. Industrial Chemicals Co.) was used as obtained.
Dimethyl Sulfoxide, Dimethyl Formamide (Matheson, Coleman and Bell, spectroscopic grade) and Acetonitrile (Eastman Chemicals, spec-troscopic grade) were dried over molecular sieves before use.
All other solvents used were of spectroscopic grade when avail-able or reagent grade or better.
C. Solutions.
Solutions of most reagents were made by weighing the reagent and dissolving it in the appropriate volume of solvent. Solutions of DBA were prepared by saturating the solvent with DBA and determining its concentration by its absorption at 420 nm (E at 420 nm = 1.66 X 10). H202 solutions were prepared by appropriate dilution of 30% H
202.
Solutions of HC1 or NaOH were prepared by dilution of 1 M stock solu-tions of Accu-Lute reagent.
D. Apparatus.
1. Electrochemical instrumentation.
Potentiostat. A potentiostat constructed by D. W. Shive was used in the direct electrochemical studies. This instrument and its use are described in detail elsewhere (23).
-18-Recorder. A Houston HR-97 X-Y recorder was used to record the current-voltage curves for scan rates up to 0.333 V/sec.
Wave Generator. A Wavetek triangular wave generator was used to drive the potentiostat for scan rates greater than 0.333 V/sec.
Oscillograms. Oscillograms were obtained by use of a Tektronix Model 536 oscilloscope equipped with a Type 53A plug-in unit. The traces were photographed on polaroid film using a Tektronix Model C-12 camera with projected graticule.
Current Integrator. A current integrator (24) was used in the coulo-metric measurements. This consisted of a Nexus SQ-3 operational
ampli-fier connected to the current ampliampli-fier of the potenticstat. through a 5 meg ohm resistor. A 10F capacitor was in the feedback loop of the integrator. The output voltage of this network is a direct function of the coulombs passed and is equal to 5 X 10- 2 E. ( in Volts) coulombs.
The output voltage of the current integrator was measured on a Hewlett Packard Model 344A digital volt meter.
2. Electrochemical cell.
A standard three electrode cell was used in all electrochemical measurements. The reference electrode was Ag/AgCl in 0.1 M aqueous KC1. The reference electrode was separated from the bulk of the solution in
the cell with a porous Vycor plug. The counter electrode consisted of a 2 cm2 platinum foil and was isolated from the test solution by a fine glass frit. The indicator electrode was a platinum sphere of 5.53 X 10- 2
2
cm area. 0.1 M tetrabutylammonium perchlorate was used as supporting electrolyte in non-aqueous solutions and 0.1 M KC1 in aqueous media. For coulometric measurements a 2 cm2 platinum foil working electrode was used. Provision for bubbling with N2 was provided.
3. Spectroscopic Instrumentation.
Aminco-Bowman Spectrofluorometer. This instrument is described by Lytle (8) and was used without modification. It employs two Aminco grating monochromators (4-8401) mounted on an optical bench. The exci-tation monochromator is blazed for 300 nm while the emission monochrom-ator is blazed for 500 nm. The sample chamber may be used for either fluorescence or chemiluminescence measurements. The detector is an E.M.I. 9558QA photomultiplier of S-20 response. This particular tube yielded a sensitivity of 300 amps/lumen. Spectra were recorded on a Hewlett Packard Model 7005B X-Y recorder.
Absolute SpectroFluorometer. For routine fluorescence studies and quantum efficiency measurements a Turner Model. 210 absolute spectro-fluorometer was used. This instrument and its use are described by the Turner manual (25) and by Turner (26).
Spectrophotometer. Absorption spectra were recorded on a Cary Model 14 spectrophotometer.
Image Intensifier Spectrograph (IIS). An IIS was used to measure ECL spectra. The optical system was constructed according to Bass and Kessler (27), in conjunction with an RCA C70021 HP2 Image Intensifier tube, and is described by Ness and Hercules (28). A Polaroid camera using type 107 film was used to record the spectra. This has the ad-vantage that the results are immediately available. However, since
this film is available only in positive form, negatives have to be made before the spectra can be analyzed on a recording densitometer.
Recording Densitometer. A Leeds and Northrup recording micro-photometer (L & N 6700 A2) was used to record the IIS spectra. This instrument and its use is described in the L & N manual DB-1325 (29).
-20-31A nanosecond fluorometry system.
Electrochemical. The potentiostat used consisted of Heath EUA-14-A operational amplifiers along with a Heath EUA-19-2 polarography module. A three electrode cell was used with a platinum counter electrode iso-lated from the bulk of the solution by a fine glass frit. A reference electrode of Ag/AgCl in 0.1 M KC1 was used and was isolated from the test solution by a porous Vycor plug. Both platinum foil and mercury pool indicator electrodes were employed. Provision for bubbling N2 or
02 through the solution was included.
The cell used for taking ECL spectra is shown in Figure IV-1. A platinum wire was used as a reference electrode in this cell due to space limitations.
Syringe Drive. The syringe drive-"T" mixer combination used in the flow measurements has been described in detail by Lytle (8).
E. Procedures
1. Electrochemical
a) Current-voltage curves. Standard techniques were used in obtaining current voltage curves for scan rates up to 0.333 V/sec.
b) Oscillograms. For scan rates greater than 0.333 V/sec the Wavetek triangular wave generator was used to drive the potentiostat and the current voltage curves were recorded on an oscilloscope. The scan rates for a given run were calculated by noting the voltage range per cycle and the value of the cycles per second applied from the Wave-tek. Residual currents were estimated to subtract capacity currents in obtaining peak currents from these data.
c) Coulometry. The current integrator described above was used in the coulometry measurements to determine n for the reduction of
-21-Figure IV-1
Cell Used For Taking ECL Spectra
Indicator
Lead
Reference
Lead
-Counter
Electrode
"
Fine Glass
Pt Wire
-Reference
Electrode
Frit
I cm Cell
Pt Indicator
Electrode
ECL
CELL
Li~
-23-lucigenin and na for the oxidation of DBA, n being the number of elec-trons involved in the charge transfer step. 50 ml of a known
concentra-tion of lucigenin were introduced into the electrochemical cell. DMSO was used as the solvent to minimize evaporation of solvent during bub-bling with N2 . A current-voltage curve was taken using the small spher-ical indicator electrode. A proportionality constant was then calcu-lated by dividing the known moles of lucigenin present initially by the initial peak current in cm.
The current integrator was then connected, the large working elec-trode substituted for the platinum sphere and bubbling with nitrogen started. A constant potential of -0.35 V vs Ag/AgCl was then applied. After sufficient electrolysis (~-10 min.) the applied potential was shut off and the voltage output of the current integrator was measured with a digital volt meter. The number of coulombs passed during the electro-lysis was calculated by the relationship noted above. A second current-voltage curve was then recorded, using the small sphere as the indica-tor in quiescent solution. The difference in initial and final peak currents, when multiplied by the calculated proportionality constant gives the moles of substance reduced or oxidized. The moles of elec-trons passed was calculated by dividing the coulombs passed by 9.65 X 10⁴ Dividing the moles of electrons passed by the moles reduced (or oxidized) gives n or na . The procedure was repeated and n was taken as the aver-age of several runs.
d) ESR. A Varian Model E-3 ESR instrument was used to detect the presence of radicals in the lucigenin reduction. A two electrode cell was used consisting of a platinum wire indicator electrode and a mercury
drop reference electrode. Standard techniques were used in observing the ESR signal obtained.
-44'r
2. ECL
a) Qualitative Observation of ECL. The three electrode cell with Ag/AgCl reference electrode was used in these measurements. Current-voltage curves were recorded on a Houston Model HR-100 X-Y recorder.
-3
Solutions were approximately 10- 3 M in lucigenin and were saturated with oxygen by bubbling for five minutes.
A mercury pool was used as the indicator electrode for aqueous solutions while a platinum foil indicator electrode was used in
non-aqueous media. A current-vwtage curve for the solution to be studied was recorded and a constant potential was then applied corresponding
to the potential at the peak of the oxygen reduction wave. Light emission was observed visually.
b) Measurement of ECL Spectra. Initial measurements were made using the Aminco-Bowman spectrofluorometer in conjunction with the ECL cell shown in Figure VI-1. The excitation source was not used. The slits of the emission monochromator were opened to 3 mm. The photo-mujtiplier was operated at 1750 V for greatest sensitivity. At these settings the signal to noise ratio was 20 to 1. The results of these measurements have been reported by Legg and Hercules (30).
ECL spectra of higher resolution and less distortion were obtained by use of the Image Intensifier Spectrograph (IIS). Exposure times from
5 to 20 seconds gave satisfactory results. Over-exposure of the Polaroid plate resulted in a flattening of the spectra and such spectra were
dis-carded. Since the intensity of the ECL varied over a wide range during and between measurements several pictures of varying exposure times were taken and the best exposure was used.
The Polaroid Camera was mounted on a variable position rack and up to nine exposures could be taken on one photograph. A small mercury
-25-pen lamp (Edmund Scientific Co. No. 70,298) was used to obtain calibra-tion lines. Two sets of calibration lines were taken, one at the top and one at the bottom of the plate.
The slits were set at 3-4 mm for ECL spectra and at 0.01 mm for mercury lines and fluorescece spectra. Exposure times of 1/100 sec. were used in recording fluorescence and calibration spectra.
Fluorescence spectra for comparison with the ECL spectra were also taken on the IIS. The solutions to be studied were excited by the mercury pen lamp with a 380 nm low pass filter between the source and cell.
Photographic negatives were made of the Polaroid positive records of the spectra. These negatives were scanned on the Leeds and Northrup recording densitometer. Calibration lines were also scanned for each spectrum. Since the spectrograph uses a grating for dispersion, the spectra obtained from the densitometer are linear in wavelength and were plotted as such. Care had to be taken that the negative was placed in the plate holder so the spectra were exactly horizontal.
This was facilitated by having the calibration lines at the top and bottom of the negative and alignment was assured by keeping the
3650 A Hg lines (top and bottom) on the same vertical line.
3. Energy Transfer.
a) Quantum Efficiency Measurements. Quantum efficiencies of fluorescence were measured on a Turner Model 210 absolute spectroflu-orometer. The method of determining quantum efficiencies with this instrument has been described by Turner (26). Absorbances of the solutions were measured on a Cary Model 14 spectrophotometer. Care
was taken that all solutions showed absorbances less than 0.22, to eliminate distortion of the fluorescence spectra due to self absorp-tion. Quinine sulfate in 0.1 M H2SO, f = 0.55 (31) was used as
a standard. Integrated fluorescence intensities were measured using a planimeter. The quantum efficiency was calculated by:
S A X D s u exs s
u s S A X D
u s exu u
where u and s are the quantum efficiencies of the unknown and stand-ard respectively, A and A their excitation wavelengths, S and
exu exs u
S their sensitivity settings on the spectrofluorometer, A and A the respective areas of fluorescence and D and D the absorption
u s
of each solution.
b) Lifetime Measurements. The use of the TRW Model 31A nanose-cond fluorometry system for measuring lifetimes of fluorescence is described in the TRW handbook (32). A deuterium lamp was used as the source because its light pulse had a shorter decay time (2ns) than
0
did the nitrogen lamp. A 3600 A broad pass filter was used between the source and the sample. For measuring NMA lifetimes a 425 nm interference filter was used between the sample and the photomulti-plier. A 490 nm broad pass filter was used in measuring lifetimes for lucigenin and DBA.
Because many of the lifetimes measured were less than 10 ns. the internal photomultiplier was not used and only the external photo-multiplier was employed. A suspension of aluminum hydroxide in water was used as a scatterer when the light pulse profile was measured. Care was taken to use the lowest possible photomultiplier voltage
2 7L
to eliminate saturation of the tube. The apparatus was set up for each experiment so that the photomultiplier voltage and oscilloscope gain settings could be left unchanged during a series of measurements. Differences in intensities of fluorescence were compensated'for by use of an iris diaphragm between the source and the sample. Round cells were employed to minimize differences in cell geometry between measure-ments.
Studies of singlet-singlet energy transfer between NMA* and both DBA and lucigenin were done on this instrument. The acceptor concentration was varied while the donor (NMA) concentration was
-5
kept constant at 10 M. Use of the 425 nm isolation filter allowed measurement of only NMA emission. Decreasing fluorescence intensity from NMA as the acceptor concentration was increased, was compensated for by opening the diaphragm until the fluorescence pulse was of the same height as that previously measured.
4. Non-Aqueous Chemiluminescence.
a) Qualitative observation of chemiluminescence. Solutions of lucigenin and potassium t-butoxide (KOtBu) were prepared in DMSO, DMF and AN. The solution containing lucigenin was saturated with oxygen and that containing KOtBu was purged with nitrogen by bubbling in a glove bag. The solutions were then mixed and light was visually observed.
b) Measurement of nouaqueous chemiluminescence spectra. The spectra of the non-aqueous CL generated by the reaction of oxygen,
KOtBu and lucigenin were measured on the Image Intensifier Spectrograph. Small test tubes were filled with 2 cc of the lucigenin solution in the
appropriate solvent and were sealed with a serum cap. This solution was then saturated with oxygen by bubbling through a syringe needle. The solution containing KOtBu was purged with nitrogen and icc was admitted into the test tube by use of the syringe. Care had to be taken when DMSO was used as the solvent that the concentration of base was not excessive as decomposition of the solvent by reaction with base and oxygen was noted. The syringe drive was used to provide
continuous mixing of the reagents. 100 ml syringes were used and the emission was viewed 1 cm below the mixing "T". At flow rates of 3.75 and 77.4 ml/min this distance corresponds to a time after mixing of 5 X 10 and 2.5 x 10 sec respectively. The preparation of the solutions to be mixed was the same as described above.
-29-V. Results Electrochemistry
A. Cyclic-voltammetry
Electrochemical studies were done in both aqueous and non-aqueous media. Typcial current-voltage curves for lucigenin and oxygen in DMSO at a platinum electrode (curve A) and in water at a mercury elec-trode (curve B) are shown in Figure V-1. The solid line in curve A is the voltammogram obtained with only lucigenin present in the solu-tion. The wave peaking at -0.30V (vs Ag/AgC1 in 0.1 M KC1) corresponds to the reduction of lucigenin and that peaking at +0.45V corresponds to the oxidation of lucigenin's reduction product. The dotted line in curve A is obtained with only oxygen present. The wave peaking at -0.9 V is the reduction of 02 to superoxide (0-O) and that peaking (anodic current) at -0.85 V is the reoxidation of.superoxide to oxygen. The dotted line in curve B is the reduction of oxygen to
OH- and H202 in water at Hg and the solid line is lucigenin's reduction
wave in H20 at Hg.
The lucigenin reduction product is insoluble in water and plated out on a platinum electrode in. aqueous solution. This product was isolated by washing the plated electrode with distilled water, drying, and dissolving the product. in chloroform. A mass spectrum of the product was taken and a major M/e peak at 386 was observed. This mass
corresponds to the molecular weight.of the two-electron.reduction pro-duct of lucigenin, dimethyl biacridene (DBA). A sample of DBA was pre-pared by the method of Decker and Petsch (22). The mass, IR and UV spectra of the synthesized DBA.were identical to those obtained for
-30-Figure V-1
Current-voltage curves for lucigenin and oxygen in DMSO at Pt(Tetrabutyl ammonium perchlorate sup-porting electrolyte, 0.1 M) and in H20 at Hg (0.1 M
KCL supporting electrolyte) both vs Ag/AgCL in 0.1 M KCL.
A lucigenin in DMSO
- - - oxygen in DMSO
B - lucigenin in H2Q
+1 Volt
i
\
I
I
I
/
/
/
\
1'-I
Volt
-I Volt
50
40
30
20
I0
-10
-20
-30
30
20
10
c.
c
:30
-10
-20
-30
-32-by reduction in non-aqueous media gave the same spectral data. On this basis DBA was identified as the electrochemical reduction product of Lucigenin in both aqueous and non-aqueous solvents.
Referring back to Figure V-lA, if the potential was swept anodi-cally with only lucigenin present no anodic peak was observed at +0.45V. If, however, after scanning cathodically over the lucigenin reduction wave the potential was scanned anodically, the peak at +0.45 V was
ob-served. When DBA was present in solution no wave peaking at -0.30 V was observed until an anodic scan had been made over the DBA oxidation
peak at +0.45 V.
The peak potential of the lucigenin reduction and DBA oxidation were found to be independent of pH over the range 4.7 - 10.0 in aqueous solution. In non-aqueous media these potentials were found to be un-affected by addition of either HC1 (dissolved gas) or KOH.
B. Coulometry
Attempts to determine the value of n, the number of electrons in-volved in the electrochemical reduction of lucigenin, by use of a Hydro-gen-Nitrogen gas coulometer (33) proved unsatisfactory. This was due to the low currents encountered and the subsequent small volumes of gas evolved. More satisfactory results were obtained when the current was electronically integrated. Coulometry of the lucigenin reduction in aqueous solution proved impossible due to rapid plating of the elec-trode by DBA, which inhibits further reduction of lucigenin. DMSO was chosen as the solvent because of its low volatility and consequent
minor concentration changes due to evaporation of solvent while
bubbling with nitrogen during electrolysis. The results of the coulo-metric measurements of n for lucigenin in DMSO are summarized in
Table V-i. The average of 8 determinations gave a value for nc of 1.96. Coulometry was also used to determine the value of n for the
a
oxidation of DBA in DMSO. A saturated solution was prepared and its concentration determined by spectrophotometryusing E at 420 nm as 1.66 X 10. The results of the coulometric determinations for the DBA oxidation are summarized in Table V-2. The average value of na was found to be 2.06.
C. Scan Rate Studies
To determine what, if any, kinetic complications were involved in the electrochemistry of lucigenin, studies were made concerning
the behavior of the reduction wave of lucigenin and the oxidation wave of DBA as a function of scan rate. A three electrode cell was used and at low scan rates care was taken to allow the solution to
come to rest after bubbling (1 minute) before the scan was begun. The cell itself was jacketed to prevent thermal convection. For scan rates greater than 10 V/min an oscilloscope was used for recording the
current-voltage curves.
The results of these studies on the lucigenin reduction wave in DMSO at various concentrations are shown in Tabls V-3 - V-5 and the normalized peak current (ip/V / 2) corrected for concentration plotted
vs. scan rate is shown in Figure V-2. Similar studies were made on the oxidation wave of DBA in DMSO and are presented in Table V-6.
h 1/2
The current function (i p/V ) vs. scan rate plot is shown in Figure V-3. Scan rates greater than 2 X 10
-1 V/sec gave ill defined values of ip due to merging of the oxidation wave with the solvent oxidation.
-34-Table V-I
Coulometry of Lucigenin Reduction in DMSO
k = 8.3Xl0-6M/cm -0.325V vs Ag/AgCL Constant Potential Electrolysis
k rn 8.3X10 M/cm -0.325V vs AgAgCL Constant Potential Electrolysis
Ai Moles Reduced ).75 6.23.X 10-7
-6
L.35 1.12 X 10 .80 1.49 X 10- 6 .30 1.91 X 10- 6 k= Ai Moles Reduced 6.05 5.30 4.70 4.25 3.75 ip 5.35 5.00 4.30 3.75 3.30 3.27 9.82 1.50 1.92 X 10- 7 X 10- 7 X 106 X 106 Eo (total) 2.05 V 4.02 V 5.71 V 7.36 V 9.35 X 10⁻⁶M/ Eo (total) 1.37 V 3.87 V 5.81 V 7.24 V Coulombs Moles e 1.03X10⁻¹ 2.01X10 1-1i
2.86X10 1 -i 3.68X10⁻¹ cm(a) Coulombs -2 6.85X10⁻² 1.94X10⁻¹ 2.91X10⁻¹ 3.62X10⁻¹ average of 8 runs n = 1.96 c(a) electrode area different from above
0 1 1 2 0.35 1.05 1.60 2.05 1.07X10 6 2.08X10- 6 -6
2.96X10
- 6 3.81X10- 6 Moles e 2.10X10- 7 2.01X10- 6 3.02X10- 6 3.75X10- 6 1.72 1.86 1.99 1.99 n 2.17 2.05 2.01 1.92Table V-2
Coulometry of DBA Oxidation in DMSO -5 50 cc l.li X i0 M DBA k = i Moles Oxidized .65 1.61 X 10⁻⁷ .64 V -5 50 cc 1.21 X 10- 5 M DBA i Moles Oxidized E0 2.47 X 10- 7 M/unit Moles e -7 3.32 X 10-k = 3.90 X 10⁻⁷ k = 3.90 X i0 Moles e 9.75 X 10- 8 2.34 X 10- 7 .40 V .90 V 2.07 X 10- 7 4.66 X 10- 7
average of three runs na = 2.06a
2.25 1.60 2.06 1.55 1.30 0.95 .25 .60 2.12 1.99 --u14 ~-ff~r~ i
-
5- -36-Table V-3
v(V/sec)
1.67 X 10- 33.33 X 10
- 38.34 X 10
- 31.67 X 10
- 23.33 X 10
- 28.34 X 10
- 2 1.67 X 10- 1 -1 3.33 X 101 4.64 X 10-11.17
2.32 4.64 17.728.0
56.0 140.0Scan Rate Study (2.14 X 10⁻³ 4.09 X 10- 2 5.77 X 10- 2 9.15 X 10- 2 1.29 X 10⁻¹ -1 1.83 X 10 2.89 X 10- 1 4.09 X 10⁻¹ 5.78 X 10⁻¹ 6.75 X 10⁻¹ 1.08 1..53 2.15 4.21 5.30 7.50 11.8 of Lucigenin Reduction M Lucigenin in DMSO) ip (Pla) ip/,v X 10 0.93 2.26 1.28 2.24 1.94 2.12 2.61 202 3.52 1.92 5.20 1.80 6.95 1.70 9.25 1.60 10.4 1.54 14.6 1.36 18.4 1.20 24.1 112 41.2 0.98 50.8 0.96 72.0 0.96 113.0 0.96 Ep-Ep/2 40 40 40 45 40 40 40 45 50 60 60 60 65 70 70 80
V(v/sec)
1.67 X 10
- 33.33 X 10
- 38.34 X 10
- 3-2
1.67 X 10
3.33 X
10
28.34 X 10
-1i
1.67
X 10
1
3.33 X
10-1
-1i
4.80 X 10 11.20
3.20
6.40
16.0
34.0
68.0
170
Table V-4Scan Rate Study of Lucigenin Reduction
-2
(1.07 X 10⁻² M Lucigenin in DMSO)
i p(pA) ip/l X 102 ip/A corr
-2 4.09 X 10⁻² 4.65 1.14 2.28 5.77 X 10- 2 6.46 1.12 2.20 9.15 X 10² 9.35 1.02 2.04 -1 1.29 X 10 12.4 0.97 1.94 1.83 X 10⁻¹ 16.7 0.91 1.83 2.89 X 10⁻¹ 24.3 0.84 1.68 -1 4.09 X 10 31.8 0.78 1.55 -1 5.78 X 10⁻¹ 41.6 0.72 1.44 6.94 X 10⁻¹ 47.2 0.68 1.36 1.10 66.0 0.60 1.20 1.79 106 0.59 1.18 2.53 122 0.48 0.96 4.00 164 0.41 0.81 5.84 210 0.36 0. 3 8.25 290 0.35 0.71 13.1 457 0.35 0.71 X 10 m
Table V-5
v(v/sec)
1.67 X 10- 33.33
X 10
- 38.34 X 10
- 3 1.67 X 10- 2 3.33 X 10- 28.34 X 10
- 2 1.67 X 10- 1-1
3.33 X 10-16.40 X 10-1
1.6 3.2 6.4 16.0 38.0 72.0 190Scan Rate Study of Lucigenin Reduction
-2
(2.14 X 10⁻² M Lucigenin in DMSO)
i
iplA)
ip/
X
102
ip/
corr X
104.09 X 10⁻² 9.3 2.28 2.28 -2 5.77 X 10² 12.6 2.22 2.22 9.15 X 10⁻² 19.0 2.08 2.08 1.29 X 10⁻¹ 25.5 1.97 1.97 -1 1.83 X 10 31.5 1.72 1.72 -1 2.89 X 10 48.0 1.67 1.67 -1 4.09 X 10⁻¹ 61.5 1.50 1.50 -1 5.78 X 10⁻¹ 78 1.35 1.35 8.00 X 10 105 1.30 1.30 1.27 149 1.18 1.18 1.79 200 1.12 1.12 2.53 233 0.92 0.92 4.0 335 0.84 0.84 6.16 460 0.75 0.75 8.48 575 0.68 0.68 13.8 830 0.60 0.60
-39'-Figure V-2
Current Function (ip/V / 2) (Corrected for concentration)
vs. Scan Rate for Lucigenin Reduction in DMSO
-3
o - o - o 2.44 X 10 M Lucigenin
A - A - A 1.07 X 10 M Lucigenin
z/
(
V/sec)
2.0
1.0
Nb01
10-3
10-2
10-I
10
100
1000
1
I~--r-- I.---
--
---- ----
~-
-. P -
_ __
-Table
V-61-Table V-6
V V/sec 1.67 X 10⁻¹ 8.33 X 10⁻² 3.33 X 10⁻² 1.43 X 10⁻² 6.67 X 10⁻³ 2.33 X 10⁻³ 2.33 X i0Scan Rate Study of DBA Oxidation in DMSO
A.- ia (pA) i ./V X 10- 1 Pa pa -i 3.28 X 10- 10.3 3.15 2.88 X 10- 8.8 3.05 1.83 X 10⁻¹ 5.6 3.06 1.19 X 10- 1 3.8 3.2
-2
8.16 X 10⁻² 2.5 3.07 4.84 X 10⁻² 1.5 3.1 4.84 X i0 1.5 3.1Figure V-3
Current function (ip /2) vs. scan rate for DBA Oxidation in DMSO
(aS/A
VZ
0 I
ZI0
o
-
O.iOit,
3~
ii_
I L ,_~~._1_~_. 111 111 1 I -s 1113 'R ~I.---~--- ---- I-no2_01
I0":Z
-44-Studies at fast scansin solutions of lucigenin more dilute than
-3
10 M were difficult to interpret due to the large capacitative cur-rents encountered in relation to the peak curcur-rents found. At about
the limit of usefulness of high scan -rates and lucigenin concentration -3
(50-100 V/sec with 10- 3 M lucigenin) an anodic peak was observed approx-imately 0.3 volts anodic from the lucigenin reduction peak. A typical cyclic voltammogram showing this anodic peak is shown in Figure V-4.
The cell resistance of DMSO with 0.1 M tetrabutyl amnonium perchlo-rate as supporting electrolyte was measured to be 1000 ohms.
D. ESR
A two electrode cell consisting of a mercury reference and platinum wire indicator in a thin glass tube was used in an ESR cavity to attempt
to detect the presence of radicals during the reduction of lucigenin in DMSO. A steady state potential of -0.40V was applied. A highly unresolved ESR signal was detected indicating low concentrations of some radical but the nature of this radical could not be determined because of the unresolved spectrum.
-45-Figure V-4
-3
Current Voltage Curve Obtained of 10-3 M Lucigenin in DMSO at a Scan Rate of 80 V/sec
Anodic
Current
++Cathodic
Current
O
0 0 iOC)
... -a --- -- % -14 --- -%. -1-- ~YPT~" "" r-- 1 -- ' -~--~----
-47-VI Discussion Electrochemistry
Several characteristics of the electrochemistry of lucigenin have been measured and appear in the results section above. These may be summarized as follows:
1. Lucigenin is reduced to DBA.
2. The overall value of n for the reduction is 2.
c
3. Neither the reduction of lucigenin nor the oxidation of DBA is pH dependent.
4. DBA is oxidized to lucigenin with an overall na of 2. 5. Radicals are observed during reduction of lucigenin.
6. There appear to be kinetic complications in the reduction of lucigenin indicative of a coupled chemical reaction. Nicholson and Shain (34) have presented a theoretical discussion of electrochemical behaviour at a stationary electrode, as applied to cyclic scan methods. Since the peak current varies with the square root of the scan rate (v) peak current can be normalized for scan rate
1/2
by dividing them by v . A plot of normalized peak current (current function) vs scan rate gives a horizontal straight line for either a reversible or irreversible charge transfer step, the reversible line being lower than that of the irreversible case (39). If however, there are any coupled chemical reactions which affect the electrochemistry a plot of normalized peak current vs scan rate will deviate from the hor-izontal straight lines. Referring to Figure V-2 one sees a decreasing current function for the reduction of lucigenin as the scan rate is increased. This indicates chemical reaction coupled with the electro-chemical reaction in this region of scan rates. Figure V-3 shows a
horizontal straight line dependence for the oxidation of DBA indicating no coupled chemical reactions.
Since no pH dependence was observed for the lucigenin reduction, a preceding or succeeding reaction of lucigenin or its reduction inter-mediates or products with either protons or hydroxyl ions is unlikely.
Lucigenin is stable in the solutions studied showing no detectable equilibrium forms. Thus the possibility of any chemical reaction pre-ceding the charge transfer step is highly unlikely. The possiblility of a chemical reaction after the charge transfer step to account for the observed behaviour is the only alternative.
As shown above, evidence of radicals was observed during the re-duction of lucigenin. Janzen et. al. (35) have reported a radical pro-duced during the reduction of lucigenin and identified it as being the mono-cation radical of lucigenin, L. This radical was observed when a constant potential was applied corresponding to the reduction
poten-tial of lucigenin. The radicals observed were on the very limit of detectability and it was estimated that their steady-state concentration
-6
was no greater than 10 M (36).
This evidence for L radicals being involved in the reduction, coupled with their instability as seen by the difficulty of detection provides a route for a post charge-transfer reaction. Two such reactions
seem possible. If lucigenin is designated L , the mono-cation radical L+ " and dimethyl biacridene as DBA these reactions are:
1. L + e- L (charge transfer)
L+ + S kf DBA + S
2. L+ + + ie $ L+ (charge transfer)
2L+ k.f L + DBA (Disproportionation)
__-3
Both reactions involve a one-electron charge transfer, followed by a chemical reaction of themono-cation radical yielding DBA as the product. Reaction 1. has an overall n of 1 while reaction 2. has an n value of 2. Since the measured value of n is 2 for the reduction reaction 2. is the favored possibility.
The nature of the effect of following chemical reaction on the observed electrochemical behaviour depends on the time scale of the electrochemical measurements and the value of the rate constant of the chemical reaction (34, 37). In the case of reaction 2. one may observe two extremes. First, at slow scan rates the time scale of the electro-chemical measurement is large compared with that of the electro-chemical reaction, i.e. the chemical reaction is complete. For reaction 2. then one should observe behaviour corresponding to a two-electron, irreversible reduc-tion. Second, at fast scan rates the time of the electrochemical measure-ment is small compared to that of the chemical reaction. In this case no chemical reaction occurs during the time of measurement. For reaction
2. in this instance one should observe behaviour corresponding to a one electron reduction with no kinetic complications. Nicholson and Shain
(34) show that the current function for a two-electron irreversible re-action is 2.2 times the current function for a one electron reversible reaction. Referring to the data of Table V-3 and Figure V-2 it may be seen that the current function in the irreversible part of the curve ,(low scan. rates) is 2.52 times the current function in the reversible
to convection in solution this value corresponds well with the theory of Nicholson and Shain.
Studies at scan rates between the first and second cases will be greatly influenced by the following chemical step. The value of the scan rate such that the following reaction is negligible is dependent on the value of the rate constant of the following reaction. The larger the rate constant the higher the scan rate must be to negate the effect of the chemical reaction.
The results of scan rate studies on the reduction of lucigenin are shown in Figure V-2. The decrease in normalized peak current with increasing scan rate is indicative of a following chemical
re-action. Several aspects of the curves in Figure V-2 are important. -3
The curve obtained with 2.14 X 10 M lucigenin shows indications of becoming horizontal at scan rates greater than 20 V/sec. As the
concen-tration of lucigenin was increased (1.07 X 10- 2 M and 2.14 X 10- 2 M) this leveling out of the curve becomes less apparent. It was also noted that at scan rates of greater than 20 V/sec in the 2.14 X 10- 3 M
lucigenin solution a new anodic wave appeared (see Figure V-4). It may also be seen from Figure V-2 that at low scan rates the normalized peak current is tending to level off.
The data shown in Table V-3-V-5 and in Figure V-2 may be interpreted only after some rather stri'ngentqualifications. The measured cell
re-sistance was 1000 ohms. Such a high cell resistance proves a source of large error in the values of the scan rates employed in the calculations. Assuming the lucigenin reduction to occur at an average potential of -0.4 V vs Ag/AgCl at moderate scan rates, a current of 100 pA will produce a 0.1 V
51-of this IR drop is a reduction 51-of the scan rate. Thus, the portions -3
of the curves greater than 50 V/sec for 2.14 X 10- 3 M lucigenin, 1 V/sec
-2 -2
for 1.07 X10 M lucigenin and 0.5 V/sec for 2.14 X 10 M lucigenin
are doubtless in error.
The effect of the net lowering of the scan rate due to IR drop may be seen in Figure V-2. At scan rates greater than 10 V/sec the normalized peak currents are lower as the lucigenin concentration is
1/2
increased. Thus the values of v employed in normalizing the peak currents are higher than those encountered in reality. The overall effect of the IR drop on the scan rate dependence is to broaden out the curve. Unfortunately, solutions of lucigenin more dilute than
-3
10 3 M had such a large capacity background at the current scales requiredthat measurements of peak currents on these solutions were
rendered impossible.
The leveling of the current function athigh scan rates, as explained above, is indicative of approaching the pure charge-transfer step of the reduction, with the following chemical reaction not affecting the measurement. The appearance of an anodic wave at the scan rates where this leveling occurs supports this premise. This anodic wave
corresponds to the oxidation of the intermediate which is involved in the chemical reaction.
The results obtained at very low scan rates are also suspect. At scan rates less than 10 mV/sec convection in the solution may
introduce serious error (37). Thus, the current functions at low scan rates may, in reality, be lower than those shown in Figure V-2.
the scan rate dependence result in the distorted curve shown in Figure V-2. In reality the falling portion of the curve should be steeper, level out at lower scan rates as the chemical reaction dominates and should also level out at higher scan rates in the reversible region.
The value of E p-Ep/2 is a measure of the peak shape of the re-duction process (34, 37). At low scan rates (see Table V-3) the value of E -E for the lucigenin reduction is 40 mV. At high scan rates
p p/2
this approaches a value of 65 mV. A completely reversible electrochem-ical reaction shows an E -Ep/2 of 57 mV (34, 37). At high scan rates, where one approaches the condition of a charge transfer step with no kinetic complications, the difference of 65 mV indicates that true
reversibility has not been reached. This is also borne out by the large (0.3V) separation of the lucigenin reduction peak potential and that of the anodic peak appearing at high scan rates. The separation of
40 mV seen at low scan rates fits only the rising portion of a catlytic reaction (34).
From the above interpretation of the scan rate studies, coupled with the measured value of n and chemically feasible reactions, con-clusions may be drawn concerning the electrochemical reduction of lu-cigenin. It is evident that there is a chemical reaction following charge
transfer. The most probable reaction is that shown in reaction (2) above, an initial one electron reduction to the mono-cation radical (L +' )
disproportionation of L+'to lucigenin (L+ + ) and DBA. The current function plots indicate a one electron charge transfer followed by a chemical reaction producing a net two-electron, irreversible reduction
5
-which is in agreement with the measured value of 2 for n. At moderate scan rates the rising portion of the wave fits only the case of a cata-lytic process and an analogy can be drawn between the disproportionation of L regenerating L+ + and a catalytic reaction. The cathodic shift of peak potential with increasing scan rate is also indicative of a following reaction.
The appearance of an anodic peak at fast scan rates, where the following chemical step has a negligible effect, corresponds to the oxidation of L+'. The exact region of scan rates at which the charge transfer step only is observed is questionable due to the effect of IR drop across the cell on the scan rate.
Nicholson and Shain (34) have treated only first order or pseudo-first order following chemical reactions. Booman (38) has treated disproportionation reactions but only applied to potential step
methods. However, an analogy may be drawn between an irreversible fol-lowing chemical step (Nicholson and Shain, case VI) and the proposed disproportionation. Nicholson and Shain (34) give a value of kf/a of 0.1 for the onset of seeing the anodic peak, corresponding to the oxi-dation of the electrochemical intermediate, where kf is the rate constant of the following reaction and a = nFv/RT, where n is the number of electrons involved in the charge transfer step and v is the scan rate in volts/sec. If one assumes, from the data of Table V-3 and Figure V-2, for the most
-3
dilute lucigenin solution (2.14'x 10- 3 M), that the onset of the anodic wave occurs at an actual scan rate-of 10 V/sec, a is then calculated
to be 1.7 X 10². Assuming kf/a to be 0.1 at this scan rate, then
1 -1
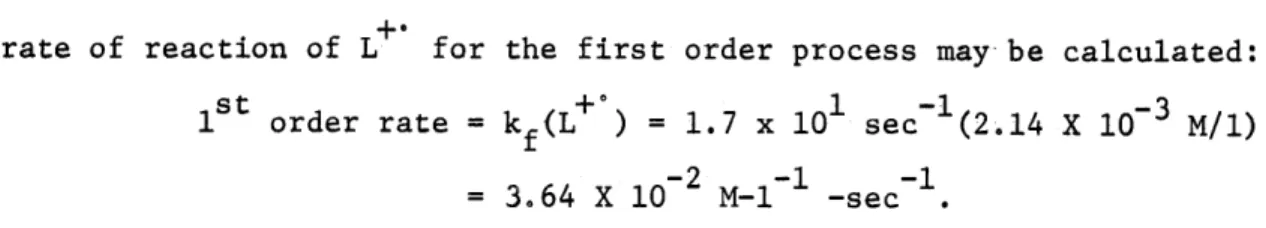
kf = 1.7 X 10 sec . However, the following reaction is second order rather than first order. If one assumes a concentration of L+ at the
surface of the electrode-equal to the bulk concentration of lucigenin the rate of reaction of L for the first order process may be calculated:
s t
0 1 -l -3
1st order rate = kf(L+ ) = 1.7 x 10 sec (2.14 X 10- M/1)
-2 -1 -1
=3.64 X 10 M-1 -sec
If the actual following chemical step is second order this rate must equal that of the first order reaction. Calling the second-order rate constant k' one calculates:
f kf(L ) = k' (L+ ) 2 or 3.64 x 10⁻² M-1 -sec-1 = k (2.14 X 10 3 M/)2 3 and k' = 8 X 10 1/M-sec. f
This calculated value of k' is only an approximation but is likely to be a good order of magnitude estimate of the second-order rate constant for the disproportionation.
The scan rate data of Table V-6 for DBA oxidation and plot of current function (i /V1/2) vs scan rate of Figure V-3 shows no depen-dence of normalized peak current on scan rate. This is indicative of an electrochemical oxidation uncomplicated by chemical reactions. The experimental value of n a being 2 indicates a net two-electron oxidation. Figure V-1 and V-4 show no reversible cathodic wave in conjunction with the anodic DBA wave, showing the two electron oxidation of DBA to be a net irreversible process.
Since true two-electron oxidations in organic systems are unlikely it is more probable that the oxidation passes through a one-electron oxidation intermediate. The one-electron oxidation product of DBA is L+ ' . By reference to Figure V-4 it may be seen that L+ itself will be oxidized to lucigenin at the anodic potential necessary to oxidize
DBA to L . Thus, the oxidation of DBA appears to fit the scheme: DBA - le- + -le- L
or two, consecutive one-electron oxidations occurring at the same potential.
In summary, the electrochemical behaviour of lucigenin appears
to best fit the following scheme:
++ - +
L + le L+ L
for the reduction of lucigenin
2L k L + DBA
DBA-le- - L+ "
-le-
L
for the oxidation of DBAThe value of kf has been estimated as 8 X 10³ 1/M-sec. Further work is necessary to evaluate conclusively the electrochemistry of this system. Perhaps potential step methods may prove fruitful as these have been treated by Booman (38) for following disproportionation reactions.
-56-VII. Results ECL
A. Production of Lucigenin ECL
All attempts to generate ECL under the conditions described by Tammanmushi and Akiyama (19) failed. However, when a mercury pool was substituted for the platimum cathode and the solution was unbuf-fered at pH 7, light could be observed. Oxygen was found necessary for the production of light. Furthermore, no light was observed until the potential was sufficiently negative (-0.15 V vs. Ag/AgCL in 0.1 M KC1) to reduce the oxygen. The oxygen wave is anodic rela-tive to lucigenin in this system as can be seen in Figure V-l, curve B. When a steady potential of -0.15 V was applied, the electrochemical
reduction of lucigenin was not a significant process.
It was possible to produce lucigenin ECL in four non-aqueous solvents: EtOH, DMF,DMSO and AN. One is limited to polar solvents due to the insolubility of both lucigenin and the supporting electrolyte (t-butyl ammonium perchlorate) in non-polar media. Once again it was necessary to reduce oxygen, in this case to superoxide (0-) (39, 40) before light was observed. In the case of non-aqueous solvents the potential necessary for oxygen reduction is more cathodic than for
the lucigenin reduction as shown in Figure V-1, curve A. Therefore,
e
two processes are ocurring at the electrode: lucigenin + DBA and
02 2
To ascertain which species were reacting, three experiments were run. First, a solution containing lucigenin in DMSO was bubbled with N2 to exclude oxygen and the lucigenin was totally reduced to DBA. Then oxygen was bubbled through the solution, No light was observed. Second, a solution was used containing only DBA and oxygen.
-57-The oxygen was reduced to superoxide while the DBA was unaffected at this potential. Once again no light was observed. Third, a
solution containing only oxygen was used. The oxygen was electrolyzed to superoxide and a solution of lucigenin (oxygen free) was admitted only after the electrolysis had been stopped. In this case light was observed. These observations support the thesis that superoxide
formed by the reduction of oxygen reacts only with lucigenin to cause light emission.
B. Spectral Study ofLugcigenin ECL.
The ECL spectra were obtained using the cell shown in Figure IV-1. It should be noted that due to size limitations in the cell holder a platinum reference electrode was used in this cell and thus the potentials employed during the spectral studies do not necessarily
correspond to those used when an Ag/AgCl reference was used. At first these spectra were obtained on the Aminco-Bowman spectrofluorometer, but better results were found when the Image Intensifier Spectrograph
(IIS) was used.
1. Non-aqueous ECL Spectra.
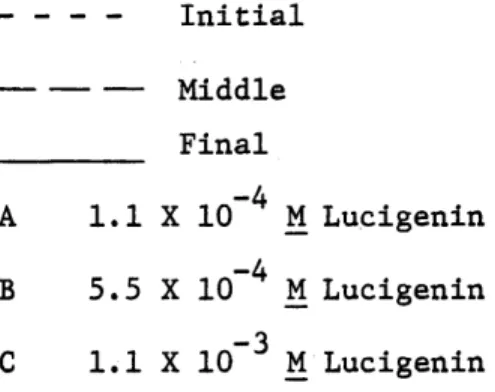
Figure VII-1 shows the spectra obtained on the IIS for the ECL of lucigenin in DMSO at various concentrations and extents of reaction. Figure VII-2 presents similar spectra obtained for the ECL of lucigenin in DMF. Figure VII-3 shows the relationship between the ECL spectra of Figure VII-2 and the fluorescence spectra of lucigenin, DBA and
NMA in DMF (all spectra were obtained using the IIS and are uncorrected). It can be seen that the short wavelength component of the ECL corre-sponds to NMA emission whereas the long wavelength component correa
-58-A B - - - -C - - -D -- - - --E - - - F -Figure VII-1 ECL SPECTRA IN DMSO
-4 1 X 10 4 Lucigenin, -4 5 X 10 M Lucigenin, -4 5 X 10 M Lucigenin, -4 5 X 10 M Lucigenin, -3 1 X 10 M Lucigenin, -3 1 X 10 M Lucigenin, initial final initial final initial final
500'
550
600
450
500
Wavelength
(n m)
U, C)5,
.4
i,n-350
400
550
600
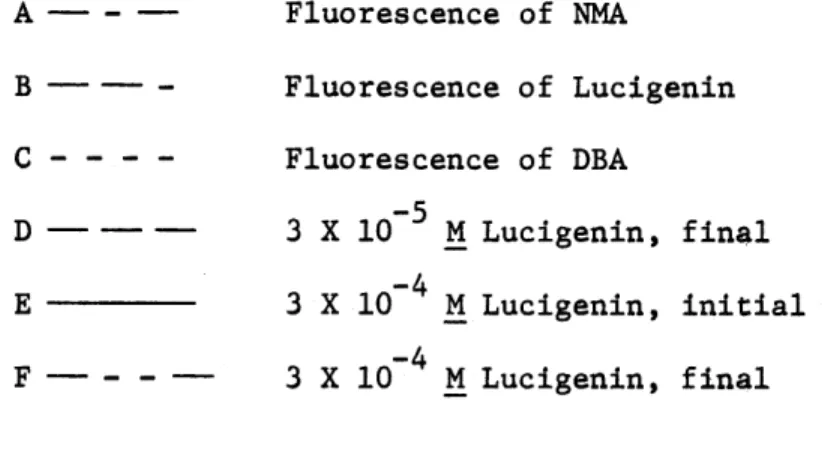
Figure VII-3
ECL and Fluorescence Spectra in DMF
A - - - - Fluorescence of NMA B - - - - Fluorescence of Lucigenin C - - - - Fluorescence of DBA -4 D initial 1 X 10 M Lucigenin -3 E - -- Initial 1 X 10⁻³ M Lucigenin -3 F---Final 1 X 10 M Lucigenin