READ THESE TERMS AND CONDITIONS CAREFULLY BEFORE USING THIS WEBSITE. https://nrc-publications.canada.ca/eng/copyright
Vous avez des questions? Nous pouvons vous aider. Pour communiquer directement avec un auteur, consultez la première page de la revue dans laquelle son article a été publié afin de trouver ses coordonnées. Si vous n’arrivez pas à les repérer, communiquez avec nous à [email protected].
Questions? Contact the NRC Publications Archive team at
[email protected]. If you wish to email the authors directly, please see the first page of the publication for their contact information.
This publication could be one of several versions: author’s original, accepted manuscript or the publisher’s version. / La version de cette publication peut être l’une des suivantes : la version prépublication de l’auteur, la version acceptée du manuscrit ou la version de l’éditeur.
Access and use of this website and the material on it are subject to the Terms and Conditions set forth at
Asset management A to Z Vanier, D. J.
https://publications-cnrc.canada.ca/fra/droits
L’accès à ce site Web et l’utilisation de son contenu sont assujettis aux conditions présentées dans le site LISEZ CES CONDITIONS ATTENTIVEMENT AVANT D’UTILISER CE SITE WEB.
NRC Publications Record / Notice d'Archives des publications de CNRC:
https://nrc-publications.canada.ca/eng/view/object/?id=5ce72886-6f87-49b0-a32f-ded85a07f3df https://publications-cnrc.canada.ca/fra/voir/objet/?id=5ce72886-6f87-49b0-a32f-ded85a07f3df
Vanier, D.J.
A version of this paper is published in / Une version de ce document se trouve dans:
NRCC/CPWA/IPWEA Seminar Series "Innovations in Urban Infrastructure", Philadelphia, PA., Sept. 9-12, 2001, pp. 1-16
www.nrc.ca/irc/ircpubs
ASSET MANAGEMENT: "A" TO "Z" by
D.J. VANIER1
Institute for Research in Construction, National Research Council Canada 1200 Montreal Road, Ottawa, CANADA K1A 0R6
Abstract
Today, there exists an estimated $33 trillion worth of constructed assets in North America, with 20 percent of that asset base invested in municipal infrastructure. In North America and Australia, there are hundreds of billions of dollars in backlogged maintenance, and a large portion of the asset base must be considered for capital renewal in the near future. This paper and the remainder of the papers in this Asset Management session take an in-depth look, on a discipline-by-discipline basis, at how to reach strategic solutions to managing, maintaining and renewing this vital infrastructure. In the associated six papers, the domain experts will concentrate on the overall goals of strategic asset management and its application to water and waste water systems, bridge projects and networks, building maintenance, and roadway infrastructure. This panel of international speakers address the six essential areas of asset management in their domain of interest: 1) asset inventory techniques, 2) asset valuation methods, 3) deferred maintenance classification, 4) condition assessment surveys, 5) service life prediction models, and 6) maintenance planning strategies.
The goal of my paper is to introduce the reader to the topic of strategic asset management, to provide a vocabulary of terms used in the domain, to provide a background for the need for asset management, to describe a sequential process for the proper implementation of an asset management system, and to describe an innovative project related to municipal infrastructure investment planning.
Keywords: Asset management, municipal infrastructure, investment planning, maintenance planning
This paper and others are from the Asset Management Super-sized Session held at the APWA Annual Congress and Exposition in Philadelphia, September 2001. Electronic copies are located
at www.nrc.ca/irc/uir/apwa
1
Dr. Dana Vanier is a Senior Research Officer at the National Research Council Canada. He is currently investigating the use of Information Technologies in the field of service life asset management. He is an editor of ITCON, the Electronic Journal of Information Technology in Construction (www.itcon.org) and a member of the CIB W78 working commission on IT in
1. Introduction
Managers of mixed urban infrastructure assets such as federal departments, state or provincial governments, municipalities, universities and school boards have to manage a diversified set of built assets, ranging from complex underground networks (e.g. water distribution, sewers) to buildings. This also includes the roadway systems, parks and any other equipment necessary to maintain all these infrastructures. These built assets, however, are not protected from deterioration due to ageing, climate, geological conditions, and changes in use. Furthermore, and in particular, because of a lack of adequate funding and appropriate support technologies, certain components of the urban infrastructure have been neglected and receive only remedial treatments (Edmonton 1998; Winnipeg 1998; Burns et al 1999). Consequently, these built assets will not last their originally predicted service life (HAPM 1995): unless of course there are major “premature” maintenance and rehabilitation investments.
1.1 Definitions
Many different terms are used in the industry to explain the same concept, and some terms are used interchangeably. To eliminate any confusion or misinterpretation of "jargon", the following terms are used in this paper to describe concepts related to strategic asset management. A full definition of asset management is provided in Section 3.
Asset managers and property managers are those responsible for managing the maintenance, repair and renewal work. It is their collective responsibility to maximize the effect of expenditures as well as to maximize the value of their assets over the asset’s service life. The asset manager, by definition in this paper, is responsible for major maintenance, repair and renewal decisions, as well as the long-term strategic plans for a corporate asset portfolio. The property manager or facility manager primarily deal with day-to-day accommodation issues and the implementation of the strategic plan. Typically, the property or facility manager's activities occur in the operational (under two years) or tactical planning horizons (two to five years); whereas the asset manager's responsibilities are in the strategic planning horizon (beyond five years). All these managers work co-operatively to ensure that any asset, or component thereof, can attain its predetermined service life.
Service life is defined as “the actual period of time during which [the asset] or any of its components performs without unforeseen costs of disruption for maintenance and repair” (CSA 1995). The term “unforeseen” is a key word in the definition: all components and materials require planned maintenance and they must be maintained to ensure that the service life is reached. Not all systems or components are replaced at the end of their technical service life (i.e., when they fail to meet their functional requirements), sometimes they are replaced when they reach their economic service life (that is, when it is less expensive to replace than to maintain the asset). Durability has ambiguous meaning in technical circles; its use is discouraged as durability has so many different meanings to so many different people.
The term maintenance is normally used to cover a broad range of planned or unplanned activities for preserving an asset in its original condition. Maintenance generally consists of: (1) inspections are carried out periodically to monitor and record how systems are performing; (2) preventive maintenance ensures that systems or components continue to perform their intended functions throughout their service life (e.g. obstructions are removed and depleted protection fluids are replenished); (3) repairs are required when defects occur and unplanned intervention is required, and
(4) rehabilitation replaces one major component of a system when the system is reaching the end of its service life of the system. Capital renewal is considered outside of the maintenance definition as a renewal replaces a system at the end of service life or because of technical, economic, obsolescence, modernization or compatibility issues.
Condition assessment surveys (CAS) are inspections used to assess the performance of a system, subsystem or components; this term can be used synonymously with technical audit. In many systems, the CAS provides a facility condition index related to the cost of required repairs (NACUBO, 1990) or a technical condition index related to the technical performance of the asset (Bailey et al, 1989). Deferred maintenance constitutes work that has been postponed or phased for future action. It represents the cost of maintenance (and not capital renewal) to bring the asset to its original potential. This term is synonymous with maintenance backlog.
Six terms are used currently in asset management to describe the value of an asset. The historical value is the original “book value” of the asset. The appreciated historical value of an asset is the historical value calculated in current dollars, taking into account annual inflation or deflation. The capital replacement value is the cost of replacing an asset in current dollars. The performance-in-use value is the prescribed value of the actual asset for the user (Lemer, 1998). The deprival cost is the “cost that would be incurred by an entity if it were deprived of an asset and was required to continue delivering programs/services using the asset. The value is measured by the replacement cost of the benefits currently embodied in the asset. Deprival value may also represent an opportunity value i.e. the cost avoided as a result of having control of an asset” (ANAO, 1996, p. 68). This term is used predominantly in Australia. The market value is the value of the property if it were sold on the open market. In many instances, the market value cannot be used for municipal infrastructure; however, it is applicable to many types of assets such as buildings or unoccupied land.
2. Background
Asset and property managers are faced with many difficult decisions regarding when and how to inspect, maintain, repair or renew their existing facilities in a cost-effective manner. In addition, managers have few tools, either literature or intelligent computer software, to assist them in the decision-making process. Many of the major property owners in North America recognize these service life and asset management problems. Most have corrective measures for isolated problems, but none has an integrated, comprehensive solution to address the needs for maintaining their assets efficiently and effectively over their service life (Vanier 2000; Vanier 2001). In addition, there are Information Technology (IT) solutions claiming to address the full needs of municipalities; however, these are proving to be only isolated solutions to specific market niches.
2.1 Annual Asset Growth in Canada and USA
Figure 1 shows the annual growth of newly constructed assets in North America since 1960; many North American organizations have seen their asset base grow in a similar fashion.
$0
$100
$200
$300
$400
$500
$600
$700
$800
1960 1965 1970 1975 1980 1985 1990 1995 2000$
billion
(c) Canada US$ (a) USA US$(b) Canada CDN$
Figure 1: Annual Construction Growth (Canadian and USA) in Constant Dollars. 2.2 Total Assets in Canada and USA
The total infrastructure asset for Canada and the USA are presented and can be compared in Constant US$ in Figure 2. The numbers for total assets in the USA are to the order of US$30 trillion whereas the Canadian numbers are closer US$5 trillion. Figures 1 and 2 also illustrate that Canada experienced considerable growth in the 70’s to 90’s and that growth is now tapering off; whereas growth is continuing in the USA.
$0 $10 $20 $30 $40 $50 $60 1960 1965 1970 1975 1980 1985 1990 1995 2000 $trillion $0 $1 $2 $3 $4 $5 $6 1960 1965 1970 1975 1980 1985 1990 1995 2000 (a) (b)
Figure 2: Total accumulated built assets in (a) United States of America and (b) Canada
In fact, if 2% of the capital replacement value of current assets in Canada were expended in maintenance as suggested by leading authorities in this domain (CERF, 1996; NRC, 1996), and if all assets in Canada were renewed at the end of their service life, then approximately $196.5 billion would be required each year to maintain and replace Canada’s estimated $5.5 trillion current built assets (Vanier, 2001). Similar numbers can be developed for the current assets in the USA. Indeed, these numbers are an order of magnitude more than is currently expended in Canada and the USA.
3. What is Asset Management?
A number of organizations provide definitions for asset management. A good definition for asset management is (FHWA, 1999):
Asset management is a business process and a decision-making framework that covers an extended time horizon, draws from economics as well as engineering, and considers a broad range of assets. The asset management approach incorporates the economic assessment of trade-offs among alternative investment options and uses this information to help make cost-effective investment decisions.
In an attempt to classify and to describe examples of decision-support tools for asset management, the author presents his six “Whats” of asset management. Asset management can therefore be described as the successful implementation of data collection related to the following six questions:
• What do you own?
• What is it worth?
• What is the deferred maintenance?
• What is its condition?
• What is the remaining service life?
• What do you fix first?
Anecdotal information from typical organizations maintaining municipal infrastructure indicate that they fare well with the first two questions, but have not implemented the remaining four. Discussions with asset management professionals indicate that there is also a scattering of responses depending on the discipline (i.e. roadways, bridges, parks, buried utilities, buildings).
In the following subsections, the author describes the six levels for asset management implementation. The author also suggests that practitioners can use this six-level classification as a sequential roadmap for implementing an asset management plan. As the reader will see in Section 3.7, it is important to realize that some domains or regions in a portfolio will have considerably more data, and more accurate data, than other domains or regions.
3.1 What do you own?
The first question to be answered relates to the physical area of responsibility of an organization. Administrative change such as restructuring, amalgamation or downsizing makes it difficult to document the full extent of an organization's portfolio. For example, when 14 municipalities are amalgamated to form a super city, how does the new super city accumulate, merge and cross-reference all the "amalgamated" data (paper-based, differing databases, spreadsheets) into one comprehensive system. And how long will that take to harmonize? An example of downsizing is where a higher level government assigns both authority and responsibility of an asset to a lower level government, but does not provide sufficient funding for that asset, or does not it supply adequate historical data about maintenance, repair and renewal.
Tools Available: Geographical information systems (GIS), CAD systems and relational database management systems provide accurate pictures of the extent of an asset management portfolio. One such tool that is typically used to record what assets are owned is a computerized maintenance management system (CMMS). There is a large selection of “fully commercialized” CMMSs available; many of these are relational database applications that can be adapted to meet the data handling needs of asset managers. A quick search on the Internet (e.g. http://www.altavista.digital.com, http://www.excite.com) using “computerized maintenance management system” or “cmms” produces thousands of sites dedicated to this topic. Detailed information on over 300 CMMS packages can be obtained from the Plant Maintenance Resource Center (PM 2000). It is obvious from this information that the CMMS domain, at this time, is mature, and that many stable, comprehensive, useful tools exist. For example, any number of CMMS applications can manage work orders, trouble calls, equipment cribs, stores inventories and preventive maintenance schedules, and many programs include features such as time recording, inventory control and invoicing. The CMMS’s capability to store inventory data is formidable; however, their capacity with respect to life cycle economics, service life prediction and risk analysis is considerably less sophisticated.
3.2 What is it worth?
Once an organization identifies the extent of its portfolio, the next question to be answered is "what is the asset value?”. Unfortunately, it is not a simple matter of providing numbers for each asset, as assets may consist of many components with their own individual values, they may have historical values on record, or they may be approximations based on unit areas or volumes.
In fact, six different terms to describe the “value” of an asset were described in Section 1.1.: historical value, appreciated historical value, current replacement value (CRV), “performance in use” value, deprival cost, and market value. One can take the simple view of the value of an asset as one data field on the asset record; however, the calculation and the recording of the value are neither simple nor straightforward. In addition, these numbers may be difficult to find in the proliferation of electronic records and the variety of manual systems found in most offices. Typically, large organizations store only the historical values of assets, and bring this value forward to current dollars using well-known building economic principles (ASTM E917 1994), or calculate the replacement cost based on the area, volume or length of a system or component (www.rsmeans.com).
However, many do not store the “value” of that asset, but only the cost of installation or replacement. Asset managers require both value and cost to make educated decisions about maintenance and renewal. For example, in the case of a simple re-paving project the asset manager may wish to know the original cost, the past maintenance costs, as well as the life cycle costs of a specific type of system. The last value could be used to compare this option against a proposed configuration that is more expensive but could have a longer service life, lower maintenance costs and higher reliability.
Tools Available: Life cycle costing (LCC) is based on well-known standards in the domain (ASTM E917, 1994). A number of “off-the-shelf” commercial tools such as Building Life-Cycle Cost program (BLCC 1995) have been developed to implement these ASTM standards.
3.3 What is the deferred maintenance?
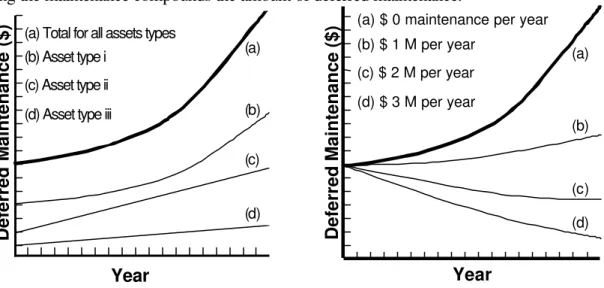
The deferred maintenance cannot be treated simply a sum of past annual maintenance deficits; it must include the compounding effect of deferring maintenance from one year to the next. This compounding effect is similar to the interest on a debt: if the maintenance is not completed in year one, then the costs of maintenance, repair or replacement are significantly higher in subsequent years, as shown in Figure 3. De Sitter’s “Law of Fives” (De Sitter 1984) approximates this effect: if maintenance is not performed, then repairs equaling five times the maintenance costs are required. In turn, if the repairs are not effected, then renewal expenses can reach five times the repair costs. Therefore, postponing the maintenance compounds the amount of deferred maintenance.
Deferred Maintenance ($)
(a) Total for all assets types (b) Asset type i
(c) Asset type ii (d) Asset type iii
(a)
(b)
(c)
(d)
Year
(a) $ 0 maintenance per year (b) $ 1 M per year (c) $ 2 M per year (d) $ 3 M per year (a) (b) (c) (d) Year Deferred Maintenance ($)
Figure 3: Growing deferred maintenance Figure 4: Deferred maintenance reduction Spending on maintenance and repair as shown in Figure. 4 can reduce this deferred maintenance. Figure 4 schematically illustrates the reduction of the deferred maintenance with various levels of maintenance funding. The asset manager should keep in mind that maintenance and repair funding should be applied first to those assets of the type in curve (b) of Figure 3, i.e. those with the highest compounding curves.
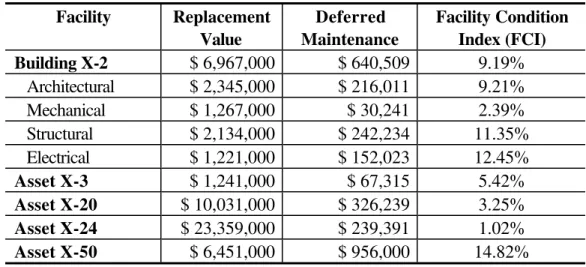
NACUBO uses the term “facility condition index” or FCI to provide comparisons for the amount of deferred maintenance between different facilities or systems. The FCI is the amount of deferred maintenance divided by the current replacement value (CRV). NACUBO studies (1990) indicate those facilities with FCI’s higher than 0.15 are problematic.
The NACUBO Model can be easily implemented in a spreadsheet or database. The FCI provides a general impression of the overall state of the individual facilities (NACUBO 1990), as shown in and example in Table 1. A higher FCI indicates a worsening relative state of the facility. More granular data on specific disciplines can also be displayed if available, as in the example for Building X-2 in Table 1. This example illustrates some of the challenges at this level for asset management: (1) a number of engineering and financial applications are required to produce the data required to prioritize work, and (2) valid data is required to respond to the first two asset management questions. The corollary is that data are required across all domains and for all regions of the portfolio, a difficult task. This issue is discussed in Section 3.7 of the paper.
Tools Available: Typically, the data required to calculate the FCI are stored in the CMMS system. However, they may also exist in a number of different CMMS systems in the same organization.
Another technique gaining in popularity for this type of work is "data warehousing". Traditionally, a relational database such as a CMMS only maintains the most current information in its records; however, very often in asset management there is a need to save intermittent snapshots of the state of the assets. These snapshots could be in the form of data dumps from the CMMS database; for example, saving data about the repair dates, repair scope, labour costs, contract specifications and drawings. These data could be warehoused and mined in future years to extract trends of past years on issues such as deferred maintenance and recurring maintenance.
Table 1: Deferred Maintenance Facility Replacement Value Deferred Maintenance Facility Condition Index (FCI) Building X-2 $ 6,967,000 $ 640,509 9.19% Architectural $ 2,345,000 $ 216,011 9.21% Mechanical $ 1,267,000 $ 30,241 2.39% Structural $ 2,134,000 $ 242,234 11.35% Electrical $ 1,221,000 $ 152,023 12.45% Asset X-3 $ 1,241,000 $ 67,315 5.42% Asset X-20 $ 10,031,000 $ 326,239 3.25% Asset X-24 $ 23,359,000 $ 239,391 1.02% Asset X-50 $ 6,451,000 $ 956,000 14.82%
3.4 What is its condition?
Once the extent and the value of an asset has been determined and a ballpark financial condition has been obtained using the FCI, then decision-making can take place on an objective, rather than subjective, level. However with the FCI, the decision-maker is prioritizing maintenance based on "worst" overall condition. That is, a small repair ($150) on an inexpensive asset ($1000) will yield a high FCI (15%) and a high priority for funding. Whereas, a large repair ($15K) on an expensive asset ($1M) will have a considerably lower FCI (1.5%) and virtually no chance of funding. But in the absence of any other objective system it is far superior to "fixing the squeaky wheel". The next step to a comprehensive, and objective, asset management system developing and implementing a technical condition assessment system (CAS).
Tools Available: Engineered Management Systems (EMS), as implemented by the US Army Corps of Engineers, can be used to document the physical condition of many types of asset (Bailey et al 1989; Shahin 1992). The US Army Construction Engineering Research Laboratory (CERL) has pioneered the use of engineered management systems in many construction sectors, such as paving, roofing and rail maintenance (http://www.cecer.army.mil/facts/sheets/fl08.html). Engineered management systems (EMS) assign a condition index (CI) to an asset based on a number of factors including the number of defects, physical condition and quality of materials or workmanship. The EMS software embodies the results of research studies that estimate the potential degradation of the CI with respect to the loads on
the system or external agents acting on materials. With all of these data at hand, it is possible to estimate the future CI, given the current state and a likely degradation curve. A number of systems exist for municipal infrastructure including PAVER (Shahin 1992), ROOFER (Bailey et al 1989), and BUILDER (Uzarski and Burley, 1996).
A condition assessment survey (CAS) takes many forms and is another decision-support tool used to establish an asset's condition. A CAS produces a benchmark for comparison, not only between different assets, but also for the same asset at different times. “Using CAS, a maintenance manager can formalize the assembly of basic planning elements such as deficiency-based repair, replacement costs, projected remaining life and planned future use” (Coullahan and Siegfried 1996). A CAS records the deficiencies of a system or component, the extent of the defect, as well as the urgency of the repair work. In some cases, the estimated cost of repair is also provided. Management, as a result of the data generated by CAS, is better able to develop optimal plans for maintenance and repair of their buildings (Coullahan and Siegfried 1996). Many CMMS's claim to have condition assessment capability, but typically this means a field to record the condition state (i.e. failed, fair, good, excellent or a number from 1 to 10). The shortcomings inherent in this rating system include the biases introduced by different inspectors and the lack of cross-relationships between discipline domains. However, in the absence of a methodical, repeatable and objective system, this recording tool is a step in the right direction.
3.5 What is the remaining service life?
After the extent of an portfolio is established, along with its value and technical condition determined, the asset manager must be able to establish the remaining service life of the assets in order to calculate the life cycle costs for alternative maintenance, repair and renewal strategies. Two types of service life can be calculated: technical service life and economic service life.
Tools Available: The remaining technical service life can be calculated employing techniques such as Markov chain modeling (Lounis et al 1998), the factorial method, case-based reasoning or CBR, or from life expectancy tables (HAPM 1995). These techniques predict remaining service life based on studies of similar construction forms under test and/or field conditions. Unfortunately these techniques require the collection of considerable amounts of data; so only a few domains such as bridge (Frangopol et al 1997), pavement (Shahin 1992) and roofing (Bailey et al 1989; Lounis et al 1998) management have reliable service life prediction techniques. Currently, there are few information technology tools that implement these types of service life prediction.
Calculating the economic life is different from the technical life and requires a different set of formulae. Databases such as those from R.S. Means (www.rsmeans.com) or Whitestone Research
(www.whitestoneresearch.com) are used to calculate the immediate costs of repairs and to compare
these numbers to the costs of renewal. The life cycle costs (LCC) of these expenditures can be calculated using standard formulae for building economics (ASTM E917 1994) as shown in Equations (1) and (2). Ct (1+i)t N t=0 PVLCC= ∑ Equation (1)
Where PVLCC = present value (PV) of life cycle costs Ct = sum of all relevant costs, occurring in year t
N = length of study i = the discount rate
Ct =IC+PVM+PVR+PVF-PVS Equation (2)
IC = initial cost
PVM = PV of maintenance and repair cost PVR = PV of replacement cost
PVO = PV of operations cost PVS = PV of resale value
Obtaining the correct data for Equations (1) and (2) is not an easy task; not only is it difficult to obtain all of the costs for future years on projected operations, maintenance, repair and resale, but it is very difficult to obtain projections on the discount rate to be used. In addition, the user must have first obtained an approximation of the technical service life, as described earlier. However, if all these data are obtained, the optimum economic service life can be easily visualized (Kleiner, 2001).
3.6 What do you fix first?
Finding the answers to the first five "what's" of asset management clearly illustrates the problem with answering the last question: "What do you fix first?" Even if a portfolio manager has embraced asset management and its philosophy, it may be decades before the asset management plan is fully implemented and "ticking away smoothly". In the meanwhile, the portfolio manager will have to make decisions today as to what to fix tomorrow. For example, if the manager has finally inventoried all the assets in the portfolio (Q1 --"What do you own?"), then decisions will be based on these objective data and any number of subjective data including: "it's in bad condition", "it's a priority", "it's a hazard", and "it's slated for renewal". However, if Q2 ("What is it worth?") has been addressed portfolio-wide then attention can be focused on the relative value of the assets under consideration for maintenance or renewal. Following this train of thought, if Q3 ("What is the deferred maintenance?") is addressed then the decisions for maintenance and renewal can be based on objective data about the amount of outstanding work. By the time the portfolio manager is reaching the "lofty heights" of Q4 ("What is the condition?"), then decisions can be made on objective data related to the actual need for maintenance and repair, i.e. condition based maintenance. Q5 ("What is the remaining service life?") finesses the previous four questions by quantifying the remaining technical service life and allowing the economic service life of particular assets to be calculated. In addition, there are a number of socio-technical challenges.
Financial Versus Technical Challenges: Asset managers have a constant technical challenge to weigh the costs of maintenance, repair or renewal versus the technical and functional benefits of implementing a solution. This is exacerbated when there are more projects than funds, or when budgets are continuously shrinking (FCM 1995). In many cases, managers must allocate funds among competing yet deserving needs; often having to make decisions based on incomplete data (CERF 1996). In addition, the asset managers’ resources are being challenged from all sides: managers are also being asked to privatize operations, outsource responsibilities or reduce overhead. All of these factors make it extremely difficult for long-term decision-making in municipal infrastructure management.
Planning Horizons Challenges: Gordon and Shore (1998) have suggested three planning horizons to illustrate the conflicting nature of long-term decision-making for asset managers: operational,
tactical, and strategic. The operational planning horizon is identified as that within the two-year time frame; the tactical planning is the two to five year time horizon, whereas the strategic planning is planning beyond the five-year term. Any proponent of life cycle analysis understands this deterrent to long-term planning: - remedies in the short term may not be the most economical in the long term. Combined with conflicting political and administrative agendas, as well as rapidly changing targets and plans for each organization, the planning for the strategic horizon is a difficult task.
Network Versus Project Challenges: Typically, the asset management tools in current use today deal with individual domain or type of facilities; for example, an engineered management system (EMS) deals only with paving condition assessment surveys (CAS) and CMMS may deal only with work orders and/or task scheduling. As any good asset manager realizes, municipal infrastructure is an integrated system and the individual components must function both independently as well as in unison with other systems. For example, many municipal infrastructure systems are networks that depend on the weakest link (e.g. bridge and road networks). Or the infrastructure systems are interdependent, where one network should be replaced at the same time as a neighbouring one (e.g. water distribution and sewer).
Another “network” factor is the level at which asset optimization should take place: discipline, facility or organization. Should one specific discipline (e.g. buildings or fleet) in a municipal portfolio receive a disproportionate amount of funding, should one region attract more funding attention than others, or should one department control the lion’s share of resources?
Tools Available: NACUBO (1990) provides a practical method to plan the appropriate rehabilitation, replacement or renewal. The methodology is related to the Facility Condition Index (FCI) discussed earlier and is called capital renewal (CR) analysis. The CR analysis calculates the renewal costs and spreads these future expenditures equally around the planned renewal date in a five-year time span, as shown in Figure 6 (b). In this example, three renewal projects are planned and the costs for implementing Project (i) are amortized from year two through year seven. Using CR analysis, costs for the CR for each and every system or facility can be calculated well into the future (knowing the service life), and can be discounted as a present value or calculated as an annuity expense, as shown in curve (c) in Figure 7. These calculations can also be used to establish “sinking funds” or “reserve funds” for the facility. Spreadsheets can be used to implement the NACUBO model.
Accumulated Maintenance ($)
Project ii (a) Accumulated Maintenance (b) Projected Capital Renewal (Projects i, ii, and iii
spread over 5 years)
(a)
(b) Project i Project iii
Year
(a) (b) (c) (a) Maintenance / Renewal Requirements (b) Accumulated Maintenance
(c) Projected Capital Renewal ($3 M maintenance per year)
(Capital Renewal amortized over 10 years)
Year
Maintenance / Renewal ($)
Figure 6: Capital Renewal Figure 7: Maintenance and renewal reduction
The Real Estate Capital Asset Priority Planning System or RECAPP™ (http://www.recapp.com) is a strategic planning tool that calculates the funding requirements for capital repair/renovations up to a 25-year time horizon (Gordon and Shore 1998). RECAPP allows the user to input data at an organizational, regional, district, building or departmental level and permits the user to enter information about assets such as building location, gross area, tenancy, and asset type. It also stores additional data such as digital images of the facility, system and components or CAD drawings of the floor plan. It can save archival information such as construction cost, age of facility, and maintenance expenditures. The output of RECAPP includes sophisticated plotting routines with histograms, pie charts or line plots depicting portfolio age profiles or 25 year expenditure projections.
In general, there are few tools available to asset managers to allow them to prioritize their maintenance projects.
3.7 Asset Management Implementation Plan
The concept of asset management is difficult to accept as a philosophy and difficult to implement in practice as asset management means many things to many different people. For example, some disciplines in an organization may feel they already have an asset management system in place when they have implemented an inventory system only. Or, some organizations may have some disciplines that are well-advanced in asset management implementation (i.e. bridges, roads) but will also have many that are lagging behind (i.e. parks, buried utilities). Or, some regions may have reached a plateau and wish to advance to a higher level not knowing that a sister discipline in another region has the tools and techniques in place to assist them. Because of these obvious differences in organizations and in any particular organization, an organization's asset management implementation plan should have a series of overlying principles established at the highest level in that organization. An example is provided in Table 2. The asset management implementation plan should:
• Assess organization's current level of implementation in various regions and disciplines.
• Set minimum criteria for data and information for all levels of implementation.
• Set timelines for next level of implementation Table 2: Asset Management Implementation Plan
Six "Whats" of Asset Management
Own Worth Deferred Condition Service
Life Fix First Region #1 Bridges v v v Roads v v v v Buildings v Jan 2001 $100K June 2001 $50K Region #2 Bridges v v Jan 2002 $25K Roads v v Jan 2001 $50K Jan 2002 $100K Buildings v v v Jan 2003 $25K Region #3 Jan 2001 $100K Jan 2002 $50K
4. Challenges for the 21st Century
There have been numerous reports, both in the popular press and research literature, that many buildings are run inefficiently due to poor monitoring and control systems, water and road networks are deteriorating faster than anticipated and the overall condition of Canada’s bridges remains unknown, and potentially hazardous. A lack of knowledge of the condition of the built environment means that the scarce resources that are available for maintenance and repair are often used inefficiently or inappropriately (CERF 1996). These challenges affect everyone through increased health and safety risks, reduced economic competitiveness, inefficient maintenance strategies, a reduction in the value of a nation’s built assets and a need to increase funding to maintain the built environment. In some cases, this overall inefficiency will actually create the need for “new” buildings and engineering works; even when suitable facilities already exist or can be modified.
4.1 Need for Decision-Support Tools for Municipal Infrastructure
Efficient information management is the key to better decision-making for municipal infrastructure (CERF 1996). For many organizations, major issues of service delivery are ‘repair and renew’ rather than ‘design and. Engineers, technical staff, administrators, and politicians all benefit if decisions about maintenance, repair and renewal are based on reliable data, solid engineering principles and accepted economic value. When reliable data and effective decision-support tools are in place, the costs for maintenance, repair and renewal will be reduced and the services will be timely, with less disruptions.
Many major asset owners in North America are beginning to recognize the importance of knowing the current and future states of their infrastructure. For example, Edmonton (1998) recently completed a long-range financial plan for infrastructure assets, in which it recognized the need to increase capital spending and to establish priorities for renewal or new infrastructure facilities.
Meanwhile, Winnipeg (1998) has made recommendations to: (1) invest more in infrastructure, (2) make strategic investments with the dollars they have, and (3) find ways to reduce the magnitude of the infrastructure deficit problem. More specifically relating to decision-support tools, the City of Winnipeg recommends that:
• life cycle costing analysis be used for all decisions related to infrastructure alternatives;
• maintenance can be deferred only if the impact on life expectancy and life cycle costs is minimized, and if maintenance is factored into initial infrastructure costs;
• the city’s infrastructure asset data must be coordinated and managed by the Chief Administrative Officer Secretariat, and
• computerized maintenance management systems must be adopted.
More recently, the Governmental Accounting Standards Board (GASB 1999) has put in place methods to ensure that governmental agencies account for their assets.
5. Conclusions
A multilevel plan for the implementation of asset management is presented in the form of six questions: What do you own? What is it worth? What is the deferred maintenance? What is its condition? What is the remaining service life? What do you fix first? Each successive level describes currently available tools and techniques for asset management and each “What” establishes a growing framework for the implementation of an asset management plan. Unfortunately, few tools exist in the area of strategic asset management and managers of municipal infrastructure have considerable work ahead in order to implement the full six levels described. The investigation leading to this presentation located a limited number of decision-support applications in the domain of municipal infrastructure but did not find any comprehensive solution that addresses the current and future needs for investment planning for municipal engineers and managers.
Based on the investigation completed to date and the experience learned from various related projects (Lounis et al 1998), the author identifies several administrative, financial and technical challenges to fully address the need of municipal infrastructure planning:
• seamless data integration of the software environment;
• enhancement and standardization of the currently available tools;
• central repository for the information;
• shared experiences and “best practices” such as proposed in the National Technical for Municipal Infrastructure;
• life cycle analysis and long-term service life prediction; and
The National Research Council Canada and the City of Montreal, in conjunction with the City of Edmonton, City of Hamilton, Greater Toronto Authority and the City of Ottawa are cooperating on a “Municipal Infrastructure Investment Planning” (MIIP) Project (http://www.nrc.ca/irc/uir/miip). This project addresses the need for decision-support tools and addresses some of the challenges identified earlier. The objectives of the MIIP Project are:
• Locate tools and techniques to assist municipal infrastructure investment planning.
• Investigate extent of asset management techniques by asset owner.
• Conduct field trials of tools and techniques with Consortium Collaborators.
• Develop prototype tools and techniques for asset managers to better manage their municipal infrastructure.
• Develop “state-of-practice” manuals/guidelines for asset management. 6. References
ANAO. (1996) Asset Management Handbook, Australian National Audit Office, Jun., Canberra, Australia (http://www.anao.gov.au/bpg_asstmanhbk/contents.html).
ASTM E917. (1994) Standard Practice for Measuring Life-Cycle Costs of Buildings and Building
Systems, American Society for Testing and Materials, Philadelphia Pa.
Bailey, D.M., Brotherson, D.E., Tobiasson, W. and Knehans, A. (1989) ROOFER: An Engineered
Management System for Bituminous Built-Up Roofs, Technical Report M-90/04/ ADA218529,
US Army Construction Engineering Research Laboratory, Champaign, Ill.
BLCC. (1995) The NIST "Building Life-Cycle Cost" Program, Version 4.3, User's Guide and
Reference Manual, NISTIR 5185-3, National Institute of Standards and Technology,
Gaithersburg, Md.
Burns, P., Hope, D. and Roorda, J. (1999) Managing Infrastructure for the Next Generation,
Automation in Construction, Vol. 8, 689-703.
CERF. (1996) Level of Investment Study: Facility and Infrastructure Maintenance and Repair, Civil Engineering Research Foundation, Washington, D.C.
Coullahan, R. and Siegfried, C. (1996) Facilities Maintenance Using Life Cycle Asset Management,
Facilities Engineering Journal, Mar/Apr, Association for Facilities Engineering, Cincinnati, Oh
(http://www.afe.org/).
CSA (1995) CSA S478-1995: Guidelines on Durability in Buildings, Canadian Standards Association, Rexdale, ON., 93p.
De Sitter, W.R. (1984) Costs for Service Life Optimization: The Law of Fives, Durability of Concrete
Structures, Workshop Report, Ed. Steen Rostam, 18-20 May, Copenhagen, Denmark, 131-134.
Edmonton. (1998) Securing our Future: Edmonton’s Long Range Financial Plan, KPMG presentation to Council, Available from: The City of Edmonton, Alberta, Canada.
FCM. (1995) Report on the State of Municipal Infrastructure, Federation of Canadian Municipalities. Available from: Federation of Canadian Municipalities and McGill University. FHWA (1999) Asset Management Primer, Federal Highways Administration, US Department of
Frangopol, D.M., Lin, K.Y. and Estes, A.C. (1997) Life-cycle cost design of deteriorating structures,
ASCE Journal of Structural Engineering., Vol. 123, No. 10, 1390-1401.
GASB (1999) GASB Statement No. 34, Basic Financial Statements—and Management's
Discussion and Analysis—for State and Local Governments, Governmental Accounting
Standards Board, Norwalk, CT.
Gordon, A.R. and Shore, K.R. (1998) Life Cycle Renewal as a Business Process, Innovations in
Urban Infrastructure Seminar of the APWA International Public Works Congress, Las Vegas,
USA, pp. 41-53, (http://www.nrc.ca/irc/uir/apwa/apwa98).
HAPM (1995) LifeSpans of Building Components, Technical Note 6, Housing Association Property Mutual, June, 1995, London (http://www.hapm.co.uk).
Kleiner, Y.; Adams, B.J.; Rogers, J.S. (2001) "Water distribution network renewal planning" Journal
of Computing in Civil Engineering, 15, (1), Jan., pp. 15-26.
Lemer, A.C. (1998) Progress Toward Integrated Infrastructure-Assets-Management Systems: GIS and Beyond, Innovations in Urban Infrastructure Seminar of the APWA International Public
Works Congress, Las Vegas, Nevada, pp. 7-24, (http://www.nrc.ca/irc/uir/apwa/apwa98).
Lounis, Z. Vanier, D.J. Lacasse, M.A. and Kyle, B.R (1998) Effective decision-making tools for roofing maintenance management, First International Conference on New Information
Technologies for Decision Making in Construction, Montreal, Canada, pp. 425-436,
(http://www.nrc.ca/irc/fulltext/nrcc42831.pdf).
NACUBO (1990) Managing the Facilities Portfolio, National Association of College and University Business Officers, Washington, DC, 100p.
NRC. (1996) Budgeting for Facilities Maintenance and Repair Activities, Standing Committee on
Operations and Maintenance, Report 131, National Research Council, National Academy Press,
Washington, D.C.
PM. (2000) Plant Maintenance Resource Center, Winthrop, Western Australia (http://www.plant-maintenance.com/maintenance_software.shtml).
Shahin, M.Y. (1992) 20 Years Experience in the PAVER Pavement Management System:
Development and Implementation, Pavement Management Implementation, F.B. Holt and W.L. Gramling, editors, ASTM, Philadelphia, Pa.
Uzarski, D.R., L.A. Burley (1997) "Assessing Building Condition by the Use of Condition Indexes",
Infrastructure condition assessment: art, science, and practice: proceedings of the conference
sponsored by the Facilities Management Committee of the Urban Transportation Division of the American Society of Civil Engineers, Boston, Massachusetts, August 25-27, pp. 365-374. Vanier, D.J. (2000) Advanced Asset Management: Tools and Techniques, Innovations in Urban
Infrastructure Seminar of the APWA International Public Works Congress, Louisville, U.S.A,
pp. 39-56, (http://www.nrc.ca/irc/uir/apwa/apwa00).
Vanier D.J. (2001) Why industry needs asset management tools, Journal of Computing in Civil
Engineering, 15 (1), January, pp. 35-43.
Winnipeg. (1998) Strategic Infrastructure Reinvestment Policy: Report and Recommendations, Available from: Strategic Infrastructure Reinvestment Policy, City of Winnipeg, 100 Main Street, Winnipeg, Manitoba, Canada R3C 1A4, Tel: (204) 986-7997.