Publisher’s version / Version de l'éditeur:
Physical Review B, 21, 3, pp. 926-936, 1980-02-01
READ THESE TERMS AND CONDITIONS CAREFULLY BEFORE USING THIS WEBSITE.
https://nrc-publications.canada.ca/eng/copyright
Vous avez des questions? Nous pouvons vous aider. Pour communiquer directement avec un auteur, consultez la première page de la revue dans laquelle son article a été publié afin de trouver ses coordonnées. Si vous n’arrivez pas à les repérer, communiquez avec nous à [email protected].
Questions? Contact the NRC Publications Archive team at
[email protected]. If you wish to email the authors directly, please see the first page of the publication for their contact information.
NRC Publications Archive
Archives des publications du CNRC
This publication could be one of several versions: author’s original, accepted manuscript or the publisher’s version. / La version de cette publication peut être l’une des suivantes : la version prépublication de l’auteur, la version acceptée du manuscrit ou la version de l’éditeur.
For the publisher’s version, please access the DOI link below./ Pour consulter la version de l’éditeur, utilisez le lien DOI ci-dessous.
https://doi.org/10.1103/PhysRevB.21.926
Access and use of this website and the material on it are subject to the Terms and Conditions set forth at
Optical hole burning in ruby
Jessop, P. E.; Muramoto, T.; Szabo, A.
https://publications-cnrc.canada.ca/fra/droits
L’accès à ce site Web et l’utilisation de son contenu sont assujettis aux conditions présentées dans le site LISEZ CES CONDITIONS ATTENTIVEMENT AVANT D’UTILISER CE SITE WEB.
NRC Publications Record / Notice d'Archives des publications de CNRC:
https://nrc-publications.canada.ca/eng/view/object/?id=3deadbaa-110f-4fd0-9a27-5e3e41f3ac80
https://publications-cnrc.canada.ca/fra/voir/objet/?id=3deadbaa-110f-4fd0-9a27-5e3e41f3ac80
PHYSICAL REVIEW B VOLUME 21,NUMBER 3 1FEBRUARY 1980
Optical hole
burning in rubyP.
E.
Jessop,T.
Muramoto,"
and A.SzaboDivisioIt ofElectriea/ Engineerittg, NatioIIal Research Courteil ofCaItada, Ottawa, Cattada
K13
OR8(Received 23July 1979)
We report experimental and theoretical studies ofoptical hole burning in the inhomogeneous
R&line ofruby at low temperatures. Both Stark-shifting and pump-probe techniques using
narrow-band single-frequency lasers were employed. Inaddition to the observation ofnarrow holes, we have found that a large (up to 70%)decrease in absorption occurs outside the hole and that the relative size ofthis decrease isconstant over the entire inhomogeneous line. This effect isascribed to fast resonant cross-spin relaxation in the ground-state levels which drives all
spins within the optically pumped volume to acommon spin temperature. A theoretical model
isformulated which describes the power-broadened hole shapes aswell as the off-resonance de-crease inthe absorption coefficient. Fair agreement with experiment isobtained for the case of amagnetic field applied along the ~ axis; however, sizable deviations from the theory are seen
for zero field. We conclude that further studies are needed to elucidate the nature of the Al superhyperfine-broadening mechanism. An upper limit of1200nm isdeduced for the size of macroscopically broadened regions in ruby.
I.
INTRODUCTIONThere has been increasing interest recently in
optical-hole-burning and fluorescence-line-narrowing
(FLN)
studiesof
inhomogeneously broadened linesin solids. The resolution
of
these laser techniques islimited ultimately by the homogeneous rather than the inhornogeneous widths. Therefore, high-resolution Zeeman, ' Stark,
'
and strain-broadening spectroscopy become possible. Such studies have re-cently allo~ed measurementsof
small hyperfine split-tingsof
optical transitionsof
ions in crystals' and have given information on line-broadening mechan-isms."
These experiments compliment similar stud-ies using coherence techniques.'
Alsoof
interest are various phenomena in the areaof
hole burning.These include short-time phenomena, such as the
cross-relaxation effects described in this and earlier work, as well as long-lived effects, for example pho-tochemical hole burning in organic solids
'
and color centers."
Higher-resolution spectroscopy ispossible with hole burning than with FLN because in the latter technique resolution islimited by the
in-terferometer. With hole burning, resolution is
limit-ed only by the laser stability. Finally, there is
in-creasing interest in the possibility
of
using holeburn-ing for a high capacity, frequency-selective optical memory. '
In this paper we extend earlier studies
of
ground-state cross-relaxation effects on optical hole burningof
the R~ line in ruby. Previously a sideband-spectroscopy technique was used. The frequency coverageof
the optical probe used to study the holewas limited to
+30
MHz about the hole. Here wedescribe two additional techniques, one
of
which hasallowed us to make probe observations over the
en-tire inhomogeneous [
—
26Hz
FWHM (full width at half maximum)] R~ line at693.
4 nm when a hole isburnt into it by anarrow-band (
(
2MHz jitter peak to peak) single-mode, cw ruby laser. In addition to the hole, a large (up to 70%) decreaseof
absorptioncoefficient is seen over the etitire inhomogeneous line, unequivocally indicating the presence
of
spatial transport processes. In this paper we present a de-tailed theoretical and experimental studyof
this surprising effect.InSec. IIwe describe experiments using a Stark-switching technique to measure the hole shape. Ad-ditional hole-burning studies are reported in
Sec.
III in which two separate lasers were used, one to satu-rate and one to probe the hole. InSec.
V, a physicalmodel and theoretical description
of
hole burning ispresented. In Secs. VIand
VII,
a detailed compari-son between theory and experiment is presented along with a discussionof
implications for macro-scopic versus micromacro-scopic inhomogeneous broadeningin ruby.
II. STARK STUDIES A. Introduction
When an electric field isapplied along the caxis
of
ruby, a linear "pseudo"-Stark splitting' isobserved for the Cr +R~and other lines. There are two kindsof
sites occupied by the Cr'+ ions in A1203which are related to each other by inversion symmetry. The R~line associated with each site shifts linearly with field,
in opposite directions, to produce the pseudo-Stark-splitting. In this section we describe experiments
FREQUENC Y
(a)
E-0
SOX CARH
C AXIS
REcORD
ABSORPTION
Ei
setu for Stark-shifting
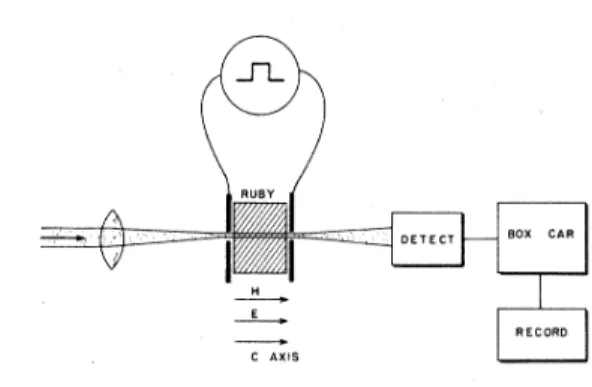
FIG. 2. Schematic of.apparatus seup experiments.
(c)
LASER
, S k- hifting technique for measuring hole a e. {a){top)shows the hole inzero field. n
shape. a top s
'
ld ulses shift the hole in-{c)successively larger electric fie pu
creasing 1yaboveve aand below the laser frequency.
which use the Stark effect to measure p
'
o tical hole shapes in the Ri line
of
ruby.Fi
.
l.
The basic l'dea o
f
the method' is shown in Fig. Fi.
1 a) we show a hole burnt into aninhomo-f
t' n electric field is pulsed on, in Figs. 1 an1(c),
the hole splits alld shlf'ts to hlge
.
Thus the hole can be scanned througheq e
is.
s ethe laser frequency either point by poin as ' and eariier wor or
an l' k or by the continuous tuning.
In the present experiments,
t.
e ho eby monitoring the change in transmitted light when the field was pulsed on.
the crystal. M
.
ost experiments were done at atem-—
5K.
A transparent conducting coa-peratureof-t' oated to give a transmission o
86%at
6900
A, was applied to two surfaces o e'd the electrodes. The electric
ruby sample to provi e
a air
of
coaxialfield signal was applied through a pair
of
coaxiatransmission lines with the output line being
ter-minated in 50 ohms.
Tuning
of
the laser in the vicinityof
the4~,
(+-,
E(+
—
)
transitions was achieved byt erature control
of
the laser ruby. The laser beam was circularly polanzed and o ytempera u
4A&
——
)
E(
——
)
transition was studied. Usuallyt e aser ' ' in
—
100
MHzof
the laser frequency was fixed
within-the peakof
this line.s littin using FLN is
A measurement
of
the Stark splitting using is Fi.
3.
Since only a pseudo splitting"oc-d in order to ob-curs, the electric field must be pulse in o
serve the Stark-s-
h'f
i tedFLN.
We used square-wave modulation at 10kHzz, a rate sufficiently high toof
minimize
E
relaxation effects. As expected, each o59
MHz8.
Stark switching—
experimental Thee expex erimental setup is shown 'inFi.
'g.2.
Auced by a cw ruby single- re
-f
quency laser beam pro uce yf
ed into the ruby sample along the c axis.laser is ocuse i
re a lied along the
Th
e
eec
1 tric and magnetic fields are app ie ain this paper,
.
In all the experiments reported in h p pa Czochralski-grown ruby samp
e,
nufac-t.
% Crl03 (as specified by the manuac-turer, Union Carbide) was used. The samp
e
em-d b aLakeshore silicon diode
erature was measure y
h d t the copper structure holding thermometer attac
e
oFIG.3. Measurement ofStark splilittingin ruby at 5K
us-1' narrowing. The Stark lines appear
ing fluorescence ine narr
1'
928 P.E.JESSOP,T.MURAMOTO, AND A.SZABO 21
the two Stark lines has half the intensity
of
the un-shifted line, The observed' shiftof
the lines is0.
110+0.
008 MHz/Vcm'.
The slight asymmetryof
the Stark-line positions in Fig. 3about the unshift-ed line arises from driftof
the laser frequency andFabry-Perot interferometer spacing during the scan.
Several scans were averaged to give the quoted Stark
coefficient. Our value is consistent with an earlier result,
"
0.
114
MHz/V cm ' obtained by a nonlaser techique.The beam-collection geometry is shown in Fig.
4.
This geometry was devised to allow an accurate mea-surement
of
the beam intensity and to restrictobser-vations to the central 10'/o
of
the beam to avoid edgeeffects. The intensity in the center
of
the beam inthe sample is
d mPp
AL Fd
where Pp is the total beam power, Fd isthe fraction
of
power transmitted through the aperture diameterd, and Lis the distance between the aperture and
fo-cal plane. We chose d sufficiently small that the in-tensity was approximately constant in the aperture.
A reed-switched transmission-line pulser supplied a
rectangular voltage pulse, 400 nsec in width and with a height which was variable up to 100volts. A PAR
162 boxcar with a 10-nsec gate averaged the signal at
a 80-Hz repetition rate. This gave a duty factor
of
3
x 10
'
during the pulse for an average probe po~erfar below the value
of
0.
1 W/cm' for which saturationeffects begin to appear. The signal level
correspond-ing to a transparent sample was measured by heating the sample to 120 Kwhich moves the R~ line 43
6Hz
outof
resonance with the laser. Theunsaturat-ed absorption coefficient o.
„was
measured byrecord-ing the decrease in the transmission
of
a low-powerlaser beam as the s'ample was cooled from 120K back to 5
K.
A valueof
ot„=11,
0+0.
4 cm ' wasdetermined from the observed attenuation
of 5.
2inour
1.
5-mm-thick sample. Data showing the fre-quency dependenceof
the hole shapes, obtained byscanning the electric field pulse amplitude, are shown
in Fig. 5 for various laser intensities in the sample.
0.03'/o RUBY I5mm THICK
I750 Oe I( TO c AXIS 5 K 12— IO-O u B u LJJ 0 O 0 4 I— o. 0 In 0
UNSATURATED ABSORPTION COEFFICIENT
+/Cm2
FREQUENCY (MHz)
90
FIG. 5. Experimental hole shapes in ruby using the Stark-shifting technique.
Measurements were made near the end
of
the pulse to avoid the small power-broadened free-induction-decay signal seen near the leading edgeof
the pulse. Two features to note in these results are: (i)as the intensity increases, the hole deepens and becomes in-creasingly power broadened, and (ii) a large decreasein the absorption coefficient is seen up to
-90
MHzaway from the hole.
III. PUMP-PROBE STUDIES A. Introduction
B. Experimental
The aim
of
these studies was to extend the hole-burning observations to cover the entire inhomo-geneous line shape. A disadvantageof
the pump-probe method was that the spectral resolution wasabout an order
of
magnitude less than in the Stark studies becauseof
the relative driftsof
the two lasers. In the Stark as well as iri the earlier sideband tech-niques, this relative frequency drift was absent since the pump and probe beams were derived from thesame source. However, since the main purpose
of
the experiment was to study the off-resonance
sat-uration behavior where high resolution was not im-portant, this deficiency was not serious.
8EAM
IN
SAMPLE AT
FOCUS
APERTURE
FIG. 4. Laser-beam collection geometry used to observe only the central part ofthe beam in Stark experiments.
J
The pump-probe experimental setup is shown in Fig. 6, The saturating pump beam was thermally tuned and fixed near the center
of
the inhomogene-ous line, while acounter-propagating, weak,nonsat-urating probe beam was tuned to measure the inho-mogeneous line shape. The probe-beam diameter
was adjusted to be about three times smaller than the
pump beam to minimize edge effects arising from the Gaussian beam shape and the slight misalignment between the two beams required to prevent feedback and consequent frequency instability
of
the lasers./lazily ~Xg PUMP PROBF .A"xg 'vb '~ &''~"„PROB H C E Q PUMP PUMP b%%
"""&
h&/PROBE .'Fg /g 0 O Luo C9 p 0' I —I.O -0.5 ~fl H=0 II ~ I I 1 II ~ ~ I 05 FREQUENCY (GHz) I I.O p 'p~p
p—
p—
p-~H—.~0. SPEC TRUM ANALYZ ER PROBE SIGNALFIG.6. Experimental setup for two-beam studies ofhole burning.
FIG. 7. Normalized hole-burning data using the pump-probe technique. Note that the off-resonance change in ab-sorption isindependent of'frequency difference from the pump beam.
A2(
——
1)
E
(——
) Zeeman transition. Thefre-.2 2
quency difference between the pump and probe was
measured by heterodyning the beams on a fast diode
detector and observing the beat frequency on a
spec-trum analyzer.
C. Pump-probe results
vs frequency difference from the pump beam. We see here two striking effects. First the fractional
off-resonance change in
n(v),
F, outside the hole isin-dependent
of
frequency and secondF
is much largerin zero magnetic field. These two effects are
qualita-tively explained by the cross-relaxation mechanism discussed later.
The unsaturated absorption profile
of
our samplewas measured by blocking the pump beam and tuning the probe beam across the inhomogeneous line. The
absorption coefficient was calculated from the usual
expression
u(v)
=
—
—
l lnP(v)
r Pp(v)
where Po isthe incident power and tis the sample
thickness. Automatic compensation for various
win-dow and lens losses was obtained by measuring Po
with the sample temperature detuned asdescribed earlier. The linewidths observed were in the range
1.
5 to1.
86Hz
depending on position in the sample.These values are typical for the low-strain,
laser-quality Czochralski-grown rubies we have studied. When the pump was unblocked, the probe power transmitted by the crystal increased. In addition to the optical hole burnt at the pump-laser frequency, there was an overall decrease in absorption across the entire inhomogeneous line. Checks were made to ensure that the pump-induced signals were not due to pump leakage or scattering, by blocking the probe.
Pump leakage into the probe beam was typically less than 10%
of
the probe power and was corrected for inthe data analysis. The quoted pump intensity was not as acurately measured as in the Stark experiments and was estimated by calculating the focal-spot
diam-eter from the diffraction-limit formula.
In Fig. 7we show normalized results in which the
percentage change in absorption coefficient isplotted
D. Temperature dependence I,O H 0Oe B W/cme 0.5— u p p pp p p p p p p 0.05 I I O.I O.I5 (TEMPERATURE) ' (K') I O.20 0.25
FIG.8. Measured (0)and theoretical (
—
) temperature dependence ofthe fractional off-resonance changeF
in ab-sorption coefficient at zero field,As a further test
of
the cross-relaxation model, westudied the temperature dependence
of
F.
The two-beam technique was used with the probe beam set—
600MHz from the pump frequency. The sample temperature was controlled by adjustmentof
the helium-gas temperature flowing into the sample chamber using an electronically controlled heater.Figure 8shows the dependence over the temperature range 5
—
40K.
F
isseen todecrease steadily as the temperature is increased.930 p.
F.
JESSOP,T.MURAMOTO AND A SZABO 21IV. SUBSIDIARY MEASUREMENTS
SysTEM RESOLUTIPN
+
7~3MHzO.PI%RUB~
4.2K
'
on
of
theory and experiment,know-For comparison o
es and
homogene-of
the various relaxation times anp
f
h homogeneous linewidth or edependence o t e
nc-4A
(+
—
)Et+
—, ran' '
A2
—
—
2 ( —,)
t sition and laser-frequey-jitter measurements.
9.3MHz
A. Spin-lattice time E-Ap('/2)
E-
Ag (/p)'
ths
—
field dependenceB. Homogeneous linewid
ments' in ruby have yielded
t edetailed dependence
of
the homogeneousine-nts
of
echo li etimes exismeasurements
'dth
measure-we resent homogeneous linewi
Here we presen
0
—
200Oe using the Stark ments in the field rangeMeasurements were
i ue for hole observation.
d o
bod
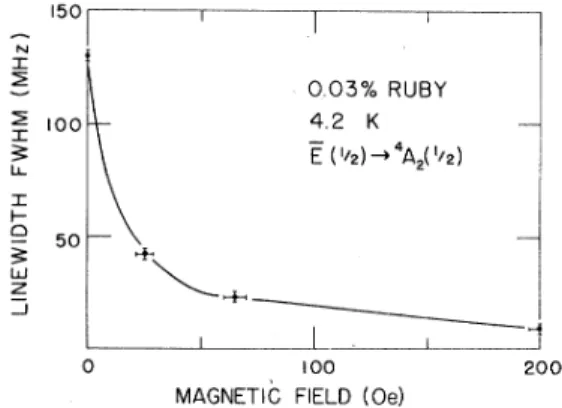
made at low laser poower to avoi pow The results are shown in Fig.
9.
At zero iel50 & IOO 0.05%RUBY 4.2 K E('~a)
~
A~('&a) so LIJ I 200 I00MAGNETIC FIELD (Oe)
ndence ofthe hole linewidth FIG. 9. Magnetic field dependence o
4A
(+
—
) Etransition in ruby. ofthe A2nown to be very sensitive to S in-lattice times are known o
'
s.' In particular
Fe
an thepresenceof
impurities.f
ma nitude'+
'ruby can produce orders o g '
'+
l t' n time by resonant andof
the Cr re axa ioreduction o
To
categorize our sam-nonresonan nt cross relaxation. ocaeal technique. The
measured Ti by an optica ec
pie, we mea
two-beam methododwas used with the probe beam
dis-beam. Pulsing
-600
MHz from the pump beam.placed-and monitoring the recovery
of
tion coefficient by the probe yie e
2
30K
fr
ob d tern erature rangetemperature depe ndence
of
i was one- honon relaxation process.
at li uid-helium tempera-serveed valuev
of
215msec at liqui - eiule"
ture is typical for a pure samp
e.
- arrowing spectra of 0.01%
FIG.10. Fluorescence line-narrowing ruby in afield of400Oe.
width (half the observed FWHM homogeneous linewid
eswith '
th is 65
+
10 MHz. This value agrees witFLN observations made with t is sam th
tth
hot Stark data.
'
As an interesting aside, we see t a
'dth
of
the F. (+
—,)
A2 andF. (
+
—
)4A2 transitions become t ee same ats zeroE
+
2 rhoton-echo studies,
"
field. As is well known from pa ma netic field isapplied, these transition linewidths rapidly diverge. is is
FLN results in
F'
ig. 10 for dilute ruby in w ic af
—
35 MHz is observed for the resolved width o—
zE
(+
—
) Aq transition and an unreso ve wi+
—
)4A2. For anap-(
5 MHz isobserved forE
+
—,field
of
—
—
1 kOe, recent photon-echo studies'ahomogeneous
of
the present sample indicate alinewidth
of
160kHZ for F.(+
—,)'A,
.C. L'aser jitter
ntal arameter which arises An important experimen a p
n-
of
theory and experiment is t ep
r fre uency jitter; both its magnitu e an
j
'itter was ac ieveh' d by using a new laser con it frequency jitter arising
Th
f
tall elimina es
- ower fluctuations. isc
(0003'/o)
d very low concentration ruby
.
o ause ave
tin effects and a rto suppress pump-heating e
cr stal (0 05%) s ltfter.
more concentrated y
were operated in series wi
-l rbeam transmitted throug e
gon-ion pump- aser ea
um the amplifier.
op
pMeasurements were made with a
n econfocal Fabry-Perot with a
spectral-range con o
F
500P)
Thepeak-to--.
rwas1.
5—
2MHz giving an rms width o—
0.
7 MHz—
a value similar to ain heterodyne methods. The jitter fre-quenency rate was in arange up
to—
mari1y by cryostat mechanica1 vibrations and pointing fluctuations
of
the pump argon-ion laser. Unlike jet-stream dye lasers, which exhibit frequency fluctua-tion rates up to—
1 MHz, such high rates were total-ly absent in our system since a solid blockof
ruby constitutes the 1aser cavity.V. THEORY A. Zero laser-frequency jitter
3A
PUMP RE'DUCED
ABSORPTION
.We have previously described how cross relaxation
in the ground-state levels
of
ruby can produce anoff-resonance decrease in optical-absorption
coeffi-cient when a hole is produced in the R~ line by a monochromatic laser beam. Also, in FLN experi-ments in
0.
03%ruby, the fluorescenceinhomogene-ous background was measured to be less than 1%
of
the line-narrowed peak. Therefore we concluded that there is no optical spectral diffusion. This conclusionon the lack
of
optical energy transfer betweenreso-nant and nonresoreso-nant ions isfurther supported by
re-cent'9 grating experiments in ruby which show no
spatial transfer beyond
30
—
50nm from opticallyex-cited ions. We contend that the spatial energy transfer, which must exist to account for our results,
occurs in the ground-state levels.
Our earlier three-level model isextended here to
the more realistic six-level system shown in Fig.
11.
The six-level model is appropriate for
E
A2transi-tions in an applied magnetic field. In order to estab-lish some basic rate-equation approximations, we as-sume initially that the ions may be divided into two groups, those resonant with the laser and those
non-resonant. Using these model equations, we then
for-mulate a theory in which a continuous frequency dis-tribution is treated.
In Fig.
11,
level 2 isthe A2(—
2)
level which ispumped to level 3A
[E(
—
2)].
The usual ratioof
o spontaneous rates from theE
levels is taken, and the much slower m spontaneous rates are neglected. Thepopulations
of
the resonant ions will be denoted byn,
and the nonresonant ones by N .For
level 1Aof
the resonant ions we have
dt 3Pn
~'~
—
+3yn3A+P(n2
+ nlc+
n]s)
,[nt'q(Nt'
+N)'s+N&c)
—
Nt'g(n2+
nt'a+
nic)
~(2)
P
is aground-state spin-lattice relaxation rate whichisassumed to be the same between all levels so that the spin-lattice time Tt
=
(4P)
.
Actually, according to relaxation theories for ruby in which aquadratic spin-phonon Hamiltonianof
theform"
Hsp=
S D S produces relaxation, the latter assumption is notjus-tified.
For
example, direct relaxation between the+
—,levels isforbidden as in fact has recently'
beenverified at very high magnetic fields
(50
—
130 kOe).
However, sizeable deviations from the theory have beenseen"
at lower fields such as used here. Lack-ing further information, we have assumed for simpli-city equal spin-lattice rates rates between all levels.In Eq.
(2),
cois a resonant cross-relaxation rate whichfor
0.
03%rubyis24"
—
106sec '»P
—
1sec ' (at4.
2K)
and also»
y=
(Sr)
' wherer
is the F.fluorescence lifetime
of
4X10
sec. Writing similarequations for n~'~ and n~'~, we obtain for
I I I I n)
—
—
—
n)„+n)~+n)~
Ict
= —
Pnt'+3Pn2 +4yn3
—,
N' (n~'N2—
n2Nt') 1C lARESONANT IONS NON-RESONANT .IONS
where N' is the total population
of
off-resonanceions, N~' =N~'&
+N~'&+NIc,
and n3=n3~
+n3g.
Be-causeof
the fast Orbach relaxation in the'E
levels at the temperatures in our experiments, we taken3~
=
n3~.For
N2 we have FIG.11. Six-level model used for ruby in amagneticfield. The 2 3Atransition is optically pumped, and cou-pling between the resonant and nonresonant ions occurs via cross relaxation in the four ground-state levels. Pisthe spin-lattice rate assumed equal between all levels (only two levels are shown coupled for simplicity), eoisthe
cross-relaxation rate, and (5y) ' isthe fluorescence lifetime. 4yn3
=,
(nt'N2—
n2Nt') N'(5)
I=
pNt'—
3pN2—,
(nt'Nt'—
n2Nt' ).
(4) dt N' ~I ~ /932 P.
E.
JESSOP,T.MURAMOTO, AND A.SZABO 21 We can neglect terms involving Pin Eq.(3)
becausethe spin-lattice relaxation in the ground state
of
the resonant Cr'+ ions is very much slower than the crossrelaxation to the nonresonant ions. Combining Eqs. (4) and (S)gives
4yn3
=
pNI'—
3pN3We might remark that the results obtained by using
the above approximation along with the spin-tem-perature approximation [Eq.
(14)]
are identical to those obtained when the rate equations are exactly solved for a three-level system and due approxima-tions made because ol»
y,P.
We now consider acontinuous frequency depen-dence for the populations. Define the total popula-tion in level i by
f
eon,
—
=
~
n;(v')
dv',
the same spin temperature, i.
e.
,111(V
) =/n3(V )
(14)
~here
for all v', and
f
is aconstant to be evaluated. Thethermal-equilibrium value
of
f
isf
=3
in the high-temperature approximation used throughout. Equa-tion(14)
assumes a limiting size 1'or macroscopicre-gions in which ions have a constant optical frequen-cy, as will be discussed further in
Sec. VII.
Combin-ing Eqs.(12)—(14)
givesNpgi
(v
vo)(1S)
2+
(f
+1)
[1+10y/o.
(v'
—
vL)P] We write pNog;(v'
—
vo)1+4[(v'
—
vl.)/8]'
where v' is the optical frequency
of
the ion for the transition from level 2 to 3A. The absorptioncoeffi-cient for this transition is
n(v)
=J
[n3(v')
—
n34(v')]a(v
—
v')dv'
0 where and.
=
[(1+f)/S+ (3+f)]-I
(17)
(18)
G'(V V)
=
(Togs(V V)and g~ isa normalized Lorentzian
homogeneous-line-shape function. Rate equations for population packets at v' may be written
dn34
(v')
=
rr(v'
—
vt)
P[n3(v')
—
n34(v
) ] dt—
5yn34( v')+
R [n3s( v')—
n34( v') ]Here
S
=
IrpP/Syvrwp and wp equals thehomogene-ous linewidth (FWHM). 5is seen to be the
power-broadened linewidth
of
the population in 3A. Fromthese sets
of
equations, the frequency-dependent ab-sorption, Eq.(8),
may be evaluated4u„(v)
p(3+f)
8(
w„+
5)
nv="
1——
19 1+f
(wp+8)'+4(v
—
vl)'
and(10)
dn„(v')
R[1134(P
)
n313(v')]—
5yn313(v') dtwhere in the integration, we assume w;
[the.
inhomo-geneous linewidth (FWHM)]»
wh sothatg;(v'
—
vp) may be taken outside the integral.n„(v)
is the unsaturated absorption coefficient.
~,
(v)
= —
„(~oNo)g;(v
1—
vo).
where
8
is the Orbach relaxation rate, I'is the pho-ton flux in photons/cm sec, and vL is the laserfre-quency. Adding Eqs.
(10)
and(ll)
and settingn;=0
giveso(v'
—
vl)Pnl(v')
=
[10y+
Ir(v'—
vL)P]n34(v )
(12)
Population conservation requiresEquation
(19)
describes the shapeof
the power-broadened hole (width=
wp+
5)
as well as theoff-resonance change in
n(v)
due to cross relaxation.Our remaining task isto calculate the spin-tem-perature factor
f.
We now assume that Eq.(6)
derived for asquare line shape also applies for a Lorenztian line shape so thatill
(
v)
+
(
nt)v+ 113(v )=
cVpg;(v'—
vp),
(13)
4yn3 gy1134
=
p(nl
—
3n3)(21)
where No is the total population, g; isa normalized Gaussian inhomogeneous-line-shape function, and vo
is the center frequency
of
the inhomogeneous line.Because
of
fast cross relaxation, we assume that alispins within the optically pumped volume come to n)
+
n2—
No (22)remembering now that n sare total populations. In
writing Eq.
(21),
we assume that the hole width ismuch smaller than the inhomogeneous width.
Combining Eqs. (22)and
(14)
with Eq.(21)
gives(f
-3)
87n3g
=p&p
( )
Integration
of
Eq.(16)
over v' gives1
n3g
=
2'rrpSNpg;(VL—
vp)(23)
(24)
—
3 2[&(3+,f)
+(I
+,f)
j=(&&)',
(
f+
I)
where(25)
JC
=8(~ln2)'~'
~
P
w(. (26)Equations
(17), (18), (23),
and (24) may becom-bined to give an expression from which
f
may beob-tained in terms
of
known parameters. We take the~aser frequency vL
=so.
We havew„w„+J.
The hole width Wj, in Eq.(19)
becomes 1/2W=(
+J)1+
f
+I
(I
+
f)
(31)
which in the limit
of
low power(S
.0)
becomesWj,
=2(
wp+ J)
as might bephysically expected. The caseof
slow jitter is more difficult to treat andwe proceed intuitively. Looking at the line shape for
the n3~ population in Eq.
(16),
we replace(32)
5~5+
J;
i.
e.
, the Lorentzian jitter width simply adds to the power broadened width 5. The next question is, howis ~ modified by the jitter?
To
first order, we expect eto be independentof
jitter. In other words as the laser frequency moves about, the peakof
the n34population remains at the no-jitter value. This is what we mean by "slow"jitter. These considerations
change Eq. (25) for
f
to the equationa„(v)
—
n(v)
n„(v)
(27)
An experimental parameter, in which we have been particularly interested (see Fig. 7) is the frac-tional change in off-resonance absorption defined by
—
3 2[S(3+.
f)
+(I
+ f)
j(f+
I)
J
(1+
f)
wp&(3+f)
+(1+f)
(33)
where the observation frequency v is sufficiently farfrom vL to be outside the hole. From Eq.
(19)
(28)
Thus,
oncefis
numerical, ly evaluated from Eq.(25)t
experimental quantities such as
F
and the observed hole width W~=
~~+5
may be calculated.B.
Effectof
laser-frequency jitteri/2
Wp
=2J+
wp1+
+1
(1+
f)
which again approaches the proper limit
2(
wp+ J)
inthe limit
of
low power.(34)
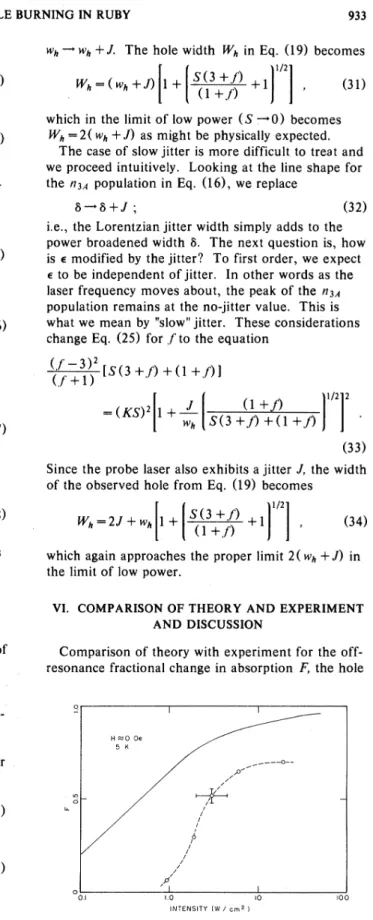
VI. COMPARISON OF THEORY AND EXPERIMENT
AND DISCUSSION
Since the probe laser also exhibits ajitter
J,
the widthof
the observed hole from Eq.(19)
becomesWe calculate the effects
of
laserjitter in the limitof
two extremes, (i) the jitter rate is much faster than the system time constants which determine the time development
of
the hole, and (ii) thejitter rate ismuch slower than these time constants.
For
simplici-ty, a time-averaged Lorenztian shape for thejitter-broadened laser line shape is assumed.
Consider first fastjitter. In this model we write for
the spectral distribution
of P
in Eqs.(10)
and(11)
Comparison
of
theory with experiment for theoff-resonance fractional change in absorption F,the hole
P(v")
=Ppg,
(v" —
vL) where(29)
/I2J
g/(v vL)=
[J'+4(
"—
)'j
(30)
IHere
J
is the laser-jitter linewidth(FWHM).
Onin-tegration over
v"
in Eqs.(10)
and(11),
this simplyresults in aconvolution
of
J
with ~q sothat all the earlier analysis may include jitter by replacing0 O.I / / / / l I I.O iNTENSITY (W/ cm~) IO0
FIG. 12. Comparison oftheory ( )and experiment
(-0-)for the fractional change
F
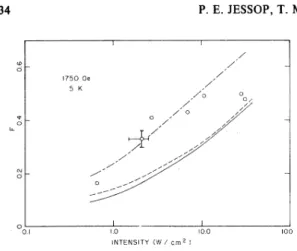
in off-resonance absorption coefficient for zero field.934 P.E.JESSOP,T.MURAMOTO, AND A.SZABO 21 CU 0 1750Oe 5K Zo 0 Oy N R II u T O hJg Z LLt O Z 1750Oe 5K 0 O.I I I.O I0.0 INTENSITY (W/cm ) O O.I I I.O INTENSITY (W/ cm~) I 10.0 IOO
FIG. 13. Comparison oftheory and experiment (0)for the fractional change
F
in off-resonance absorption coeffi-cient vs pump intensity for an applied magnetic field along the caxis. Theoretical curves (1)no laserjitter,
(2)slow laser jitter ofwidth 0.7 MHz FWHM
—
—
—,(3)fast laser jitter ofwidth 0.7MHz FWHM—
—
.FIG.14. Comparison oftheory and experiment (0)for the holewidth (FWHM) vs pump intensity for an applied magnetic field along the c axis. Theoretical curves (1/ no laser
jitter,
(2)slow laser jitter ofwidth 0.7MHz FWHM—
—
—,(3)fast laserjitter ofwidth 0.7MHz FWHMwidth, and the temperature dependence
of
F
isgivenin Figs. 12
—
14and in Fig. 8. These are discussed inthe following paragraphs.
A. Zero-field studies—
temperature dependence
The two parameters in the theory which are tem-perature dependent are T~ and the homogeneous linewidth. The direct process and Raman-induced phonon linewidths were calculated from the theory
of
McCumber and Sturge'
using the photon-echo-derived" direct process coefficientP'=g.
l cm ' and the Raman coefficiente'
=544
cm'.
The phonon-induced linewidth was then added to the homogene-ous linewidthof
65 MHz measured at 5K.
The cal-culated variationof
F
with temperature is shown in Fig. 8along with experimental data. The observed decrease inF
with increasing temperature isqualita-tively predicted by the theory; however, the
theoreti-cal curve lies well above the observed points. A similar deviation isalso observed in Fig. 12where the power dependence
of
F
is shown for zero mag-netic field.The
F
values in an applied field (Fig.13)
aresmall-er than in zero field (Fig.
12).
This is qualitatively explained by the theory as arising from the larger homogeneous linewidth in zero field.One assumption
of
our theory which could explain partof
the discrepancy at low powers (small satura-tion) issimply that our sample is not optically thin. However ifwe assume a worst-case situation in which the smallest measured intensity isattenuated by a factorof
5 (corresponding to the unsaturatedat-tenuation), the theoretical
F
value still exceeds the experimental value. Another possibility isthat the six-level model is no longer appropriate at zero field.%e
believe, however, that a major sourceof
the discrepancy isrelated to the questionof
the natureof
the line broadening produced by the superhyperfine interaction between the A1 and Cr spins. As dis-cussed by Grischkowsky and Hartmann,'
this broadening arises from the time-dependent magnetic field at the Cr site produced by the flipping Al spinsof
the host lattice. This produces a modulationm(t)
of
the Cr energy-level separation, which has aminimum value when a magnetic field isapplied along the c axis
(8=0').
As qualitatively confirmedin the FLN results
of
Fig. 12,this broadening will belarger for
Az(+
2)E
transitions than for4A,
( +
—,)E
transitions becauseof
the differentsplitting rates Sv/5H. When 8
AO', m(t)
rapidlyin-creases because the Al precession axes no longer
ap-proximately coincide with the Cr precession axes.
This results in an increase
of
the projectionof
the time-dependent partof
the Al spin vector on the Cr spin vector, hence increasingm(t)
This feature.
isresponsible for the increase in linewidth at zero field. An unknown factor is the nature
of
the time depen-denceof m(t)
which is determined by the complex Cr-Al-Al spin interactions. As discussed by Shelby etal3for
the syste.m Pr +:LaF3,m(t)
may exhibit aslow component, since Al spins near the Cr ions will
be detuned from distant Al spins, and hence their flip-flop rate will be much slower than those
of
the distant spins. This idea that superhyperfinebroaden-ing has an approximately static inhomogeneous
com-ponent along with a homogeneous component is sup-ported by recent hole-burning observations' in
Pr'+:LaF3which gave a frequency-domain linewidth
of
200kHz compared to the time-domain widthof
20kHz inferred from coherent transient studies. Itis
tempting to model the 65-MHz width
of
ruby in zero field as arising from a smaller homogeneous widthplus an "atomic jitter" width. Unfortunately accurate
echo data do not exist for ruby at zero field to test
this idea. Assuming slow jitter, this kind
of
model could bring theory closer to the data by varying ~I,and
J,
whereJ
is now identified as the atomic jitter. B. Magnetic-field studiesComparison
of
theory and experiment for the twolaser-jitter models are shown in Figs. 13and
14.
Fairagreement between experiment and theory is
ob-tained assuming that fast jitter occurs at low power levels and slow jitter applies at high power levels.
This is consistent with the idea that the hole-formation time isexpected to shorten with increasing power.
Regarding atomic-jitter, a similar problem exists as
in
Sec.
VI A in that no high-resolution data exist forthe width one would see in the frequency domain.
The 160-kHz
(
T2—
2psec)
width inferred' forourruby from echo studies ispresumably produced by
resonant cross relaxation" since T2
—
co '—
1p.sec. It might be mentioned thatcalculations"'
of
Alsuperhyperfine broadening in a magnetic field predict
a width
of
-0.
5 MHz using an approach developedby Wenzel
'
for EPR broadening. However, this theory does not consider the time dependenceof
theAl spin flips. The width is calculated taking random static Al spin configurations around the Cr ion. Since
photon-echo measurements have yielded' linewidths
as narrow as 25 kHz in dilute ruby at high magnetic field, it seems clear that the linewidth calculated from the static approach is in fact inhomogeneous.
VII. FURTHER COMMENTS AND CONCLUSIONS
Despite the lack
of
agreement between theory andexperiment for some
of
our observations, we believethat cross relaxation is the major mechanism which
produces the large change in off-resonance absorp-tion coefficient. This isfurther supported by
obser-vation
of
small increases inF
for magnetic field values at which the ground-state energy-level spac-ings are harmonically related.(See
note added inproof.
)
As is well known from EPR studies,addition-al cross relaxation occurs' under such conditions.
We might emphasize that in the field
of
spin ther-modynamics, the present studies represent a rather unique situation in which spins labeled by a particular optical frequency are initially driven by opticalpump-ing to a temperature far different from the non-resonant spins. Our significant observation that all spins within the pumped volume come to the same temperature has interesting implications regarding the spatial distribution
of
ions having the same optical frequency or in other words on the questionof
ma-croscopic versus microscopic inhomogeneous
broadening in ruby. By macroscopic broadening we
mean the existence
of
regions in which all ions havethe same optical frequency as opposed to microscopic
for which the frequency varies randomly from site to
site. This question is
of
importance in recent specula-tionsof
the possible occurrenceof
an Anderson transition in ruby. An approximate upper limit on the sizeof
macroscopic regions may be calculated.The number
of
Cr spin flip flops which occur beforethermalization occurs by a phonon interaction is AT~
=2
&10'.
Assuming a random-walk model and a step distance l—
2.
6x
10'
cm for0.
03%ruby cal-culated fromLyo's"
formulaI3=0.
17/No, we obtain a diffusion distanceof
(2.
6x
10')
(2 x 10
)'i'
-1200
nmwhich represents the maximum size
of
macroscopic regions. Also, since this distance is much less than the diameterof
the pumped filament(
—
3x 10'
cm),
significant thermalizationof
the pumped spins by the unpumped spins outside the fi-lament isnot expected. As the sample temperatureincreases, the diffusion distance decreases because
of
the decrease in T~. It is possible that theanomolous-ly low
F
values observed at higher temperature mayarise because the diffusion distance becomes less than the macroscopic region dimension. However, the generally low
F
values seen atzero field do not permit a firm conclusion.In summary, an earlier hypothesis that ground-state cross relaxation occurs over only part
of
the R~inhomogeneously broadened line in ruby is incorrect.
Using a simple three-level model and a square hole shape, this earlier hypothesis seemed to be necessary tocorrelate theory with the large observed decrease in absorption coefficient outside the hole. However, the present studies show that resonable agreement between a more sophisticated theory and experiment isobtained for cross relaxation over the entire inho-mogeneous line. The latter observation places an upper limit
of
1200nm on the sizeof
macroscopically broadened regions in ruby. Further studies are need-ed to elucidate the natureof
the R~ line broadening mechanisms in ruby due to Al superhyperfine in-teractions to explain some aspectsof
the observedoptical saturation behavior. '
Note added in proof. Asimilar observation using a
different technique has also been reported by A.
C.
Boccara; Colloq. Int. CNRS
255,
299(1977).
ACKNOWLEDGMENTS
We thank
L.
E.
Erickson for commenting on the manuscript and M. Kroll andE.
L.
Dimock forP.
E.
JESSOP,T.MURAMOTO, AND A.SZABO *Onleave from Faculty ofEducation, Shiga University,Otsu, Japan 520.
'A. Szabo, Phys. Rev. Lett. 25, 924 (1970);27, 323(1971). ~A. Szabo and M. Kroll, Opt. Commun. 18,224 (1976);A.
Szabo and M. Kroll, Opt. Lett. 2, 10(1978).
T.Muramoto, S.Nakanishi, and T.Hashi, Opt. Commun.
21, 139(1977).
4R. M.Shelby and R.M. Macfarlane, Opt. Commun. 27,
399(1978).
5L.E.Erickson, Phys. Rev. B16,4731 (1977),
I. D.Abella, N. A.Kurnitt, and S.R.Hartmann, Phys.
Rev. 141,391(1966).
R.G.De Voe, A. Szabo, S.C.Rand, and R.G.Brewer, Phys. Rev. Lett. 42, 1560(1979).
8A. Szabo, Phys. Rev.B11,4512(1975);A.Szabo, IEEE
J.
Quantum Electron. QE-10,747 (1974).
A. Gorokhovski, R. K.Kaarli, and L.A. Rebane, JETP
Lett, 20, 216(1974).
' H. de Vries and D. A.Wiersrna, Phys. Rev. Lett. 36,91
(1976).
"R.
M. Macfarlane and R. M.Shelby, Phys. Rev, Lett. 42,788 (1979).
A. Szabo, US Patent 3,896,420, Frequency selective optical
r?re???o?y, 1975;G,Castro, D.Haarer, R.M, Macfarlane,
and H. D.Trommsdorff, US Patent 4,101,976,Fiequency selective optical data storage syste???, 1978. Seealso Laser Focus 14, 30(1978).
' M.G.Cohen and N. Bloembergen, Phys. Rev, 135,A950 (1964).
C.A. Bates, A. Gavaix, P.Steggles, A. Vasson, and A-M Vasson,
J.
Phys, C8, 2300(1975),' K.
J.
Standley and R.A. Vaughan, Phys. Rev. 139,A1275 (1965).P,F.Liaoand S, R, Hartmann, Opt. Commun, 8, 310
(1973).
' L.Q. Lambert, Phys. Rev. B7, 1834(1973). A. Szabo,
J.
Appl. Phys. 46,802 (1975).D.S.Hamilton, D.Herman, J~ Feinberg, and R.W.
Hellwarth, Opt. Lett. 4, 124(1979).
P.F.Liao, L.M. Humphrey, D.M. Bloom, and S. Geschwind (unpublished).
R.Orbach and H.
J.
Stapleton, in Elec'tron Para???al;??etic'Resonance, edited by S~Geschwind (Plenum, New York,
1972),p. 121.
A. Misu,
J.
Phys. Soc.Jpn. 44, 1161(1978),R.A.Lees, W.S.Moore, and K.J.Standley, Proc.Phys.
Soc.London 91,105(1967).
R. L.Khyl and B. D.Nageswara-Rao, Phys, Rev. 158,284 (1967).
V.A. Atsarkin, Sov.Phys. Solid State 17,1582(1975). S.Geschwind, G.E, Devlin, R. L.Cohen, and S. R.
Chinn, Phys. Rev. 137,1087(1967).
D.E.McCumber and M.D.Sturge, J.Appl. Phys. 34,
1682(1963).
N. A. Kurnitt, I.D.Abella, and S.R.Hartmann, in Physics ofQua??tu??? Electro??ics, edited by P.L,Kelly, B. Lax,and
P.E.Tannenwald (McGraw-Hill, New York, 1966),p.
267.
D.Grischkowsky and S. R. Hartmann, Phys. Rev. B 2,60
(1970).
R.M. Shelby, C.S.Yannoni, and R.M.Macfarlane, Phys. Rev. Lett. 41, 1739(1978).
A. Compaan, Phys. Rev. B5,4450(1972).
P.F.Liao,P.Ho, R.Leigh, and S.R.Hartmann, Phys.
Rev. A 9,332(1974).
R.F.Wenzel, Phys. Rev. B1, 3109(1970).
K.
J.
Standley and R.A. Vaughan, Electron Spi??RelaxationPI?e??on?ena i??Solids (Hilger, London, 1969). S.K, Lyo, Phys. Rev, B3, 3331(1971).
J.
Koo, L. R.Walker, and S.Geschwind, Phys. Rev. Lett. 35, 1669(1975),P.M. Seltzer, D. L.Huber, B.B.Barnett, and W. M. Yen, Phys. Rev. B17, 4979(1978).