HAL Id: hal-00299438
https://hal.archives-ouvertes.fr/hal-00299438
Submitted on 21 Jun 2007
HAL is a multi-disciplinary open access
archive for the deposit and dissemination of
sci-entific research documents, whether they are
pub-lished or not. The documents may come from
teaching and research institutions in France or
abroad, or from public or private research centers.
L’archive ouverte pluridisciplinaire HAL, est
destinée au dépôt et à la diffusion de documents
scientifiques de niveau recherche, publiés ou non,
émanant des établissements d’enseignement et de
recherche français ou étrangers, des laboratoires
publics ou privés.
Decrease in the electric intensity of VLF/LF radio
signals and possible connections
P. F. Biagi, L. Castellana, T. Maggipinto, G. Maggipinto, A. Minafra, A.
Ermini, V. Capozzi, G. Perna, M. Solovieva, A. Rozhnoi, et al.
To cite this version:
P. F. Biagi, L. Castellana, T. Maggipinto, G. Maggipinto, A. Minafra, et al.. Decrease in the electric
intensity of VLF/LF radio signals and possible connections. Natural Hazards and Earth System
Science, Copernicus Publications on behalf of the European Geosciences Union, 2007, 7 (3),
pp.423-430. �hal-00299438�
www.nat-hazards-earth-syst-sci.net/7/423/2007/ © Author(s) 2007. This work is licensed under a Creative Commons License.
and Earth
System Sciences
Decrease in the electric intensity of VLF/LF radio signals and
possible connections
P. F. Biagi1,2, L. Castellana1, T. Maggipinto1, G. Maggipinto1, A. Minafra1, A. Ermini3, V. Capozzi4, G. Perna4, M. Solovieva5, A. Rozhnoi5, O. A. Molchanov5, and M. Hayakawa6
1Department of Physics, University of Bari, Via Amendola 173, 70126 Bari, Italy
2Inter-Department Centre for the Evaluation and Mitigation of the Volcanic and Seismic Risk, University of Bari, Italy 3Department of Engineering of Enterprise, University of Roma Tor Vergata, Via di Tor Vergata, 00133 Rome, Italy 4Department of Biomedical Sciences, University of Foggia, Via L. Pinto, 71100 Foggia, Italy
5United Institute of the Earth’s Physics, Russian Academy of Science, Bolshaya Gruzinskaya 10, 123995 Moscow, Russia 6Department of Electronic Engineering, The University of Electro-Communications, 1-5-1 Chofugaoka, Chofu City, Tokyo
182-8585, Japan
Received: 14 May 2007 – Revised: 4 June 2007 – Accepted: 7 June 2007 – Published: 21 June 2007
Abstract. In February 2002, a receiver was put into
op-eration at the Department of Physics of Bari University (Southern Italy) to record VLF-LF radio signals. The in-tensity and the phase of the signals transmitted by GB (f =16 kHz, United Kingdom), FR (f =20.9 kHz, France), GE (f =23.4 kHz, Germany), IC (f =37.5 kHz, Island) and IT (f =54 kHz, Sicily, Italy) has been monitored with a 5 s sampling rate. The intensity raw data averaged over 10 min, from February 2002 to April 2006, have been analysed. Sev-eral decreases of the electric field intensity of the radio sig-nals with a duration of some days were revealed, generally occurring in not concomitant periods. The GE signal de-creases systematically in winter and summer each year and so, it could be supposed that such decreases are related to the transmitter. On the contrary, all the other decreases pointed out are sporadic and the previous justification does not seem realistic. On the time occurrence of these decreases, the ge-omagnetic activity, the meteorological conditions in the re-ceiver area and the regional seismic activity were investi-gated. The main result is that, generally, a pre or post seismic effect seems to give the most convincing justification. The ef-fect seems to appear for earthquakes with magnitude M≥4.3, when the epicentres are within the third Fresnel zone of the radio signals or near enough to some radio path.
Correspondence to: P. F. Biagi
1 Introduction
For many years research into the interaction between seismic activity and disturbances in radiobroadcasts has been carried out. One of the first results was obtained using 18 MHz re-ceivers on the occasion of the great (M=8.5) Chilean earth-quake of 22 May 1960 (Warwick et al., 1982). The receivers were part of a network used for studying cosmic noise. Later, pre-seismic disturbances in VLF (3–30 kHz) – LF (low band, 30–60 kHz) radio signals, revealed by ground based mea-surements, have been presented by Japanese and Russian re-searchers (Hayakawa and Sato, 1994; Hayakawa et al., 1996; Hayakawa et al., 2002; Hayakawa et al., 2006; Molchanov and Hayakawa, 1998; Rozhnoi et al., 2005; Rozhnoi et al., 2006). Morover, pre-seismic disturbances on LF (high band, 150–250 kHz) radio broadcasts pointed out by ground re-ceivers were proposed by Italian researchers (Biagi et al., 2001a, b; Biagi and Hayakawa, 2002; Biagi et al., 2005; Biagi et al., 2006). VLF-LF (low band) radio signals ra-diated by powerful transmitters located on the ground can be received not only by ground receivers but also on board of satellites. Recently, some possible seismic disturbances revealed by VLF radio signals measured on board of the French DEMETER satellite, were presented by Molchanov et al. (2006).
2 Equipment and data collecting
On February 2002, in the framework of a scientific coop-eration among Japanese, Russian and Italian teams, a re-ceiver able to measure the electric field strength (intensity)
424 P. F. Biagi et al.: VLF/LF radio anomalies and seismic activity
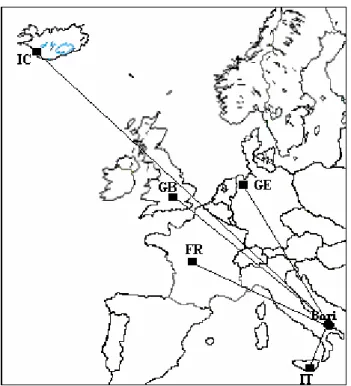
Fig. 1. Map showing the location of the receiver (Bari) and of the VLF/LF transmitters: GB (f =16 kHz, United King-dom), FR (f =20.9 kHz, France), GE (f =23.4 kHz, Germany), IC (f =37.5 kHz, Iceland) and IT (f =54 kHz, Sicily, Italy). The differ-ent radio-paths are indicated.
and the phase of five VLF-LF (low band) radio signals was put into operation at Bari (South Italy). The receiver is the Japanese OmniPAL model connected to a computer by a digital card and it is located in the Department of Physics of Bari University. The electric antenna and the GPS sen-sor are installed on the roof of the building. On the ba-sis of the best reception at the receiver and taking into ac-count the most convenient radio paths in relation to the seis-mic activity, the following transmitters were selected: GB (f =16 kHz, United Kingdom), FR (f =20.9 kHz, France), GE (f =23.4 kHz, Germany), IC (f =37.5 kHz, Iceland) and IT (f =54 kHz, Sicily, Italy). The transmitters-receiver dis-tance ranges from 500 km to 3500 km. Figure 1 shows the location of the VLF-LF transmitters and of the receiver. A 5 s sampling rate was selected. Well-blended data are available up to April 2006 when the antenna was broken by the wind and several months were necessary to restart the equipment. Here an analysis of the intensity data of the five radio signals collected from February 2002 to April 2006 is presented.
3 Data analysis
In order to manage the huge amount of data (at 5 s sampling rate) we analysed the time series of 10 min means (one da-tum each 10 min averaged between the raw data 5 min before
and 5 min after the datum). Figure 2a shows the raw data (bottom) and the averaged data (top) related to the GE trans-mitter during October 2005. The radio signals show standard features with high intensity value at night time and low one at day time. It can be observed that the averaging procedure does not affect the main features of the signal. The relative trends of the five radio signals were analysed to search for irregularities. The main result of this analysis was the find-ing of several decreases in the intensity of the radio signals with a duration of some days. This phenomenology stood up clearly by examining the trends smoothed by a running ad-jacent averaging over 5 days. As an example the Fig. 2b, at the bottom, shows the smoothed trend of the GE radio sig-nal. Many clear decreases of the signal intensity appear, but it is evident that in many cases the effect is a periodic one, i.e. in December–January and in June–July. It is reasonable to assume that these decreases are not connected with natu-ral phenomena but with systematic reductions of the radiated power by the transmitter. So, these decreases were not con-sidered in our analysis and the trend at the top of the Fig. 2b represents the effective trend of the GE signal that we have examined. All the other decreases pointed out in the various radio signals are sporadic and have been considered. Gener-ally, their occurrence is in not concomitant periods.
In the past, some influence of the geomagnetic activity and of the meteorological conditions on the propagation of the VLF-LF radio signals has been presented (Kikuchi, 1981; Kleimenova et al., 2004; Rozhnoi et al., 2006b). Then, pos-sible effects of the seismic activity occurred in the area of the radio paths were pointed out (Hayakawa et al., 1996; Molchanov and Hayakawa, 1998; Rozhnoi et al., 2005; Rozhnoi et al., 2006a).
So, in order to give explanation of the previous decreases of the radio signals intensity, for each case the geomagnetic activity, the meteorological conditions in the receiver area and the seismic activity was investigated. For the geomag-netic activity the indexes Kp and Dst were considered; for
the meteorological conditions the data of stations located in Bari were used and the air temperature, pressure and wind velocity were considered as the most indicative parameters (Rozhnoi et al., 2006b); for the seismic activity the earth-quakes with M>4.0 which occurred within the third Fres-nel zone of each radio signal were considered. The quoted zone is considered to be the most sensitive to the seismo-atmospheric effects (Hayakawa et al., 1996; Molchanov and Hayakawa, 1998; Rozhnoi et al., 2005).
4 Results
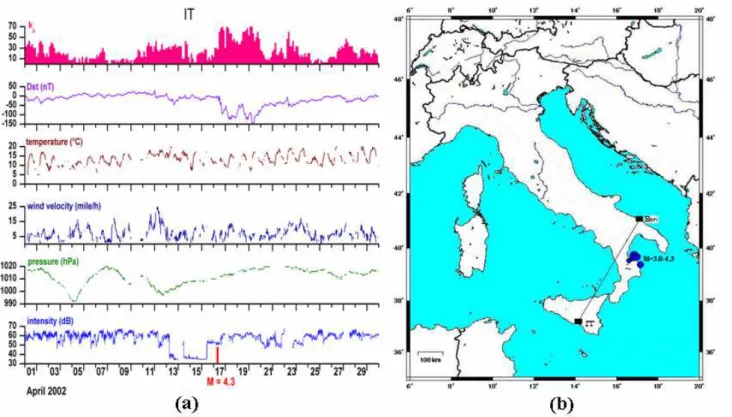
Figure 3a shows the data measured during April 2002, when a substantial decrease was observed in the IT radio signal. On 17 April 2002 three earthquakes with M=3.0–4.3 occurred in the gulf of Taranto and an aftershock (M=3.4) occurred on 27 April. The epicentres are shown in the Fig. 3b.
Fig. 2. (a) At the bottom, raw data on time series of the intensity of GE radio signal collected during October 2005. The trend at the top is the averaged 10 minutes time series. (b) The trend at the bottom is the averaged 10 min time series of the raw intensity of GE radio signal, smoothed by a running adjacent averaging over 5 days. At the top the same trend, where the systematic decreases in December–January and June–July are removed, is shown.
Fig. 3. (a) During April 2002, from the top reading downwards: kp geomagnetic index, Dst geomagnetic index, air temperature, wind velocity, pressure and the averaged 10 min intensity of IT radio signal. The red line indicates the time occurrence of the main (M=4.3) earthquake of the gulf of Taranto. (b) Map showing the location of the earthquakes occurred in the gulf of Taranto during April 2002. The IT radio path is indicated.
426 P. F. Biagi et al.: VLF/LF radio anomalies and seismic activity
Fig. 4. (a) During December 2003–January 2004, from the top reading downwards: kp geomagnetic index, Dst geomagnetic index, air temperature, wind velocity, pressure and the averaged 10 minutes intensity of the GB radio signal. The red line indicates the time occurrence of the main (M=4.3) earthquake of the southern Apennines sequence. (b) Map showing the location of the earthquakes occurred in the southern Apennines at the end of December 2003. The GB radio path is indicated.
Fig. 5. (a) In the period 6 February–20 March 2004, from the top reading downwards: kpgeomagnetic index, Dst geomagnetic index, air temperature, wind velocity, pressure and the averaged 10 minutes intensity of FR and IT radio signals. The red line indicates the time occurrence of the earthquake (M=4.6) happened near the west coast of the Calabria region. (b) Map showing the location of the quoted earthquake occurred on 3 March 2004. The FR and IT radio paths are indicated.
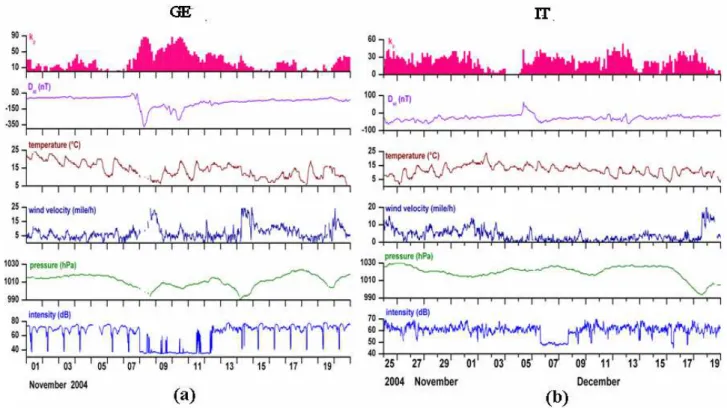
Fig. 6. (a) In the period 1–20 November 2004, from the top reading downwards: kp geomagnetic index, Dst geomagnetic index, air temperature, wind velocity, pressure and the averaged 10 min intensity of GE radio signal. (b) In the period 25 November–19 December 2004 the same of the Fig. 6a related to the IT radio signal.
Figure 4a shows the data measured during December 2003–January 2004, when a decrease was pointed out in the GB radio signal. On 30 December 2003 nine earthquakes with M=2.1–4.3 occurred in short sequence in the southern Apennines and two foreshocks (M=3.1) occurred on 28 De-cember. The epicentres are shown in the Fig. 4b.
Figure 5a shows the data measured during 16 February– 20 March 2004. Decreases appear in both IT and FR radio signals. At 3 March an earthquake with M=4.6 occurred near the west coast of the Calabria region, as it is shown in the Fig. 5b. In the same figure the IT and FR radio paths are indicated. As it concerns the FR radio signal it must be noted that the epicentre is out the third Fresnel zone.
Figure 6a shows the data measured during 8–12 Novem-ber 2004. The decrease appearing in the intensity of the GE radio signal is the alone still present after removing the peri-odic ones (Fig. 2b). We haven’t found any reason to remove also this decrease because related to the transmitter. During this period, the seismic activity was not very intense within the third Fresnel zone or, more generally, within the radio path zone. The Fig. 6b shows the data measured during 6–8 December 2004, when a decrease was revealed in the IT in-tensity. Also in this case no significant earthquake occurred. The most recent decrease was observed in the IC radio sig-nal, as it appears in the Fig. 7a where the data measured dur-ing August-September 2005 are shown. On August 22 an
earthquake with M=4.7 occurred at the Latium coast and on 8 September, an earthquakes with M=4.4 happened near the north-west border of Italy; these epicentres and the radio path are shown in the Fig. 7b. It must be noted that the epicentre of the earthquake at the Latium coast is out the third Fresnel zone of the radio path, but it was considered due to the strict connection of its location with the IC radio path represented by a well known tectonic line (called Anzio-Ancona) in cen-tral Italy. This line is indicated in red colour in the Fig. 7b.
5 Discussion
On the basis of the figures showed in the previous sections, it is possible to identify connections between the radio de-creases and different kind of phenomenology that could be responsible of these anomalies. The most indicative causes of perturbation in the radio signal seem to be the seismic and the geomagnetic activity, and some meteorological dis-turbances. Anyway, if a correlation is claimed between the radio decreases and the geomagnetic or meteorological vari-ations, they must happen contemporary; on the contrary, a temporal shift is reasonable if a correlation between the ra-dio anomaly and the seismic activity is considered, so that both preseismic and postseismic effects can be revealed.
That being stated, looking at the figures, it is possible to note that there is an only case of clear connection between a
428 P. F. Biagi et al.: VLF/LF radio anomalies and seismic activity
Fig. 7. (a) During August–September 2005, from the top reading downwards: kpgeomagnetic index, Dst geomagnetic index, air temper-ature, wind velocity, pressure and the averaged 10 min intensity of the IC radio signal. The red lines indicate the time occurrence of the earthquake (M=4.7) happened at the Latium coast and of the earthquake (M=4.4) occurred near the north-west border of Italy. (b) Map showing the location of the quoted earthquakes and a part of the IC radio path. The red dotted line roughly represents the tectonic line Anzio-Ancona.
radio decrease and a contemporary increase in the geomag-netic activity, as shown in Fig. 6a, where the GE signal is presented. Instead, no clear correlation appears if we take into consideration radio decreases and variations in meteoro-logical parameters, due to the shift in time, always existing in all the cases presented, between the two events.
Now, we can discuss the connection between radio signal disturbances and seismic activity.
Figure 3a shows an intensity decrease in the IT radio sig-nal, lasting about 4 days and its connection with the earth-quakes happened in the gulf of Taranto, indicated in the Fig. 3b, seems convincing. So, a radio precursor with a duration of three-four days is revealed. In the same way, the intensity decrease in the GB radio signal presented in the Fig. 4a can be connected with the earthquakes (south-ern Apennines) shown in the Fig. 4b, so that it appears as a precursor with a duration of about seven days. In this case also a post seismic effect with a similar duration (Fig. 4a) can be claimed. The situation presented in the Fig. 5a shows two different decreases in the FR and in the IT radio signals. The connection of the IT decrease with the earthquake (M=4.6) happened at the west coast of the Calabria region seems re-alistic. In such a case a postseismic effect with a duration of 9–10 days can be claimed. On the other hand, the con-nection of the FR decrease with the same earthquake is more
doubtful, due to the location of the epicentre with respect to the FR radio path, but it could be considered and in this case it becomes a possible precursor with a duration of 10 days. Finally, a decrease of the IC signal is presented in the Fig. 7a. The connection with the earthquake (M=4.4) that happened near the north-west border of Italy is convincing and probably also a connection with the earthquake (M=4.7) occurred at the Latium coast can be claimed. In fact, the well known tectonic line Anzio-Ancona connects the location of this epicentre with the radio path as we noted in the previ-ous section. So, probably, two different anomalies exist on the IC radio signal and they represent two precursors with a duration of 8–12 days. It is possible to note that, in this case, also the geomagnetic activity increases during the oc-currence of the radio anomaly but with a shorter duration, so that some minor effects connected with this phenomenology can be claimed.
In the Fig. 6b a decrease of the IT radio signal is presented and this is the only case where no possible relations with any parameter has been found out; also the seismic activity inside and outside the relative Fresnel zone was extremely moderate.
So, during the period of the measurements, eight decreases of the intensity of VLF-LF radio signals were revealed. In six cases the connection with the seismicity seems the most
convincing cause, with some doubt concerning the FR de-crease in Fig. 5a; in one case the connection with the geo-magnetic activity is evident. Only in one case no connection was revealed. The “seismic cases” reveal precursors for five times and for one time only a postseismic effect.
In order to support the “seismic cases”, it must be noted that the events reported in the Fig. 5 and in the Fig. 7 were the largest earthquakes occurred within a radius of 100 km, during the whole period of the radio signals monitoring: therefore, they represent rare events. Unfortunately, a phe-nomenology very similar to the seismic sequence reported in the Fig. 3 happened after the failure of the antenna, in April 2006, so, a possibility of comparison was impossible, as well for the other (in addition to that shown in the Fig. 4) large earthquake (M=5.4, 31 October 2002), within a radius of 100 km, that happened in a period when the data were not collected, due to maintenance of the location where the re-ceiving antenna is located (Biagi et al., 2004).
As it concerns the theoretical justification of the decreases of the radio signals intensity in connection with the seismic-ity, a possible model based on the acoustic gravity waves and the ionosphere turbulence was proposed by Molchanov et al. (2006).
6 Conclusions
A good possibility exists that the earthquakes with M≥4.3 can produce some decrease in the intensity of the VLF-LF radio signals, when the path is near enough to the epicentres. The decreases can represent a preseismic effect or a postseis-mic one.
The systematic measurement of the intensities of differ-ent VLF-LF radio signals in several points could increase the definition of the effect.
So, the starting up of networks for monitoring VLF-LF radio signals is hoped for.
Acknowledgements. This research was conducted in the framework
of: a) the Cooperation Agreement between the University of Bari (Italy) and the Institute of the Earth’s Physics, Russian Academy of Sciences; b) the Cooperative Program 12B1 of the Italian Ministry of the Foreign Affair between Italy and Japan.
The seismic data used in this paper were extracted by the INGV (Istituto Nazionale di Geofisica e Vulcanologia) web site http:// www.ingv.it. The geomagnetic data were obtained by web site: http://www.ngdc.noaa.gov, Geomagnetism Home, National Geo-physical Data Center.
The authors are very grateful to L. Telesca and C-V. Meister for their helpful suggestions to increase the paper.
Edited by: M. Contadakis
Reviewed by: L. Telesca and C.-V. Meister
References
Biagi, P. F., Piccolo, R., Ermini, A., Martellucci, S., Bellecci, C., Hayakawa, M., Capozzi, V., and Kingsley, S. P.: Possible earth-quake precursors revealed by LF radio signals, Nat. Hazards Earth Syst. Sci., 1, 1–2, 2001a.
Biagi, P. F., Piccolo, R., Ermini, A., Martellucci, S., Bellocci, C., Hayakawa, M., and Kingsley, S. P.: Disturbances in LF radio-signals as seismic precursors, Annali di Geofisica, 44, 5/6, 2001b.
Biagi, P. F. and Hayakawa, M.: Possible premonitory behaviour of LF radiowaves on the occasion of the Slovenia earthquakes (M=5.2-6.0-5.1) occurred on March–May 1998, in: Seismo Electromagnetics: Lithosphere-Atmosphere-Ionosphere Cou-pling, edited by: Hayakawa, M. and Molchanov, O., TERRA-PUB, Tokyo, 249–253, 2002.
Biagi, P. F., Piccolo, R., Castellana, L., Maggipinto, T., Ermini, A., Martellucci, S., Bellecci, C., Perna, G., Capozzi, V., Molchanov, O., Hayakawa, M., and Ohta, K.: VLF-LF radio signals collected at Bari (South Italy): a preliminary analysis on signal anoma-lies associated with earhquakes, Nat. Hazards Earth Syst. Sci., 4, 685–689, 2004,
http://www.nat-hazards-earth-syst-sci.net/4/685/2004/.
Biagi, P. F., Castellana, L., Maggipinto, T., Piccolo, R., Minafra, A., Ermini, A., Martellucci, S., Bellecci, C., Perna, G., Capozzi, V., Molchanov, O. A., and Hayakawa, M.: A possible preseismic anomaly in the ground wave of a radio broadcasting (216 kHz) during July–August 1998 (Italy), Nat. Hazards Earth Syst. Sci., 5, 727–732, 2005,
http://www.nat-hazards-earth-syst-sci.net/5/727/2005/.
Biagi, P. F., Castellana, L., Maggipinto, T., Piccolo, R., Minafra, A., Ermini, A., Martellucci, S., Bellecci, C., Perna, G., Capozzi, V., Molchanov, O. A., and Hayakawa, M.: LF radio anomalies revealed in Italy by the wavelet analysis: Possibile preseismic ef-fects during 1997–1998, Phys. Chem. Earth, 31, 403–408, 2006. Hayakawa, M. and Sato, H.: Ionospheric perturbations associated with earthquakes, as detected by subionospheric VLF propaga-tion, in: Electromagnetic Phenomena Related to Earthquake Pre-diction, edited by: Hayakawa, M. and Fujinawa, Y., TERRA-PUB, Tokyo, 391–397, 1994.
Hayakawa, M., Molchanov, O. A., Ondoh, T., and Kawai, E.: The precursory signature effect of the Kobe earthquake on subiono-spheric VLF signals, J. Comm. Res. Lab., 43, 169–180, 1996. Hayakawa, M., Ohta, K., Maekawa, S., Yamauchi, T., Ida, Y.,
Go-toh, T., Yonaiguchi, N., Sasaki, H., and Nakamura, T.: Electro-magnetic precursors to the 2004 Mid Niigata Prefecture earth-quake, Phys. Chem. Earth, 31, 356–364, 2006.
Kikuchi, T.: VLF phase anomalies associated with substorm, Mem. Nat. Inst. Polar. Res. (Special Issue), 18, 3–23, 1981.
Kleimenova, N. G., Kozyreva, O. V., Rozhnoi, A. A., and Solovieva, M. S., Variation in the vLF signal parameters on the Australia-Kamchatka radio path during magnetic storms, Geomagnet. Aeronomy, 44, 3, 354–361, 2004.
Molchanov, O. A. and Hayakawa, M.: Subionospheric VLF signal perturbations possibly related to earthquakes, J. Geophys. Res., 103, 17 489–17 504, 1998.
Molchanov, O. A., Rozhnoi, A., Solovieva, M., Akentieva, O., Berthelier, J. J., Parrot, M., Lefeuvre, F., Biagi, P. F., Castellana, L., and Hayakawa, M.: Global diagnostic of the ionospheric per-turbations related to the seismic activity using the VLF
radio-430 P. F. Biagi et al.: VLF/LF radio anomalies and seismic activity
signals collected on the DEMETER satellite, Nat. Hazards Earth Syst. Sci., 6, 745–753, 2006,
http://www.nat-hazards-earth-syst-sci.net/6/745/2006/.
Rozhnoi, A. A., Solovieva, M. S., Molchanov, O. A., Hayakawa, M., Maekawa, S., and Biagi, P. F.: Anomalies of LF signal dur-ing seismic activity in November–December 2004, Nat. Hazards Earth Syst. Sci., 5, 657–660, 2005,
http://www.nat-hazards-earth-syst-sci.net/5/657/2005/.
Rozhnoi, A. A., Solovieva, M. S., Molchanov, O. A., Chebrov, V., Voropaev, V., Hayakawa, M., Maekawa, S., and Biagi, P. F.: Pre-seismic anomaly of LF signal on the wave path Japan-Kamchatka during November 2004, Phys. Chem. Earth, 31, 422–427, 2006a.
Rozhnoi, A., Solovieva, M. S., Molchanov, O. A., Hayakawa, M., Maekawa, S., and Biagi, P. F.: Sensitivity of LF signal to global ionosphere and atmosphere perturbations in the network of sta-tions, Phys. Chem. Earth, 31, 409–415, 2006b.
Warwick, J. W., Stoker, C., and Meyer, T. R.: Radio emission as-sociated with rock fracture: possible application for the Great Chilean Earthquake of 22 May 1960, J. Geophys. Res, 87, 2851– 2859, 1982.