HAL Id: tel-03251320
https://tel.archives-ouvertes.fr/tel-03251320
Submitted on 7 Jun 2021HAL is a multi-disciplinary open access
archive for the deposit and dissemination of sci-entific research documents, whether they are pub-lished or not. The documents may come from teaching and research institutions in France or abroad, or from public or private research centers.
L’archive ouverte pluridisciplinaire HAL, est destinée au dépôt et à la diffusion de documents scientifiques de niveau recherche, publiés ou non, émanant des établissements d’enseignement et de recherche français ou étrangers, des laboratoires publics ou privés.
Disease
Maximilian Mc Cluskey
To cite this version:
Maximilian Mc Cluskey. Study of vesicular glycolysis in health and Huntington’s Disease. Neurons and Cognition [q-bio.NC]. Université Grenoble Alpes [2020-..], 2021. English. �NNT : 2021GRALV006�. �tel-03251320�
1 Pour obtenir le grade de
DOCTEUR DE L’UNIVERSITE GRENOBLE ALPES
Spécialité : Neurosciences, NeurobiologieArrêté ministériel : 25 mai 2016
Présentée par
Maximilian Mc CLUSKEY
Thèse dirigée par Frédéric SAUDOU et co-encadrée par Anne-Sophie NICOT
préparée au sein du Grenoble Institut des Neurosciences dans l'École Doctorale de Chimie et Sciences du Vivant
Study of vesicular glycolysis in health
and Huntington’s disease
Thèse soutenue publiquement le 04/02/2021, devant le jury composé de :
Mr, Frédéric, DARIOS
Chargé de recherche INSERM, Institut du Cerveau, rapporteur
Mme, Carine, POURIÉ
Professeure des universités, Université de Lorraine, rapporteuse
Mr, Hervé, DUBOUCHAUD
Professeur des Universités, Université Grenoble Alpes, examinateur
Mme, Isabelle, ARNAL
Directrice de recherche CNRS, Grenoble Institut des Neurosciences, présidente
Mr, Frédéric, SAUDOU
Professeur des universités - Practicien hospitalier, Grenoble Institut des Neurosciences, directeur de thèse, Invité
Mme, Anne-Sophie, NICOT
Maitre de conférence des universités, Grenoble Institut des Neurosciences, co-encadrante, Invité
3
ACKNOWLEDGEMENTS
I would first like to thank the members of my jury, Dr. Frédéric Darios, Pr. Carine Bossenmeyer-Pourié, Pr. Hervé Dubouchaud and Dr. Isabelle Arnal. Your time spent reading, commenting and discussing this work has been highly appreciated.
I would also like to thank my PhD supervisor, Pr. Frédéric Saudou, and co-supervisor, Dr. Anne-Sophie Nicot, for their guidance and trust in my abilities, that has been instrumental in rendering this work possible.
I would finally like to thank all members of the team that contributed in some way to this work and made my time at the Grenoble Institute of Neuroscience that much more meaningful.
4
Contents
I. ABSTRACT ... 8
II. RÉSUMÉ ... 10
III. ABBREVIATIONS ... 12
IV. LIST OF FIGURES ... 15
V. INTRODUCTION ... 16
A. Chapter 1: Huntington’s disease ... 16
1. General description of Huntington’s disease ... 16
a) Discovery & history of Huntington’s disease ... 16
b) Prevalence, statistics & heritability of Huntington’s disease in humans ... 16
c) Symptoms ... 19
(1) Motor ... 19
(2) Cognitive ... 19
(3) Psychiatric ... 20
(4) Other symptoms ... 21
2. Animal models of Huntington’s disease ... 22
a) Mouse models ... 22
b) Other models ... 23
3. Neurodegeneration and cellular dysfunction ... 24
a) Neurodegeneration ... 24
b) Cellular features and dysfunctions ... 26
(1) Inclusion bodies... 26 (2) Cortico-striatal imbalance ... 26 (3) Axonal transport ... 28 (4) Energy metabolism ... 29 (5) Synaptic transmission ... 30 (6) Glia ... 31 (7) Other dysfunctions ... 33
4. Treating Huntington’s disease ... 34
a) Symptomatic treatment ... 34
b) Genetic therapy ... 34
c) Non-genetic therapy ... 36
B. Chapter 2: Huntingtin protein and function ... 38
1. From huntingtin gene to huntingtin protein ... 38
a) The huntingtin gene and transcription ... 38
5
c) HTT protein structure ... 39
d) HTT interactors ... 41
e) HTT proteolysis ... 41
2. Huntingtin post-translational modifications ... 42
a) Acetylation ... 42
b) SUMOylation and ubiquitination ... 43
c) Phosphorylation ... 43
d) Palmitoylation and methylation ... 44
3. Huntingtin functions ... 45 a) Axonal transport... 45 b) Endocytosis ... 46 c) Ciliogenesis ... 47 d) Cell division ... 47 e) Protein degradation ... 47 f) Transcription ... 48
C. Chapter 3: Axonal transport ... 49
1. Basics of axonal transport ... 49
a) General description of axonal transport ... 49
b) Molecular motors ... 50
c) Axonal cargo dynamics and motors ... 53
(1) Fast axonal transport ... 53
(2) Slow axonal transport ... 56
2. Regulating and powering axonal transport ... 57
a) Regulation mechanisms of axonal transport ... 57
b) Energy for transport ... 59
3. Visualizing transport in vitro and in vivo ... 61
a) In vitro methods for visualizing transport ... 61
b) In vivo methods for visualizing transport ... 62
4. Axonal transport in neurodegenerative diseases ... 62
a) Amyotrophic Lateral Sclerosis ... 63
b) Alzheimer’s disease ... 63
c) Parkinson’s disease ... 64
d) Charcot-Marie-Tooth disease... 64
e) Spinal bulbar muscular atrophy ... 65
f) Hereditary spastic paraplegia ... 66
6
1. Sources of energy for the brain ... 67
a) Glucose and its byproducts ... 67
b) Ketones ... 69
2. Lactate shuttling between glia and neurons ... 69
3. Energy in neurodegenerative disorders ... 72
a) Huntington’s disease ... 72
b) Alzheimer’s disease ... 73
c) Parkinson’s disease ... 74
E. Chapter 5: Glycolysis and associated pathways ... 75
1. Glucose is broken down through glycolysis ... 75
2. Glycolytic regulation ... 76
3. Pathways associated to glycolysis ... 78
a) The Krebs cycle and oxidative respiration ... 78
b) Lactate dehydrogenase ... 79
c) The pentose phosphate pathway ... 82
d) Gluconeogenesis ... 83
4. Energy channeling ... 84
a) Glycolytic channeling ... 85
(1) Neurotransmitter recycling ... 85
(2) Vesicular transport ... 86
(3) The fibrous sheath in spermatozoa ... 87
(4) Other examples of glycolytic channeling ... 87
b) Non-glycolytic channeling ... 88
(1) Creatine kinase in mitochondria ... 88
(2) The Krebs cycle in mitochondria ... 89
5. Enzymatic activity and glycolytic rate measurement ... 89
a) Enzyme activity ... 89
b) Measuring glycolytic activity ... 91
(1) Glucose and lactate... 91
(2) Regulatory glycolytic steps ... 92
(3) Metabolite tracing ... 93
VI. OUTLINE AND OBJECTIVES ... 94
VII. RESULTS ... 95
1. Part 1: Lactate dehydrogenase and vesicular glycolysis ... 95
2. Part 2: Vesicular glycolysis in Huntington’s disease ... 120
7
b) How are glycolytic enzyme quantities and activities affected on vesicles in
Huntington’s disease? ... 123
c) Can specific stimulation of vesicular glycolysis restore transport in HD? ... 126
VIII. DISCUSSION ... 130
1. Measuring glycolysis on vesicles... 130
2. Lactate dehydrogenase A is expressed in neurons ... 132
3. What is the role of vesicular lactate? ... 132
4. Vesicular transport and the Warburg effect ... 133
5. Vesicles, an isolated autonomous metabolic microenvironment ... 134
6. Enzyme attachment to vesicles ... 136
7. Glycolytic differences in Huntington’s disease ... 137
8. Genetic derivation of HdhCAG140/+ mice ... 139
9. Restoring BDNF transport in HD ... 139
IX. PERSPECTIVES ... 142
1. A novel approach for estimating glycolytic activity ... 142
2. Vesicular metabolism... 142
3. Glycolysis in HD... 143
4. Artificial stimulation of vesicular glycolysis ... 143
X. GENERAL CONCLUSION ... 145
XI. MATERIALS AND METHODS ... 146
8
I. ABSTRACT
The axon enables long distance travel of electrical and chemical information between neurons, a process at the basis of neuronal communication and brain function. This information is transported in part by vesicles. Membrane-bound molecular motors propel these vesicles along the axon’s cytoskeleton by consuming ATP. The lab has shown previously that the ATP required for this transport is produced by on-board glycolytic enzymes, thus creating an energetically autonomous microenvironment for vesicular transport. What is more, the transport of BDNF is significantly reduced in Huntington’s disease (HD), a genetic disease caused by an abnormal CAG repeat expansion in the huntingtin (HTT) gene. This leads to insufficient trophic support of BDNF to the striatum where it plays a crucial role in cell survival. HTT is known to scaffold and mediate molecular motors on vesicles. The objectives of this PhD project were therefore to, design an approach to measure glycolytic activity on vesicles in order to understand the intricacies of glycolytic activity on vesicles as well as to identify the link between vesicular glycolysis and insufficient transport in HD.
To do so, we first wanted to describe the differences in metabolic rates and efficiency between cytosolic and vesicular glycolysis. To measure glycolytic activity, we decided to split the pathway into two segments: the first was determined through the NADH production, the product of GAPDH; and the second segment was measured through the ATP production, produced by PGK and PK. Through these measurements, we found that vesicular glycolysis has a greater affinity for its substrates than the cytosol, making the vesicle more efficient at producing NADH and ATP than cytosolic equivalents.
This then led us to question the importance of NAD+ recycling on vesicles. Here we showed, through immunofluorescence and western blot, that LDH, the enzyme responsible for converting pyruvate into lactate and oxidizing NADH in the process, is a vesicle-bound enzyme. Furthermore, we demonstrated that this LDH-dependent NAD+ recycling is crucial for overall glycolytic activity on vesicles and required for BDNF transport in cultured cortical neurons. Hence, axonal vesicles produce ATP via aerobic glycolysis, similarly to the Warburg effect in certain cancer cells.
Finally, we studied the link between vesicular glycolysis and BDNF transport in HD. We showed that HTT interacts more strongly on vesicles with at least two glycolytic enzymes, GAPDH and PFK, and that glycolytic enzyme quantity and activity on vesicles is affected in HD. Based on these results we used previously described TM-GAPDH to artificially stimulate glycolysis specifically on vesicles to demonstrate that this approach was sufficient to restore
9
transport in vitro. This provides evidence of the importance of vesicular glycolysis in BDNF transport and HD pathogenesis.
KEY WORDS
10
II. RÉSUMÉ
L'axone permet le déplacement électriques et chimiques sur de longues distances d'informations entre les neurones, un processus qui est à la base de la communication neuronale et de la fonction cérébrale. Cette information est transportée en partie par des vésicules. Les moteurs moléculaires liés à la membrane propulsent ces vésicules le long du cytosquelette de l’axone en consommant de l’ATP. Le laboratoire de Frédéric Saudou a montré précédemment que l'ATP nécessaire à ce transport est produit par des enzymes glycolytiques liées à ces membranes, créant ainsi un microenvironnement énergétiquement autonome pour le transport vésiculaire. De plus, le transport de BDNF est considérablement réduit dans la maladie de Huntington (MH), une maladie génétique causée par une expansion anormale de répétition de CAG dans le gène de la huntingtine (HTT). Cela conduit à un support trophique insuffisant du BDNF au striatum où il joue normallement un rôle crucial dans la survie cellulaire. La HTT est connu pour être une protéine d’échaffaudage pour les moteurs moléculaires sur les vésicules. Les objectifs de ce projet étaient donc de concevoir une approche permettant la mesure de l'activité glycolytique sur les vésicules afin de comprendre les subtilités de l'activité glycolytique sur les vésicules ainsi que d'identifier le lien entre glycolyse vésiculaire et transport insuffisant charactéristique de la MH.
Pour ce faire, nous avons d'abord voulu décrire les différences de taux métaboliques et d'efficacité entre la glycolyse cytosolique et vésiculaire. Pour mesurer l'activité glycolytique, nous avons décidé de scinder la voie en deux segments: le premier a été déterminé par la production de NADH, le produit de GAPDH; et le deuxième segment a été mesuré par la production d'ATP, produite par PGK et PK. Grâce à ces mesures, nous avons constaté que la glycolyse vésiculaire a une plus grande affinité pour ses substrats que le cytosol, ce qui rend la vésicule plus efficace pour produire du NADH et de l'ATP que ses équivalents cytosoliques.
Cela nous a alors conduit à nous interroger sur l'importance du recyclage de NAD+ sur les vésicules. Ici, nous avons montré, par immunofluorescence et western blot, que la LDH, enzyme responsable de la conversion du pyruvate en lactate et de l'oxydation du NADH, est également liée aux vésicules. En outre, nous avons démontré que ce recyclage NAD-dépendant de la LDH est crucial pour l'activité glycolytique globale sur les vésicules et requis pour le transport du BDNF dans des neurones corticaux en culture. Par conséquent, les vésicules axonales produisent de l'ATP par glycolyse aérobie, de manière similaire à l'effet Warburg décrit dans les cellules cancéreuses.
11
Enfin, nous avons étudié le lien entre la glycolyse vésiculaire et le transport de BDNF dans la MH. Nous avons montré que le HTT interagit plus fortement sur les vésicules avec au moins deux enzymes glycolytiques, GAPDH et PFK, et que la quantité et l'activité de l'enzyme glycolytique sur les vésicules sont affectées dans la MH. Sur la base de ces résultats, nous avons utilisé la construction TM-GAPDH décrite précédemment pour stimuler artificiellement la glycolyse spécifiquement sur les vésicules ce qui nous a permis de démontrer que cette approche était suffisante pour restaurer le transport in vitro. Ceci est une preuve de l'importance de la glycolyse vésiculaire dans le transport du BDNF et la pathogenèse de la MH.
MOTS CLÉS
Glycolyse vésiculaire, maladie de Huntington, lactate déshydrogénase, transport axonal, huntingtine
12 III. ABBREVIATIONS ∆G: free-energy difference 2-DG: 2-deoxyglucose 3BHM: 3-β-hydroxybutyrate 6-PGDH: 6-phosphogluconate dehydrogenase 6PGL: 6-phosphogluconolactonase
AAV: adeno-associated virus AD: Alzheimer's disease ADP: adenosine diphosphate AMP: adenosine monophosphate
AMPA: α-amino-3-hydroxy-5-methyl-4-isoxazolepropionic acid ANLS: astrocyte-neuron lactate shuttle
AR: androgen receptor protein ASO: antisense oligonucleotide AST: alanine aminotransferase Atg: autophagy related protein ATP: Adenosine triphosphate Aβ: amyloid beta
BACHD: Bacterial Artificial Chromosome transgenic model BDNF: Brain Derived Neurotrophic Factor
BMI: Body Mass Index bp: base pairs
CBP: CREB-binding protein CK: creatine kinase
IP: immunoprecipitation
CREB: cAMP Response Element
CRISPR: Clustered Regularly Interspaced Short Palindromic Repeats DCV: dense-core vesicles
DNA: Deoxyribonucleic acid Drp: Dynamin-Related Protein
EPSC: excitatory postsynaptic potential ER: Endoplasmic reticulum
ESCRT: endosomal sorting complex required for transport FAD: flavin adenine dinucleotide
FAT: Fast axonal transport FBPase: fructose bisphosphatase
FRET: fluorescence resonance energy transfer G3P: glyceraldehyde-3-phosphate
G6P: glucose-6-phosphate
G6PDH: glucose-6-phosphate dehydrogenase
GAPDH: Glyceraldehyde-3-phosphate dehydrogenase GLT: glutamate transporter
GLUT: glucose transporter Gpe: external Globus Pallidus Gpi: internal Globus Pallidus GPI: phosphoglucose isomerase
GRIK2, also known as GLUR6: Glutamate Receptor Ionotropic Kainate 2 GSH: glutathione
13 HD: Huntington's Disease
HDAC: deacetylated histone deacetylase
HD-CAB: Huntington's Disease Cognitive Assessment Battery
HEAT: HTT (H), elongation factor 3 (E), the regulatory A subunit of protein phosphatase 2A (A) and TOR1 (T)
HK: hexokinase
HSP: Hereditary spastic paraplegia HTT: huntingtin
InsP3R: inositol (1,4,5)-triphosphate receptor KI: knock-in
KIF: kinesin superfamily LDH: Lactate dehydrogenase
LGN: leucine-glycine-asparagine repeat protein MAP: Microtubule Associated Protein
MCT: monocarboxylic transporters
MFN: mitochondrial fusion protein mitofusin mHTT: mutant HTT
MRI: magnetic resonance imaging mRNA: Messenger RNA
MSN: medium spiny neurons
NAD: nicotinamide adenine dinucleotide NMDA: N-methyl-D-aspartate
NMR: nuclear magnetic resonance N-ter: N-terminus
NuMA: Nuclear Mitotic Apparatus protein P: product
PCM1: pericentriolar material 1 protein PD: Parkinson's disease
PDH: pyruvate dehydrogenase PET: Positron emission tomography PFK: phosphofructokinase
PGAM: phosphoglycerate mutase PGK: phosphoglycerate kinase Pi: inorganic phosphate
PK: Pyruvate kinase polyQ: poly-glutamine
PPP: pentose phosphate pathway PRD: proline rich domain
PTM: post-translational modification
REST/NRSF: repressor element-1 transcription factor/neuron restrictive silencer factor RILP: Rab7-interacting lysosomal protein
RNA: Ribonucleic acid RNAi: RNA interference ROS: Reactive oxygen species
RPE: Ribulose 5-phosphate epimerase S: substrate
SAT: Slow axonal transport
SGK: Serum and Glucocorticoid induced Kinase SMBA: spinal bulbar muscular atrophy
14 SNr: Substantia Nigra pars reticulata
SOD: superoxide dismutase TCA: tricarboxylic acid TKL: transketolase
TPI: triose phosphate isomerase
UHDRS: Unified Huntington’s Disease Rating Scale ULK: Unc-51 like autophagy activating kinase UPS: Ubiquitin Proteasome System
VAMP: vesicle-associated membrane protein VAPB: VAMP-associated protein
VMAT: vesicular monoamine transporter YAC: Yeast Artificial Chromosome
15
IV. LIST OF FIGURES
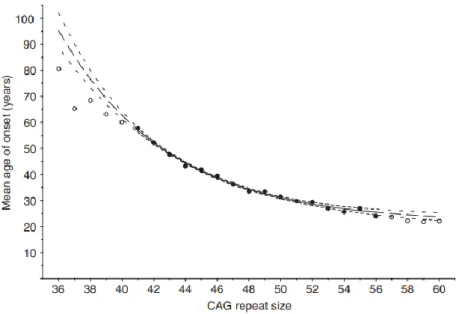
Figure 1: Population estimates of the mean age of onset for CAG repeat lengths 36–60 18
Figure 2: The HD brain degenerates 25
Figure 3: Evolution of medium spiny neuron degeneration 28 Figure 4: Schematic representation of the HTT protein structure and PTM sites 40 Figure 5: HTT interacts with molecular motors and mediates vesicular transport 45
Figure 6: The kinesin superfamily 51
Figure 7: Tug-of-war model of transport 57
Figure 8: Glycolysis provides energy for vesicular transport 60
Figure 9: The neurovascular unit 68
Figure 10: Metabolic differences between astrocytes and neurons 70 Figure 11: Energy transfer between oligodendrocytes and neurons 71
Figure 12: Glycolysis 76
Figure 13: Mitochondrial ATP production 79
Figure 14: Anaerobic glycolysis and NAD+ recycling by lactate dehydrogenase 80
Figure 15: The Pentose Phosphate Pathway 82
Figure 16: Neurotransmitter recycling fueled by glycolytic enzymes 86
Figure 17: Glycolysis fuels vesicular transport 87
Figure 18: Enzymes decrease the activation energy of chemical reactions 90
Figure 19: Michaelis-Menten kinetics 91
Figure R1: HTT interacts with GAPDH and PFK on vesicles 121 Figure R2: C49 palmitoylation is not responsible for PK attachment to vesicles 122 Figure R3: GAPDH interacts with both WT and mutant HTT in the cytosol and on vesicles 124 Figure R4: Hexokinase 1 is reduced on in several subcellular fractions including vesicles isolated from HdhCAG140/+ male and female mouse brains 125 Figure R5: Glycolytic activity on vesicles is modified differently according to sex in
HdhCAG140/+ mice 126
Figure R6: An increase in extracellular glucose concentration is unable to restore BDNF transport in cortical neurons isolated from HdhCAG140/+ mice 127 Figure R7: Artificial and specific stimulation of vesicular glycolysis is sufficient to restore BDNF transport in cortical neurons isolated from HdhCAG140/+ mice 128
Figure R8: Stereotaxic injection coordinates 128
Figure R9: AAV PhP.eB carrying TM-GAPDH IRES GFP in or GFP constructs AAV PhP.eB
16
V. INTRODUCTION
A. Chapter 1: Huntington’s disease
1. General description of Huntington’s disease
a) Discovery & history of Huntington’s disease
Huntington’s disease (HD) is a fatal fully penetrant genetic neurodegenerative disorder caused by a mutation in the huntingtin protein. It was first fully described in 1872 by the physician George Huntington where he outlined the clinical features and autosomal dominant inheritance of this disease initially termed “chorea” (Huntington, 1827). He also stated that this movement disorder was accompanied by personality changes and cognitive decline. The juvenile form of HD was discovered approximately 15 years later by J Hoffman who observed it at very early stages in two daughters aged 4 and 10 years old (Hoffman, 1888).
The gene responsible for this disorder is huntingtin and was not properly identified until much later. In 1983, the discovery of a polymorphic DNA marker had pinpointed the gene to the short arm of the fourth chromosome (Gusella et al., 1983). The development of exon trapping not long after enabled the isolation and identification of the HD gene (initially called IT15, at position 4p16.3) by The Huntington’s Disease Collaborative Research Group in 1993 (Marcy E. MacDonald et al., 1993).
b) Prevalence, statistics & heritability of Huntington’s disease in humans
HD’s prevalence varies according to region. It affects 3 to 7 per 100 000 people of European descent but remains slightly less prevalent in Japanese, Chinese and African cultures (Evans et al., 2013; Pringsheim et al., 2012). Symptoms usually appear between the ages of 40 and 60 years of age and death inevitably ensues 15 to 20 years later. The late-onset nature of the disease renders medical care ethically challenging because patients may have children at the time of diagnosis who may also be carriers of the mutation. The much rarer juvenile form is defined as having an age of onset below 21 years of age.
The huntingtin protein (HTT) contains a polyglutamine stretch near to the N-terminal end of the protein (detailed in Chapter 2) due to a CAG trinucleotide repeat in the gene (detailed
17
in Chapter 2), the length of which is of great importance for determining age of onset. Healthy patients usually present an average of 17 glutamine repeats. As this number increases, the probability of contracting HD also increases and the age of onset decreases (figure 1). As a general rule, a CAG repeat length above 40 will almost certainly lead to HD by the age of 60 (Langbehn et al., 2004). Some of the first studies on human cohorts, notably in Venezuela, where several cases had been reported, showed that polyglutamine length accounted for around 60% of the variance for age of onset, with the remaining 40% being due to non-HTT related genetic and environmental factors (Wexler et al., 2004).
As mentioned above, HD is an autosomal dominant disorder, meaning that one mutant allele is sufficient to contract the disease, and that it affects men and women equally. As a result the vast majority of cases are heterozygous. Most information concerning homozygous cases comes from the analyses of the Venezuelan kindred which did not take into account the length of CAG and other genetic modifiers (Wexler et al., 1987). It has been shown that although the presence of two mutant HTT (mHTT) alleles in a given individual does not predict an earlier age of onset, it does however induce a more severe clinical evolution of symptoms leading to an earlier death. This suggests that the rate of evolution of HD pathogenesis leading to motor diagnosis is determined by a completely dominant action of the longest expanded allele (J. M. Lee et al., 2012; Squitieri et al., 2003). Indeed, the length of the CAG repeat in the normal HTT gene of a heterozygous patient does not seem to have an impact on disease progression (J. M. Lee et al., 2012). However, the existence of healthy patients with only one intact HTT gene, suggests that HD is not caused by a simple loss of function due to the CAG expansion (Ambrose et al., 1994).
18
Figure 1: Population estimates of the mean age of onset for CAG repeat lengths 36–60. The solid circles and line indicate the range of data that was used to fit the exponential curves. The blank circles and long dashed lines indicate CAG lengths for which the model’s predictions were extrapolated. Small dashed lines indicate 95% confidence intervals, larger spaces between dashes indicate the region where the model’s predictions were extrapolated (Langbehn et al., Clin Genet, 2004).
Non-HTT related genetic modifiers of HD progression have been greatly investigated as they can be of importance for developing HTT-lowering therapies (developed below). The favored approach for identifying these modifiers has been to search for Single Nucleotide Polymorphisms (SNP) in the surrounding genetic environment of HTT or in genes connected to pathways believed to be involved in HD pathogenesis. Many candidate genes, including Glutamate Receptor Ionotropic Kainate 2 (GRIK2, also known as GLUR6) and the autophagy related protein Atg7, have been associated with earlier age of onset (Gusella & MacDonald, 2009; Rubinsztein et al., 1997). Conversely, other SNPs such as those located in Huntingtin-Associated Protein 1 (HAP1), a protein that interacts with HTT, have been linked to an 8 year delay in age of onset in HD patients (Metzger et al., 2008).
Although HD affects men and women equally, patient gender does have a slight influence on heritability. CAG repeats greater than 28 are unstable during replication leading to small inter-generational variations in CAG length. This instability is known to be stronger in male germline cells (Leeflang et al., 1999; M. E. MacDonald et al., 1993). In association, expansions in CAG repeat size are more common in paternal transmission and large expansions capable of inducing juvenile HD are linked to the father in 75% of cases (Aziz et al., 2011; Kovtun et al., 2000, 2004; Telenius et al., 1993). However, the age of the parent transmitting the disease does not have any effect on CAG instability (Aziz et al., 2011).
19
c) Symptoms
HD is characterized by three types of symptoms: motor, cognitive and psychiatric. They are assessed using the Unified Huntington’s Disease Rating Scale (UHDRS), established in 1996 by the Huntington Study Group (Group, 1996). Motor symptoms are the most characteristic of the disease and are usually the basis for clinical diagnosis. Cognitive and psychiatric symptoms, however, often take a back seat to motor problems, despite being of more concern to patients and care-takers. Indeed, such behavioral changes in HD are more subtle due to the fact that they occur in a range similar to what can be observed in people without any mental issues. Memory loss, depression and mood swings are some of the many abnormalities recorded in HD patients, but even when these become pathological, they cannot be associated with HD alone.
(1) Motor
Motor symptoms, in contrast to cognitive and psychiatric symptoms, are more likely to worsen as disease pathogenesis progresses. Chorea and rapid involuntary movements are the most common and characteristic motor symptoms observed in HD patients. They often start in the extremities, such as in the fingers, toes and face, and slowly spread throughout the whole body (Roos et al., 2010). Patients also present dystonia, slow twisting movements of the limbs, bradykinesia, akinesia, and rigidity, but the degree at which these occur is highly dependent on the individual.
The clinical diagnosis of HD in patients is usually concomitant with the appearance of motor symptoms, with UHDRS scores steadily increasing as the disease progresses (Meyer et al., 2012). However, two ongoing large scale studies, TRACK-HD and PREDICT-HD, have identified subtle changes in motor function that occur up to several decades prior to classical disease onset. This may help predict earlier diagnosis in patients (Biglan et al., 2009; Sarah J. Tabrizi et al., 2013).
(2) Cognitive
A large array of scaling systems exist to evaluate cognitive capacity, from the initial UHDRS to the more recent HD Cognitive Assessment Battery (HD-CAB) (Stout et al., 2014).
20
The most predictive cognitive feature in HD is psychomotor slowing, classically demonstrated through the Stroop, Digit symbol substitution and Trail making tests (Maroof et al., 2011; Sarah J. Tabrizi et al., 2012). This is accompanied with difficulties in executive skills such as planning, multi-tasking and attention (Georgiou et al., 1995; Watkins et al., 2000). Similarly to Parkinson’s disease (PD), automatic executive tasks seem to require more focused and conscious attention for HD patients.
Learning and memory have long been accepted as being significantly attenuated in HD, especially for visuospatial memory and when personal space manipulation is required (Brouwers et al., 1984; Beatty et al., 1989). Additionally, these features have a tendency to gradually deteriorate as the disease progresses (Davis et al., 2003; Lawrence et al., 1996). However there is still much debate over whether these symptoms may be considered as early biomarkers for HD (Majerová et al., 2012; Stout et al., 2012). This may be due to differences in tests used to assess symptoms stated as being of the same nature, but will only become clear as more precise and accurate tests are set up to assess general cognitive dysfunction.
The ability of patients suffering from HD to recognize emotions is also considerably impaired. Moreover, this is, interestingly, quite specific to negative emotions (S. A. Johnson et al., 2007). The first reports identified the recognition of disgust as particularly affected (Sprengelmeyer et al., 1996, 1997), but it is now more or less accepted that this disability can be generalized to several other negative emotions, including fear and anger (Henley et al., 2008; Snowden et al., 2008). However, it remains unsure whether this feature is detectable in pre-manifest HD (Adjeroud et al., 2015; Henley et al., 2012) but it is generally agreed that it has a tendency to aggravate as the disease progresses (Labuschagne et al., 2013). Some have observed that impairments in negative emotion recognition were absent when context and other visual cues were presented to patients, suggesting an importance of context in emotion perception (Aviezer et al., 2009).
(3) Psychiatric
Neuropsychiatric manifestations are among the most problematic features of HD. Depression is one of the most frequently reported symptoms in patients suffering from HD (Leroi et al., 2002; Paulsen, 2005) and is known to be present early in the prodromal stages of the disease (up to 10 years in some studies) (Duff et al., 2007; Epping & Paulsen, 2011; Julien et al., 2007). However, its evolution throughout a patient’s lifetime is still disagreed upon.
21
Some suggest that depressive symptoms are correlated with the stage of the disease (Dale et al., 2016), whereas others have shown that prevalence of depression does not vary (J. C. Thompson et al., 2012). It has even been reported to decrease over the course of the disease (Paulsen, 2005).
Anxiety and apathy are also common symptoms in HD and also appear at different moments depending on the individual. Indeed, as with depression, anxiety has been shown to appear, even peak, at stages predating motor symptoms (Decruyenaere et al., 2003). Apathy, on the other hand, seems to appear at later more advanced stages of the disease (J. C. Thompson et al., 2012; Van Duijn et al., 2014).
Other symptoms include irritability, mood swings and a higher incidence of suicide but are less common or less well researched (Hubers et al., 2013).
(4) Other symptoms
HTT is expressed in virtually all cell types and although HD is associated mainly with brain dysfunction, other bodily functions and organs are also considerably affected. Muscle atrophy is a prime example of this. HD patients show reduced muscle strength by approximately 50% (Busse et al., 2008) associated with several metabolic dysfunctions including reduced mitochondrial adenosine triphosphate (ATP) production during post-exercise recovery (Lodi et al., 2000) and increased lactate concentrations in the plasma in both symptomatic and pre-symptomatic patients (Andrea Ciammola et al., 2011). Muscle cells from mutation carriers studied in vitro revealed mitochondrial depolarization, cytochrome C release, increased caspase activities, defective cell differentiation and HTT inclusions in differentiated myotubes (A. Ciammola et al., 2006).
Weight loss is also a major issue in HD. Indeed, patients often have lower Body Mass Indexes (BMI) and increased caloric intake is necessary to maintain minimal body weight as well as compensate for the increased energy expenditure due to their hyper-metabolic state (TeSlaa & Teitell, 2014).
HTT, and therefore mHTT, are most expressed in the brain and testes. Fertility is not affected in men suffering from HD, but they do present lower concentrations of testosterone, reduced numbers of germ cells and abnormal seminiferous tubule morphology (Markianos et al., 2005; Pridmore & Adams, 1991; Van Raamsdonk et al., 2007).
22
Finally, patients with HD have a higher risk of heart disease (Abildtrup & Shattock, 2013) which contributes to the fact that cardiac arrest is one of the most common causes of death in HD (Sørensen & Fenger, 1992).
2. Animal models of Huntington’s disease
a) Mouse models
Three types of mouse models exist: transgenic truncated models, transgenic full-length models, and knock-in (KI) models. Truncated transgenic mouse models express the first exon of the human mHTT protein and full length models express the entire protein. Transgenic models therefore express 3 HTT genes, 2 wild-type forms and 1 mutated form, truncated or not, making the mHTT/HTT ratio different to what is seen in humans.
R6 transgenic mice are the oldest models used to study HD of which two subtypes exist: R6/2 and R6/1. R6/2 mice express the N-terminal portion of the human HTT protein (exon 1) with 150 polyglutamine repeats. They have a very aggressive phenotype with motor symptoms appearing around 1 month of age, as well as a shortened lifespan of 3 to 5 months (Mangiarini et al., 1996). In these mice, striatal volume is reduced (Stack et al., 2005) and mHTT forms intracellular and intranuclear aggregates just as in humans (Turmaine et al., 1997). Motor deficits include tremor, reduced climbing, and clasping (Mangiarini et al., 1996; B. R. Miller et al., 2008) associated with epileptic seizures (Mangiarini et al., 1996) and decreased learning (Murphy et al., 2000). Moreover, these behavioral changes are correlated to neurochemical changes in basal ganglia circuitry (Bibb et al., 2000; M. A. Johnson et al., 2006; B. R. Miller et al., 2008; Ortiz et al., 2010). The R6/1 mouse line expresses 110 to 115 CAG repeats and has a longer lifespan than R6/2 mice. The first symptoms appear around 4-5 months, motor symptoms at 6-7 months and death of the animal occurs at 10-14 months (Mangiarini et al., 1996; Naver et al., 2003). They also present striatal volume decrease and mHTT aggregates (Mangiarini et al., 1996) as well as reduced motor and cognitive capacities associated with neuronal dysfunction (Mangiarini et al., 1996; B. R. Miller et al., 2008).
Full length transgenic models express the whole human mHTT gene including exons, introns and regulatory genetic material located around the gene. Two subtypes exist depending on the nature of the vector used: Yeast Artificial Chromosome (YAC) and Bacterial Artificial Chromosome (BACHD). The advantage of these models compared to the older R6 model, is
23
that the disease progresses slower and animals live longer allowing for more in depth studies. For YAC mice, several lines have been created depending on the length of the CAG repeat, YAC18 (control), YAC46, YAC72, and YAC128 mice. Only one BACHD mouse model exists and expresses 97 CAA-CAG repeats. Both YAC and BACHD mice suffer from motor deficits associated with cortical and striatal atrophy and dysfunction (Estrada-Sánchez et al., 2015; Gray et al., 2008; Slow et al., 2003; Van Raamsdonk et al., 2005). Additionally, YAC128 is one of the few transgenic models exhibiting both the hyper- and hypoactive behavioral phenotype seen in humans as well as striatal followed by cortical atrophy. By 3 months of age a hyperkinetic phenotype emerges which is then followed by progressive motor deficits. By 9 months of age, motor deficits are apparent and the hypokinetic phenotype is accompanied by striatal atrophy. Finally, when the animal reaches 12 months of age, cortical atrophy starts to occur (Slow et al., 2003; Van Raamsdonk et al., 2005).
The final most recent model for HD is the knock in mouse that carries the first human exon with expanded CAG repeats within the native murine HTT gene, under the mouse HTT promoter. Several models exist including CAG140, zQ175 and HdhQ111. For each of these models, the number in the name corresponds to the number of CAG repeats within the mHTT gene. These mice generally show subtle behavioral, histopathological, and molecular phenotypes compared to the transgenic models that overexpress mHTT (Chang et al., 2015), such as characteristic nuclear aggregates and decreased striatal volume in CAG140 mice (Menalled et al., 2003; Hickey et al., 2009), as well as decreased body weight, tremor and abnormal gait in combination with decreased cognitive ability for zQ175 mice (Heikkinen et al., 2012; L. B. Menalled et al., 2012). Moreover, these phenotypes are detectable in heterozygous mice as well which renders this model more resembling to what can be seen in human patients. This is not the case for transgenic models.
b) Other models
Although mice remain the most common models to study HD, several other mHTT expressing animals have been generated since the discovery of the gene. Similarly to mice, a few transgenic rat models exist, such as HD51 rats that express a truncated form of human HTT with 51 CAG repeats under the control of the rat’s endogenous HTT gene promoter. mHTT was mainly expressed in the basal ganglia, hippocampus and several areas in the cortex, as well as in the cerebellum and spinal cord but at lower levels. Interestingly, these rats exhibit
24
hyperactive behavior in early stages before the onset of weight loss and HD-like motor abnormalities such as gait and dyskinesia of the head at around 10 to 15 months of age (H. P. Nguyen et al., 2006; von Hörsten et al., 2003). Transgenic rats expressing full length mHTT have also been generated. BACHD rats express 97 CAG repeats, capable of accumulating in a similar manner to what is seen in humans, associated with reduced dopamine levels and motor deficits (Yu-Taeger et al., 2012).
Modeling HD in bigger animals has also been attempted. Transgenic rhesus monkeys expressing exon 1 of mHTT with 84Q under the control of the human ubiquitin promoter were created in 2001 by injecting lentiviruses into fertilized oocytes (Chan et al., 2010; Yang et al., 2009). They developed key clinical HD features including dystonia, chorea, and quite uniquely, seizures, seen in no other HD animals other than humans (Yan et al., 2018; Shang-hsun Yang et al., 2009). Unfortunately, postnatal death was very common in these animals and those that survived past birth died prematurely (A. W. S. Chan et al., 2010). A similar outcome was seen in transgenic pigs that expressed 105 CAG repeats in an N-terminal portion of HTT consisting of the first 208 amino acids (D. Yang et al., 2010). Conversely, full length transgenic sheep do not present any overtly aggressive phenotypes and have normal lifespans, showing only a decrease in DARPP-32 expression (an MSN marker) (Jacobsen et al., 2010).
Smaller models of HD have also been studied. Caenorhabditis elegans neurons expressing human full length expanded polyglutamine HTT contain protein aggregates that induce neurodegeneration and mechano-sensory dysfunction (Faber et al., 1999; J. A. Parker et al., 2001). Expressing poly-glutamine HTT fragments in zebrafish has demonstrated that neurodegeneration was initiated before aggregate formation, suggesting that neurotoxicity is due to oligomeric mHTT (Schiffer et al., 2007). Finally, truncated and full length mHTT expressed in different drosophila cell types leads to motor and cellular dysfunction associated with lower lifespan in these animals (Jackson et al., 1998; W. C. M. Lee et al., 2004; Steffan et al., 2001).
3. Neurodegeneration and cellular dysfunction
a) Neurodegeneration
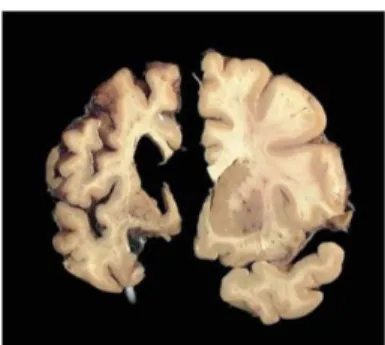
Neurodegeneration of the brain is a hallmark of HD, in particular that of the striatum which is the most pronounced (figure 2). This deep brain structure atrophies long before clinical
25
diagnosis and progressively decreases in size throughout the patient’s life. Evidence of this has been observed up to 15 years before patients develop any clear motor symptoms (Aylward et al., 2011; Hobbs et al., 2010). Interestingly, striatal volume is reduced by a third at the time of diagnosis, such significant reductions are not observed for other brain structures (Aylward et al., 2004; Coppen et al., 2018). As a result, neurodegeneration of the striatum specifically remains one of the best biomarkers of HD as it correlates strongly with age of onset, CAG length, UHDRS scores and age of death (Bohanna et al., 2011; Dogan et al., 2013; A. E. Hendricks et al., 2012).
A close second to striatal atrophy is loss of cortical grey and white matter, especially cortico-striatal projecting neurons (Yi Hong et al., 2018). Although degeneration in this area has not always been correlated with age of onset and CAG length as it is with the striatum (Ruocco et al., 2006), it tends to appear early in the disease, even during prodromal stages according to some reports (Yi Hong et al., 2018). Nonetheless, cortical atrophy occurs later and slower than the striatum and mainly in layers 3, 5 and 6 of the cortex (Passani et al., 1997; Jean Paul Vonsattel et al., 1985). Subsequently, it has been shown that remaining neurons in layers 3 and 5 of the prefrontal cortex show dendritic augmentation as a possible compensatory mechanism for overall cortical atrophy (Sotrel et al., 1993).
Figure 2: The HD brain degenerates. Images showing a normal human brain slice on the right and an advanced stage 4 HD brain slice on the left. At late stages of the disease, cortical and striatal atrophy is evident. Image courtesy of the Harvard Brain Tissue Resource Center.
Other brain regions also atrophy throughout the disease but to a lesser extent or later than their cortical and striatal counterparts. Among them, neurodegeneration in prodromal HD has been observed in the thalamus, of which the atrophy correlates and contributes to cognitive impairment (Kassubek et al., 2004). The hypothalamus, amygdala and globus pallidus also present volumetric reductions (Dogan et al., 2013; Douaud et al., 2006; Kassubek et al., 2004). Finally, magnetic resonance imaging (MRI) studies have shown that the cerebellum is reduced
26
late in the disease but its degeneration may be due to disease duration rather than a direct consequence of cellular dysfunction (Ruocco et al., 2006).
b) Cellular features and dysfunctions
(1) Inclusion bodies
As striatal atrophy is a hallmark of HD on the macroscopic level, inclusion bodies are a staple on the microscopic level. They are formed through aggregation of mHTT in cells, particularly neurons (DiFiglia et al., 1997; Turmaine et al., 1997) where they accumulate in nuclei as well as the cytoplasm, dendrites and axon terminals (DePamphilis et al., 2007). Additionally, these inclusions have been reported to accumulate more frequently in neurons located in the cortex than in the striatum and other brain structures (Sapp et al., 1999). First mHTT monomers, specifically N-terminal fragments, following proteolysis (see chapter 2) (Landles et al., 2010; Ratovitski et al., 2009; Schilling et al., 2007), assemble into a variety of oligomeric formations and gradually form inclusion bodies as they accumulate. This process depends on the amino acid sequences flanking the polyglutamine stretch, post-translational modifications of mHTT, and levels of molecular chaperones (Gu et al., 2009; Jeong et al., 2009; Tam et al., 2010; Thakur et al., 2009).
The reason inclusion bodies accumulate is not yet fully understood but has been suggested to be linked to inefficient degradation mechanisms since several other proteins have been found sequestered within these aggregates, including those important for transcription and protein quality control, thus contributing to the loss of function phenotype of the disease (Soto et al., 2003). It is also believed that the progressive accumulation of mHTT to form aggregates may be a neuroprotective process put in place by the cell to compensate for degradation deficiencies, and that the oligomeric form of mHTT is more dangerous for cellular function than the aggregates (Legleiter et al., 2010; Olshina et al., 2010; Saudou et al., 1998).
(2) Cortico-striatal imbalance
The cortex and striatum are important structures within the basal ganglia circuitry responsible for motor coordination and mood, two phenotypes that are particularly affected in HD. The cortex is a laminar structure made up of six cortical layers that project neurons
27
throughout the brain, including deep brain structures such as the basal ganglia. In HD, pyramidal neurons from layers 3, 5 and 6 are the most affected and reduced by 30% by time of death (Cudkowicz & Kowall, 1990; Hedreen et al., 1991; Sotrel et al., 1991; Heinsen et al., 1994). Neurons in layers 3 and 5 project to the basal ganglia, brain stem, and spinal cord, neurons from layer 6 project to the thalamus (Estrada-Sánchez & Rebec, 2013; McGeorge & Faull, 1989). Recently, it has been shown that cortical neurons have increased activity in very early pre-symptomatic stages before progressively decreasing as the disease unfolds (Burgold et al., 2019).
The striatum is composed of GABAergic medium spiny neurons (MSN) (at 95%) and interneurons. Two subtypes of MSN exist and are of interest in HD: striato-nigral MSN that express substance P, dynorphin, and D1-like dopamine receptors and that project to the internal Globus Pallidus (GPi) and Substantia Nigra pars reticulata (SNr) forming the direct pathway, and striato-pallidal MSN that contain enkephalin and express D2-like dopamine receptors and that project to the external Globus Pallidus (GPe) forming the indirect pathway. Both types of MSN integrate glutamatergic cortical input and relay this information to downstream basal ganglia (Kreitzer and Malenka, Neuron, 2008). The direct and indirect pathways serve to fine tune motor function. The direct pathway is grossly considered to initiate movement whereas the indirect pathway supposedly inhibits it (Alexander & Crutcher, 1990; DeLong, 1990; Albin et al., 1989).
While the presence of mHTT is deleterious to many neuronal sub-types, medium spiny neurons of the striatum exhibit enhanced vulnerability. Indeed, striato-pallidal MSN of the indirect pathway are the most affected in the early stages of the disease leading to insufficient movement inhibition, which explains why chorea and involuntary movements are the first motor symptoms seen in patients. MSN in the direct pathway are lost much later in advanced stages of the disease resulting in rigidity and bradykinesia (Albin et al., 1992; Galvan et al., 2012; L. Menalled et al., 2000; E. Sapp et al., 1995; J P Vonsattel & DiFiglia, 1998). The reason for this selective degeneration of neurons in the striatum is not yet fully understood but some studies have suggested that differential cortical inputs to these two types of neurons may be responsible (Berretta et al., 1997; Reiner et al., 2003).
28
Figure 3: Evolution of medium spiny neuron degeneration. Illustration of the initial loss of enkephalin-positive MSNs (in red) at the beginning of the disease which leads to involuntary movements, followed by the gradual degeneration of substance P-positive neurons (in green) leading to rigidity and akinesia.
(3) Axonal transport
A major cellular dysfunction in HD is axonal transport and has been linked to striatal degeneration. Striatal neurons require Brain Derived Neurotrophic Factor (BDNF) for survival which they do not produce themselves, rendering them reliant on extra-striatal input. Of the many structures that project onto the striatum, cortical input is its most valuable source of BDNF. Indeed, a lack of BDNF causes dysfunction and neurodegeneration in both striatal and cortical neurons (Baquet et al., 2004), and its concentration has been reported to be reduced in the striatum in patients and mouse models of HD (Apostol et al., 2008; Gharami et al., 2008). BDNF is transported in vesicles from cortical somas to cortico-striatal synapses. This mechanism has been shown to be significantly reduced in HD mouse lines such as CAG140 and zQ175, and may be a direct cause of striatal followed by cortical degeneration (Gauthier et al., 2004; Virlogeux et al., 2018). Many other organelles show decreases in transport including autophagosomes (Y. C. Wong & Holzbaur, 2014) and mitochondria, that are known to associate with mHTT (Orr et al., 2008). Finally, glutamate release at cortico-striatal synapses is altered in HD, which has also been linked to defective transport, suggesting that transport of
29
different types of vesicles such as synaptic vesicles is modified in the disease (Gunawardena & Goldstein, 2005; Virlogeux et al., 2018).
(4) Energy metabolism
Defective glucose uptake and mitochondrial function are both strong contributors to metabolic dysregulation in HD. Several studies have shown reduction of glucose transporters GLUT1 and GLUT3 in both cortical and striatal neurons from animal models such as CAG140 mice (McClory et al., 2014) as well as in post mortem tissue samples from HD patients (Gamberino & Brennan, 1994). This reduction in transporter expression can be linked to reduced glucose uptake in neurons (Adanyeguh et al., 2015; Lalić et al., 2008; Powers et al., 2007). Pre-manifest HD subjects show a metabolic decrease in the striatum, combined with frontal, temporal and thalamic hyper-metabolism, as a possible compensatory reaction to progressive decrease of glucose uptake in the caudate (Ciarmiello et al., 2006, 2012; Feigin et al., 2007). Additionally, glucose hypometabolism and reduced GLUT3 expression on neuronal membranes in HD are caused, at least in part, by deficient Rab11 activity (X. Li et al., 2012), a protein that regulates trafficking of numerous receptors to cell membranes, including GLUT3 (McClory et al., 2014). Glucose metabolism is decreased in some regions of the cerebral cortex and throughout the whole striatum in HD patients, and the level of lactate is increased in the striatum, possibly linked to deficiencies in aerobic energy metabolism (mitochondria) (L. Harms et al., 1997).
Mitochondria are a central problem in HD, so much so that treatment of animals with 3-nitropropionic acid, a mitochondrial toxin, causes selective death of medium sized spiny neurons of the striatum, similar to the pathology observed in HD (Beal et al., 1993). Several mitochondrial mechanisms are altered in both patients and animal models, including modification of mitochondrial gene expression, DNA damage (Reddy & Shirendeb, 2012) and a decrease in enzymatic activity of multiple complexes of the oxidative respiratory chain (Johri et al., 2013; S. J. Tabrizi et al., 1999), resulting in calcium dysregulation and low ATP production (Seong et al., 2005). From a physical point of view, mitochondria are structurally damaged with broken cristae, appearing smaller and in reduced numbers in post mortem brain tissue (Costa et al., 2010; J. Kim et al., 2010; Song et al., 2011). To explain this phenomenon, some have shown that mHTT interacts with Dynamin-Related Protein 1 (Drp1), responsible for mitochondrial fission, resulting in elevated GTPase activity of Drp1 and thus an imbalance
30
between mitochondrial fragmentation and fusion (Shirendeb et al., 2012; Song et al., 2011). This finally leads to oxidative damage due to the accumulation of impaired mitochondria which is highly detrimental to overall neuronal function (Martinez–Vicente et al., 2010; Twig & Shirihai, 2011).
(5) Synaptic transmission
Synaptic disconnection, especially between cortical and striatal neurons, is also a prominent feature of HD pathogenesis. This is linked to several neuronal functions that are affected by the presence of mHTT throughout the cortico-striatal network. Synaptic vesicle transport, docking and recycling lead to disrupted glutamate and dopamine release which in turn results in altered neuronal activity (Cepeda et al., 2003). This is associated with downregulation of proteins involved in synaptic function, endocytosis and exocytosis (Burgold et al., 2019; Diprospero et al., 2004; Modregger et al., 2002; Morton et al., 2001; Smith et al., 2005).
Upon release into the synaptic cleft and binding to the various pre and post synaptic receptors, glutamate is quickly recycled by the pre-synaptic cell and astrocytes that are tightly bound to the synapse. In HD, the expression of glutamate transporters is reduced and decreases with disease severity (Arzberger et al., 1997; Behrens et al., 2002; Liévens et al., 2001) resulting in overly present glutamate in the synaptic cleft and therefore excitotoxicity. Additionally, increased glutamate release has been seen in 1 month old YAC128 mice that then decreased with age (Joshi et al., 2009) which can be linked to the cortical hyperactivity noted in early stages of the disease.
Downstream targets of glutamate are also altered in HD, including ionotropic and metabotropic receptors. Two types of N-methyl-D-aspartate receptors (NMDA receptors) are known to locate differently along the membrane of the post-synaptic neuron: NR1/NR2A receptors are located synaptically and tend to mediate pro-survival signals, and NR1/NR2B receptors are found extra-synaptically and play a role in cell death (Gouix et al., 2009; Hardingham et al., 2002; Papadia et al., 2008). However, mHTT specifically increases extra-synaptic NMDA receptor expression and current, with increased EPSC charge and elevated NMDA peak currents in pre-symptomatic (1 month) YAC128 MSN (Milnerwood et al., 2010) and overexpression of NR2B subunits in homozygous CAG150 knock-in mice results in exacerbated striatal neurodegeneration (Heng et al., 2009). Although the manner in which
31
mHTT increases NR2B activity is not well known, several studies have shown that selective inhibition of extra-synaptic receptors through low dose memantine or ifenprodil, an NR2B-type selective antagonist, have neuroprotective effects on striatal neurons both in vitro and in
vivo (Fan et al., 2009; Zeron et al., 2002).
Metabotropic receptors are G-protein coupled receptors that regulate downstream signaling pathways such as calcium release. Several of these receptors have been shown to be decreased in the striatal cells of symptomatic R6/2 mice (Cha et al., 1998). mHTT interacts with the inositol (1,4,5)-triphosphate receptor (InsP3R), of which the activation depends on group 1 metabotropic receptors. This interaction increases InsP3R sensitivity which induces increased calcium release in striatal cells (Tang et al., 2003).
Neuronal activity at the synapse malfunctions also due to α-amino-3-hydroxy-5-methyl-4-isoxazolepropionic acid (AMPA) receptors. Analysis of AMPA-mediated excitatory postsynaptic potential (EPSC) and evoked receptor activity revealed subtle but significant changes in young pre-symptomatic YAC128 mice (Milnerwood & Raymond, 2007). Additionally, a clear disease progression-dependent reduction in EPSC frequencies of AMPA responses is found in the more aggressive R6/2 HD model at onset of motor symptoms (Cepeda et al., 2003).
As mentioned previously, dopamine plays a fundamental role in HD. Reduced dopamine receptor labeling occurs in pre-symptomatic HD patients and correlates with disease progression, cell loss and cognitive impairment (Piccini, 2004). Equally, diminished receptor expression has also been noted before and after behavioral onset in several mouse models (Bibb et al., 2000; Jarabek et al., 2004; Kennedy et al., 2005). To date, the only commercialized drug for treating the disease is Tetrabenazine, a vesicular monoamine transporter type 2 (VMAT2) inhibitor used to increase basal dopamine in the striatum to compensate for decreased receptor expression (Feigin et al., 2007; Hongyu Wang et al., 2010).
(6) Glia
Although a lot of focus is centered around neurons in HD, glial cells also express mHTT and are also affected in the disease. Astrocytes are star shaped cells that envelop synapses and are an integral part of the blood brain barrier. Several studies have shown that mHTT expression and aggregation in astrocytes (although less than in neurons (Bradford et al., 2009)) contribute to neuronal glutamate excitotoxicity via downregulation of the glutamate transporter
32
EAAT2/GLT1 located on the astrocytic membrane resulting in impaired glutamate recycling (Arzberger et al., 1997; Ellrichmann et al., 2013; Estrada-Sánchez & Rebec, 2012; Faideau et al., 2010; Khakh et al., 2017; Liévens et al., 2001; J. Y. Shin et al., 2005). Others have demonstrated that symptom onset in R6/2 and Q175 HD mouse models is associated with decreased Kir4.1 potassium channel expression on astrocytes, leading to elevated striatal extracellular potassium, which increased MSN excitability (Tong et al., 2014). MHTT has equally been shown to reduce astrocytic release of BDNF (Yan Hong et al., 2016; Linhui Wang et al., 2012) and contribute to astocyte-mediated pericytic cell death along cerebral blood vessels (Hsiao et al., 2015).
In the brain, microglia represent approximately 5-10% of cells and are considered the resident immune cells (Frost & Schafer, 2016). Experiments on human HD brain tissue identified the presence of reactive microglia in the neostriatum, cortex and globus pallidus which were absent in control brain tissue (E. Sapp et al., 2001; J. P. G. Vonsattel et al., 2011; Jean Paul Vonsattel et al., 1985). However, the number of activated microglia in the striatum and cortex showed a direct correlation with degree of neuronal loss and microglia were closely associated with pyramidal neurons, suggesting that neuroinflammatory changes might simply be induced by the degenerating neurons (E. Sapp et al., 2001). Moreover mHTT causes an increase in basal inflammatory gene expression. This in turn leads to higher levels of pro-inflammatory cytokines production (Björkqvist et al., 2008; Crotti et al., 2014; H. M. Yang et al., 2017) and neuroinflammatory mediators specifically in regions such as the cortex and striatum (Silvestroni et al., 2009) perpetuating inflammation and tissue damage. Conversely, depleting mHTT in all other cells except microglia seems to rescue behavioral performance and neuropathology (Petkau et al., 2019).
Finally, oligodendrocytes, responsible for myelin production and encapsulation of axons in the brain, also malfunction in HD. Broad abnormalities in superficial white matter are present before any clinical symptoms in human HD brains (Phillips et al., 2016) and transcript levels of myelin-related genes in striatal and cortical tissues are significantly lower in YAC128 mice from 2 weeks of age (Yi Teo et al., 2016). Strikingly, transgenic mice that selectively express mHTT in oligodendrocytes show progressive neurological symptoms and early death, as well as age-dependent demyelination and reduced myelin gene expression (Huang et al., 2015).
33
(7) Other dysfunctions
Many other physiological mechanisms are at risk in HD, including protein degrading systems, neurogenesis, embryogenesis and transcription.
mHTT is believed to be degraded by both the Ubiquitin Proteasome System (UPS), given that the protein is ubiquitinylated (X. J. Li & Li, 2011), as well as autophagy since inclusion bodies sequester autophagy related proteins such as mTOR (Ravikumar et al., 2004). It is still very much debated whether mHTT truly affects the UPS. Some suggest that the proteasome is simply saturated by the overwhelming amount of mHTT (Bennett et al., 2005), whereas others believe that this cannot be possible having shown that proteasome malfunction occurs before aggregate formation (Bennett et al., 2005; Venkatraman et al., 2004). A final hypothesis is that proteasome activity deficiency may be an indirect consequence of mitochondrial dysfunction leading to less ATP available for protein degradation (Hipp et al., 2012). MHTT’s effect on autophagy is also complex. It has been shown that treatment with an autophagy activator attenuates huntingtin accumulation and cell death in vitro in CAG140 cells (Ravikumar et al., 2004), yet basal autophagic activity is maintained in HD cells (Baldo et al., 2013). To explain this, it has demonstrated that autophagic vacuoles form at normal rates in HD cells and are adequately eliminated by lysosomes, but fail to efficiently trap cytosolic cargo in their lumen, suggesting that inefficient engulfment of cytosolic components by autophagosomes is responsible for their slower turnover, functional decay and accumulation inside HD cells (Martinez–Vicente et al., 2010).
HD is also considered by some as a developmental disorder based on the fact that silencing HTT in mice causes embryonic death (Duyao et al., 1995; Nasir et al., 1995; Zeitlin et al., 1995) and that conditional knock-in mice expressing mHTT 97Q until postnatal day 21, develop a HD-like phenotype including neuropathology and motor deficits (Molero et al., 2016). Nonetheless, this phenotype is not as severe as in the mice with lifelong expression of mHTT. In conditional knock downs for HTT and knock-in zQ175 mice, corticostriatal connectivity is altered and excitatory synapse formation is increased in the developing striatum which suggests HTT loss of function in the development of corticostriatal synaptic connectivity (McKinstry et al., 2014). It has recently been demonstrated that several neurodevelopmental processes in the cortex are affected in both human and mouse embryos (Barnat et al., 2020).
Finally, mHTT interacts with major components of the general transcriptional machinery, affecting both general promoter accessibility and recruitment of RNA polymerase
34
II (Seredenina & Luthi-Carter, 2012) which leads to aberrant expression of genes involved in pro-survival pathways including BDNF (Zuccato et al., 2003).
4. Treating Huntington’s disease
Management options at this time are limited, and there is still no therapy to slow the neurodegeneration or the overall rate of function loss. No drug has proven to be effective in any clinical tests on humans (Mason & Barker, 2009). Over the past two decades, 99 clinical trials have been performed in HD investigating 41 different compounds. However, the success rate remains low with only 3.5% of trials progressing to the next stage (Travessa et al., 2017).
a) Symptomatic treatment
The only drug specifically licensed to treat chorea is tetrabenazine (Huntington-Study Group, 2006), a synaptic dopamine transport inhibitor, which provides a sustained anti-choreic effect at doses in the range 50–75 mg per day. Unfortunately, it has many side effects including sleep problems, depression, anxiety and restlessness (Coppen & Roos, 2017). Deutetrabenazine is a modified version of tetrabenazine that contains deuterium molecules and therefore has a prolonged half-life. The FIRST-HD study revealed that deutetrabenzine significantly reduced chorea (Huntington-Study Group, 2016) and it is possible that it may result in fewer side effects than its predecessor, despite no head-to-head comparison (Rodrigues et al., 2017). Pharmacological intervention to treat psychiatric symptoms include selective serotonin uptake inhibitors such as citalopram, fluoxetine, and mirtazepine, which have serotonergic and noradrenergic effects. Neuroleptics can be useful in treating aggression and psychosis. A number of medications including methylphenidate, atomoxetine, modafinil, amantadine, bromocriptine and bupropion have been used to treat apathy (Eddy et al., 2016). Anti-cholinesterase inhibitors and coping mechanisms for the patient’s work environment, for example, are used to treat cognition in HD (Y. Li et al., 2013).
b) Genetic therapy
Two main genetic strategies are currently being tested: lowering of overall HTT expression, thus targeting both wild-type (WT) and mutant forms, or specific reduction of
35
mHTT. Each of these is faced with certain limitations. The functional impact of lowering levels of WT HTT in the adult human brain has yet to be fully elucidated. Conditional inactivation of HTT in mice leads to severe behavioral abnormalities and progressive brain atrophy (Dietrich et al., 2017). By contrast, others have shown that depletion of HTT in adult neuronal cells does not cause neurodegeneration or any other detectable phenotypes (Tanaka et al., 2016), and that transient, partial reduction of WT HTT is safe and well tolerated (Boudreau et al., 2009; Drouet et al., 2009; Grondin et al., 2012; Kordasiewicz et al., 2012; McBride et al., 2011). In fact, humans expressing a single functional copy of HTT (expressing 50% of normal HTT levels) do not display any overt behavioral abnormalities (Ambrose et al., 1994). An approach based on allele specificity has a certain appeal therefore, given that it avoids the unknowns of removing WT HTT. Allele selectivity can be achieved by either targeting the expanded CAG tract on the mutant allele (Datson et al., 2017; Evers et al., 2011)or by targeting other HTT polymorphisms, such as SNPs and nucleotide insertions or deletions associated with the CAG expansion. Several studies have demonstrated the efficiency of such technics in both patients and animal models (Carroll et al., 2011; M. A. Kay, 2015; Pfister et al., 2009; Skotte et al., 2014; Y. Zhang et al., 2009). Multiple SNPs have been identified in diverse populations of patients with HD (Bilsen et al., 2008; Carroll et al., 2011; M. A. Kay, 2015; Pfister et al., 2009), one study has even demonstrated that targeting individual SNPs on the three most common HD haplotypes would provide a cumulative therapeutic option for nearly 80% of patients with HD (M. A. Kay, 2015).
Lowering HTT expression, whether it be all HTT or mHTT alone, is mainly achieved by targeting RNA with the use of antisense oligonucleotides (ASOs), RNA interference (RNAi) or small molecule splicing inhibitors. ASOs are synthetic nucleic acid molecules that hybridize with complementary RNA sequences to promote gene silencing, alter transcript processing (Evers et al., 2014) or prevent transcript translation (Gagnon et al., 2010). However, ASOs can only transiently lower mHTT because they are degraded over time (Southwell et al., 2014). The IONIS HTTRx compound is a non-allele specific ASO that targets human HTT through the formation of an ASO/RNA complex signaled for RNase H degradation (Macdonald et al., 2015). RNAi delivery is more invasive than ASOs requiring intracranial injection into the striatum. However, a single treatment may provide permanent HTT lowering (Wild & Tabrizi, 2017). For instance, delivery of RNAi reagents using adeno-associated virus (AAV) and lentiviral vectors have been used to achieve long-term HTT lowering in the CNS (Boudreau et al., 2009; Cambon et al., 2017; McBride et al., 2011).