HAL Id: hal-01575638
https://hal.archives-ouvertes.fr/hal-01575638
Submitted on 21 Aug 2017
HAL is a multi-disciplinary open access
archive for the deposit and dissemination of
sci-entific research documents, whether they are
pub-lished or not. The documents may come from
teaching and research institutions in France or
abroad, or from public or private research centers.
L’archive ouverte pluridisciplinaire HAL, est
destinée au dépôt et à la diffusion de documents
scientifiques de niveau recherche, publiés ou non,
émanant des établissements d’enseignement et de
recherche français ou étrangers, des laboratoires
publics ou privés.
Experimental Mutual Solubilities of CO 2 and H 2 O in
Pure Water and NaCl Solutions
Marie-Camille Caumon, Jérôme Sterpenich, Aurélien Randi, Jacques Pironon
To cite this version:
Marie-Camille Caumon, Jérôme Sterpenich, Aurélien Randi, Jacques Pironon. Experimental Mutual
Solubilities of CO 2 and H 2 O in Pure Water and NaCl Solutions. 13th International Conference on
Greenhouse Gas Control Technologies, GHGT-13, 14-18 November 2016, Lausanne, Switzerland, Nov
2017, Lausanne, Switzerland. pp.4851-4856, �10.1016/j.egypro.2017.03.1625�. �hal-01575638�
1876-6102 © 2017 The Authors. Published by Elsevier Ltd. This is an open access article under the CC BY-NC-ND license (http://creativecommons.org/licenses/by-nc-nd/4.0/).
Peer-review under responsibility of the organizing committee of GHGT-13. doi: 10.1016/j.egypro.2017.03.1625
Energy Procedia 114 ( 2017 ) 4851 – 4856
ScienceDirect
13th International Conference on Greenhouse Gas Control Technologies, GHGT-13, 14-18
November 2016, Lausanne, Switzerland
Experimental mutual solubilities of CO
2and H
2O in pure water and
NaCl solutions
Marie-Camille Caumon
a*
,
Jérôme Sterpenich
a,Aurélien Randi
a,Jacques Pironon
a aUniversité de Lorraine, CNRS, CREGU, GeoRessources laboratory, BP 70239, F-54506 Vandœuvre-lès-Nancy, FranceAbstract
Solubility measurements in conditions relevant to CO2 geological storage are sparse, especially solubility data of water
in the CO2-rich phase. New data are acquired by in situ Raman spectroscopy in NaCl aqueous. An effect of NaCl
concentration is observed on calibration curves in the H2O-rich phase: the slope of the fitted curve ICO2/IH2O = f(sCO2)
is equal to 4.97, 4.25, and 3.93 at 0, 1, and 2 M NaCl, respectively. On the contrary, the Raman signal in the CO2-rich
phase is not affected by salinity. The slope of the fitted curve ACO2/AH2O = f(yCO2/yH2O) is equal to 1.72 whatever the
NaCl concentration.
© 2017 The Authors. Published by Elsevier Ltd.
Peer-review under responsibility of the organizing committee of GHGT-13.
Keywords: CO2 geological storage; solubility; Raman spectroscopy.
1. Introduction
Carbon dioxide is ubiquitous on Earth, as a gas composing almost 400 ppm of the atmosphere, through solubilization as dissolved species responsible for acidification of the oceans, or trapped in minerals as a major component of sedimentary rocks. CO2 plays also an important role as a fluid circulating in the crust, originating from
hydrocarbon oxidation, carbonate dissolution or magma degassing. Consequently, CO2 is present under various
conditions of pressure and temperature ranging from very low values at the surface of the Earth to pressures reaching
* Corresponding author. Tel.: +33 3 83 68 47 25; fax: +33 3 83 68 47 01. E-mail address: [email protected]
© 2017 The Authors. Published by Elsevier Ltd. This is an open access article under the CC BY-NC-ND license (http://creativecommons.org/licenses/by-nc-nd/4.0/).
4852 Marie-Camille Caumon et al. / Energy Procedia 114 ( 2017 ) 4851 – 4856
several kilobars and temperatures of several hundreds of degrees in deep Earth. The determination of the thermodynamic properties of CO2 is of prime interest to understand and predict its behavior through the geological
and atmospheric cycles or for carbon sequestration. The geological storage of CO2 would be efficient if it is in a critical
state, i.e. at temperature higher than 31.1°C and pressure higher than 73.8 bar. Supercritical CO2 behaves like a gas by
filling all the available volume but has a liquid-like density, increasing storage capacity [1]. Considering a hydrostatic pressure, these conditions are reached above 800 m. At this depth, assuming a thermal gradient in the crust of around 25°C.km-1, temperature is around 35°C. These P-T conditions have to be considered as minima for an efficient CO
2
storage so most of the storage reservoirs should be deeper, implying higher temperature and pressure (35 to 150°C and 80 to 250 bar or more) [2]. Numerous studies were published under various pressure-temperature-composition (PTX) ranges to cover CO2 storage conditions, in particular in the H2O-CO2 system. In this system, one of the key parameter
to define thermodynamic equilibria is CO2 solubility. If CO2 solubility in water is rather well documented at
temperature higher than 100 °C, measurements at lower temperature and mutual solubility of water in the CO2-rich
phase are sparse [3,4].
The usual experimental and analytical techniques are based on the sampling but this operation may induce a perturbation of the system (pressure and temperature decrease, fluid displacement), which can be of a great influence under conditions where the system is close to instability. Moreover, it is not suitable for the analysis of the vapor phase and real-time monitoring of the system. Raman spectroscopy was successfully used to quantify dissolved CO2 in
aqueous media [5–10]. In a previous study, Caumon et al. [10] presented measurements of CO2 solubility in pure water
in the water-rich phase and H2O solubility in the CO2-rich phase by in situ Raman spectroscopy at 65 °C and 100 °C
using the IMAGES experimental device [11]. In this paper, we present extended data of mutual solubilities of CO2
and H2O at 100 °C in NaCl aqueous solutions. The results are compared to the previously published data at 100 °C in
pure water using the same experimental device.
Nomenclature
ACO2 area of the Raman peaks of gaseous or supercritical CO2
AH2O area of the Raman peak of gaseous water
ICO2 intensity (peak height) of the Raman peak of dissolved CO2
IH2O intensity (peak height) of the Raman bending vibration band of liquid water
sCO2 solubility of CO2 in liquid water in mol.kg-1H2O
yCO2 molar fraction of CO2 in the CO2-rich (vapour) phase
yH2O molar fraction of H2O in the CO2-rich (vapour) phase
2. Material and methods
2.1. Experimental device
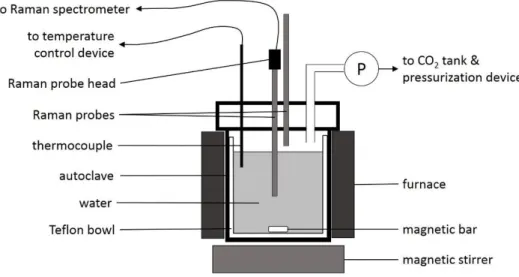
The IMAGES experimental device was described in Caumon et al. [10]. Briefly, it consisted of an autoclave of 2L made of 316 stainless steel. A Teflon bowl was placed in the autoclave to prevent corrosion and laser reflections on the metallic walls. Temperature was set to 100.0 ± 0.1 °C. Pressure and temperature were continuously recorded. Pressure variations were of ± 0.3 bar at equilibrium. Two Raman probes (immersion optics from Kaiser Optical Systems, model IO-18L-VIS) were crimped in the cover and connected via an optical fiber to a RXN1 Raman spectrometer (Kaiser Optical Systems, Inc.). One probe was in the H2O-rich phase, and the other one in the CO2-rich
Fig. 1: the IMAGES experimental device
2.2. Experimental procedure
NaCl solutions were prepared by weighting of NaCl and Milli-Q water (18.2 M:.cm) to obtain 1.02 ± 0.05 M and 2.00 ± 0.05 M NaCl. The autoclave was filled with 1 L of solution. After temperature equilibrium at 100 °C (~24h), CO2 was injected step by step up to 200 bar. Equilibrium occurred 4-12 h after injection. The total experiment time
was of two weeks. 2.3. Data analysis
Raman spectra were recorded continuously in the CO2-rich phase till equilibrium (8 accumulations of 30 s). Raman
spectra of the CO2-rich phase were recorded at equilibrium (8 accumulations of 15 s). A minimum of 10 spectra were
recorded at each step. The spectra were corrected by the spectrometer response (calibration using the HCA accessory, Kaiser Optical Systems, Inc.). In the H2O-rich phase, the signal from Teflon superimposed to the one of dissolved
CO2. The peak intensity ratio were corrected from the apparent “ICO2/ IH2O” measured before the injection of CO2
(blank).
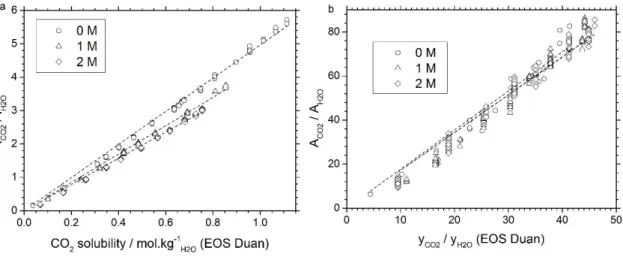
Peak areas and peak intensities were measured using the Labspec6 software following the procedure described in Caumon et al. [10]. The only data processing was the subtraction of a straight baseline. Peak area ratios ACO2/ AH2O
were plotted as a function of molar fraction ratio yCO2/ yH2O for the CO2-rich phase. Peak intensity ratios ICO2/ IH2O
were plotted as a function of CO2 solubility sCO2 (mol.kg-1H2O). Solubility and molar fraction were determined using
the model of Duan and Sun [12] at the pressure and temperature of the experiment. A linear regression was used to fit the data.
3. Results
Raman data are plotted vs. solubility or molar fraction ratio in Fig. 2. In the H2O-rich phase (liquid phase), the
dispersion of the data points is low: the standard deviation V of the repeated measurements is lower than 2%. Linear regression yields R² better than 0.998. The slope of the lines are 4.97, 4.25 and 3.93 at 0, 1, and 2 M, respectively. It decreases when salinity increases.
4854 Marie-Camille Caumon et al. / Energy Procedia 114 ( 2017 ) 4851 – 4856
Fig. 2: (a) Raman peak intensity ratios as a function of CO2 solubility and salinity (H2O-rich phase); (b) Raman peak area ratios as a function of CO2/H2O molar fraction ratio and salinity (CO2-rich phase). P = 5-200 bar, T= 100°C.
In the CO2-rich phase, the dispersion of the data points in Fig. 2 is a little higher (1V d 5%). This is due to the low
amount of gaseous H2O in CO2 (20% at 5 bar, and down to 2% at ~ 150 bar) and, so to a lower signal-to-noise ratio
on Raman spectra. Only the data points recorded at pressure lower than ~130-150 bar are plotted. Beyond this point, the molar ratio reverses and the correlation is no more linear [10]. The linear regression yields slopes of 1.72 ± 0.05 whatever the salinity.
4. Discussion
Salinity affects calibration curves in the H2O-rich phase. It is probably due to a deformation of the Raman signal
of water with salinity. This effect is describe by Wu et al. [13] for the stretching vibration band of water. Raman cross section in liquids depends on the local field factor L. L is sensitive to the refraction index of the medium, and this index changes with salinity. As a consequence, the Raman cross section of water increases with NaCl concentration, but the local field factor can only partially explain the variation of Raman cross section [13]. This effect is first evidenced here for the bending vibration band of liquid water. In the CO2-rich phase, salinity doesn’t affect calibration.
As NaCl is absent from this phase, the only effect is on the molar fraction ratio vs. pressure, but the Raman signal is not affected.
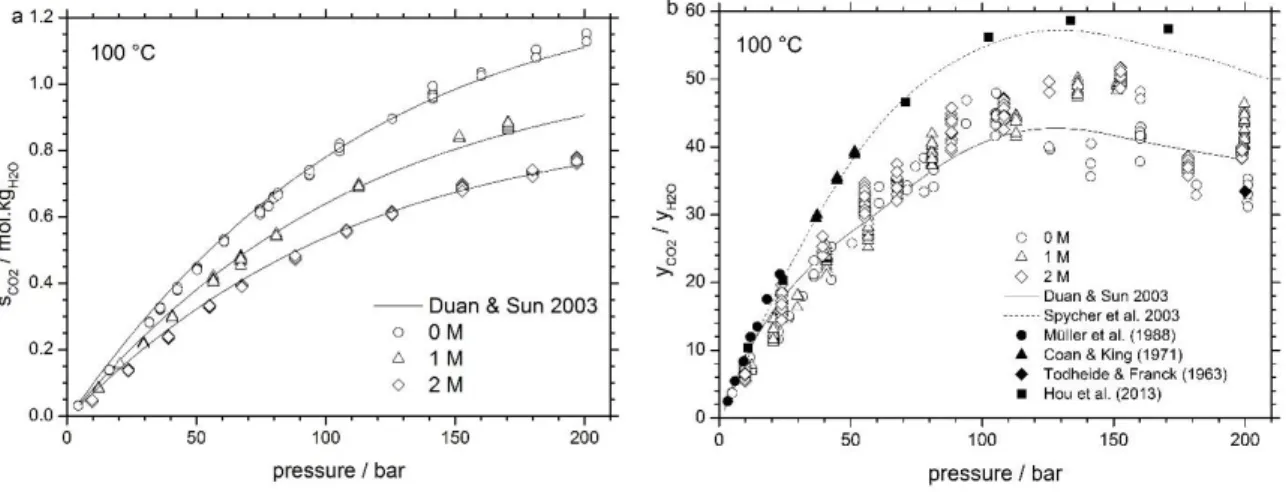
The solubilities experimentally measured in this study are plotted in Fig. 3 as a function of pressure. In the H2
O-rich phase, the solubility of CO2 is coherent with the Duan and Sun model [12] over the full pressure and salinity
ranges. In the CO2-rich phase, the molar fraction ratio seems to be more dispersed above 100 bar. These points were
not included in the fitting procedure (Fig. 2). Applying the calibration, our data points are in between the model of Duan and Sun [12] and Spycher et al. [4] and within the range of literature experimental data [14–17].
Fig. 3: (a) solubility of CO2 at 100 °C as a function of pressure and NaCl concentration. (b) molar fraction ratio yCO2/yH2O in the CO2-rich phase at 100 °C as a function of NaCl salinity; comparison with the thermodynamic models of Duan and Sun [12] and Spycher et al. [4] and literature
experimental data points [14–17].
5. Conclusion
The determination of mutual solubilities of H2O and CO2 is essential for the modelling and understanding of CO2
geological storage in deep saline aquifer. Here it is demonstrated that the IMAGES experimental device, coupled to a Raman spectrometer, makes possible to produce new solubility data at 100 °C up to 200 bar, in the presence of NaCl. Moreover, it is now possible to measure H2O solubility data in the CO2-rich phase where data are very sparse.
Acknowledgements
This work was supported by the ANR grants (“Geocarbone Injectivité” ANR-05-CO2-007-05, “GazAnnexes” ANR-06-CO2-005 and “SIGARRR” ANR-13-SEED-0006).
References
[1] Bachu, S., 2000. Sequestration of CO2 in geological media: criteria and approach for site selection in response to climate change. Energy Convers. Manag., 2000, 41, 953–970.
[2] Li, H., Jakobsen, J.P., Wilhelmsen, Ø., Yan, J., 2011. PVTxy properties of CO2 mixtures relevant for CO2 capture, transport and storage: Review of available experimental data and theoretical models. Appl. Energy, 2011, 88, 3567–3579.
[3] Marini, L., 2006. Geol. Sequestration Carbon Dioxide Thermodyn. Kinet. React. Path Model., vol. 11, Elsevier, pp. 27–51.
[4] Spycher, N., Pruess, K., Ennis-King, J., 2003. CO2-H2O mixtures in the geological sequestration of CO2. I. Assessment and calculation of mutual solubilities from 12 to 100°C and up to 600 bar. Geochim. Cosmochim. Acta, 2003, 67, 3015–3031.
[5] White, S., 2010. Qualitative and quantitative analysis of CO2 and CH4 dissolved in water and seawater using laser Raman spectroscopy. Appl. Spectrosc., 2010, 64, 819–827.
[6] Liu, N., Aymonier, C., Lecoutre, C., Garrabos, Y., Marre, S., 2012. Microfluidic approach for studying CO2 solubility in water and brine using confocal Raman spectroscopy. Chem. Phys. Lett., 2012, 551, 139–143.
[7] Lu, W., Chou, I., Burruss, R., 2007. Water-Rock Interact., Taylor & Francis.
[8] Guo, H., Chen, Y., Hu, Q., Lu, W., et al., 2014. Quantitative Raman spectroscopic investigation of geo-fluids high-pressure phase equilibria: Part I. Accurate calibration and determination of CO2 solubility in water from 273.15 to 573.15 K and from 10 to 120 MPa. Fluid Phase Equilibria, 2014, 382, 70–79.
[9] Belgodere, C., Dubessy, J., Vautrin, D., Caumon, M.-C., et al., 2015. Experimental determination of CO2 diffusion coefficient in aqueous solutions under pressure at room temperature via Raman spectroscopy: impact of salinity (NaCl). J. Raman Spectrosc., 2015, 46, 1025– 1032.
[10] Caumon, M.-C., Sterpenich, J., Randi, A., Pironon, J., 2016. Measuring mutual solubility in the H2O–CO2 system up to 200 bar and 100 °C by in situ Raman spectroscopy. Int. J. Greenh. Gas Control, 2016, 47, 63–70.
4856 Marie-Camille Caumon et al. / Energy Procedia 114 ( 2017 ) 4851 – 4856
[11] Sterpenich, J., Sausse, J., Pironon, J., Géhin, A., et al., 2009. Experimental ageing of oolitic limestones under CO2 storage conditions: Petrographical and chemical evidence. Chem. Geol., 2009, 265, 99–112.
[12] Duan, Z., Sun, R., 2003. An improved model calculating CO2 solubility in pure water and aqueous NaCl solutions from 273 to 533 K and from 0 to 2000 bar. Chem. Geol., 2003, 193, 257–271.
[13] Wu, X., Lu, W., Ou, W., Caumon, M.-C., Dubessy, J., 2016. Temperature and salinity effects on the Raman scattering cross section of the water OH-stretching vibration band in NaCl aqueous solutions from 0 to 300 °C. J. Raman Spectrosc., 2016, n/a-n/a.
[14] Tödheide, K., Frank, E.U., 1963. Das Zweiphasengebiet und die Kritische Kurve im System Kohlendioxid-Wasser bis zu Drucken von 3500 bar. Z. Fuer Phys. Chem. N. F., 1963, 37, 387–401.
[15] Coan, C.R., King, A.D., 1971. Solubility of water in compressed carbon dioxide, nitrous oxide, and ethane. Evidence for hydration of carbon dioxide and nitrous oxide in the gas phase. J. Am. Chem. Soc., 1971, 93, 1857–1862.
[16] Müller, G., Bender, E., Maurer, G., 1988. Das Dampf-Flüssigkeitsgleichgewicht des Ternären Systems Ammoniak-Kohlendioxid-Wasser bei Hohen Wassergehalten im Bereich Zwischen 373 und 473 Kelvin. Berichte Bunsen-Gesellshaft Für Phys. Chem., 1988, 92, 148–160. [17] Hou, S.-X., Maitland, G.C., Trusler, J.P.M., 2013. Measurement and modeling of the phase behavior of the (carbon dioxide+water)