HAL Id: hal-00300984
https://hal.archives-ouvertes.fr/hal-00300984
Submitted on 19 Mar 2003HAL is a multi-disciplinary open access
archive for the deposit and dissemination of sci-entific research documents, whether they are pub-lished or not. The documents may come from teaching and research institutions in France or abroad, or from public or private research centers.
L’archive ouverte pluridisciplinaire HAL, est destinée au dépôt et à la diffusion de documents scientifiques de niveau recherche, publiés ou non, émanant des établissements d’enseignement et de recherche français ou étrangers, des laboratoires publics ou privés.
Ultrathin Tropical Tropopause Clouds (UTTCs): I.
Cloud morphology and occurrence
T. Peter, B. P. Luo, H. Wernli, M. Wirth, C. Kiemle, H. Flentje, V. A.
Yushkov, V. Khattatov, V. Rudakov, A. Thomas, et al.
To cite this version:
T. Peter, B. P. Luo, H. Wernli, M. Wirth, C. Kiemle, et al.. Ultrathin Tropical Tropopause Clouds (UTTCs): I. Cloud morphology and occurrence. Atmospheric Chemistry and Physics Discussions, European Geosciences Union, 2003, 3 (2), pp.1557-1578. �hal-00300984�
ACPD
3, 1557–1578, 2003 Ultrathin Tropical Tropopause Clouds (UTTCs), Part I Th. Peter et al. Title Page Abstract Introduction Conclusions References Tables Figures J I J I Back Close Full Screen / EscPrint Version
Interactive Discussion
c
EGU 2003
Atmos. Chem. Phys. Discuss., 3, 1557–1578, 2003 www.atmos-chem-phys.org/acpd/3/1557/
c
European Geosciences Union 2003
Atmospheric Chemistry and Physics Discussions
Ultrathin Tropical Tropopause Clouds
(UTTCs): I. Cloud morphology and
occurrence
Th. Peter1, B. P. Luo1, H. Wernli1, M. Wirth2, C. Kiemle2, H. Flentje2,
V. A. Yushkov3, V. Khattatov3, V. Rudakov3, A. Thomas4, S. Borrmann4, G. Toci5, P. Mazzinghi6, J. Beuermann7, C. Schiller7, F. Cairo8, G. Di Don-francesco9, A. Adriani8, C. M. Volk10, J. Strom11, K. Noone12, V. Mitev13, R. A. MacKenzie14, K. S. Carslaw15, T. Trautmann16, V. Santacesaria17, and L. Stefanutti18
1
Institute for Atmospheric and Climate Science, ETH Z ¨urich, Switzerland
2
Institute for Atmospheric Physics, DLR Oberpfaffenhofen, Germany
3
Central Aerological Observatory, Moscow, Russia
4
Institute for Atmospheric Physics, University of Mainz, Germany
5
Quantum Electronics Institute, National Research Council (IEQ-CNR), Florence, Italy
6
National Institute of Applied Optics, Florence, Italy
7
Institute I: Stratosphere, Forschungszentrum J ¨ulich GmbH, J ¨ulich, Germany
8
Institute for Atmospheric Science and Climate,CNR, Roma, Italy
9
ACPD
3, 1557–1578, 2003 Ultrathin Tropical Tropopause Clouds (UTTCs), Part I Th. Peter et al. Title Page Abstract Introduction Conclusions References Tables Figures J I J I Back Close Full Screen / EscPrint Version
Interactive Discussion
c
EGU 2003
10
Institut f ¨ur Meteorologie und Geophysik, Universit ¨at Frankfurt, Germany
11
Institute of Applied Environmental Research, Stockholm University, Sweden
12
Department of Meteorology, Stockholm University, Sweden
13
Observatoire Cantonal, Neuch ˆatel, Switzerland
14
Environmental Science Department, Lancaster University, UK
15
School of the Environment, University of Leeds, UK
16
Institute of Meteorology, University of Leipzig, Germany
17
IROE – CNR “Nello Carrara”, Firenze, Italy
18
Geophysica-GEIE – CNR, Firenze, Italy
Received: 9 December 2002 – Accepted: 27 December 2002 – Published: 19 March 2003 Correspondence to: B. P. Luo ([email protected])
ACPD
3, 1557–1578, 2003 Ultrathin Tropical Tropopause Clouds (UTTCs), Part I Th. Peter et al. Title Page Abstract Introduction Conclusions References Tables Figures J I J I Back Close Full Screen / EscPrint Version
Interactive Discussion
c
EGU 2003
Abstract
Subvisible cirrus clouds (SVCs) may contribute to dehydration close to the tropical tropopause. The higher and colder SVCs and the larger their ice crystals, the more likely they represent the last efficient point of contact of the gas phase with the ice phase and, hence, the last dehydrating step, before the air enters the stratosphere. The 5
first simultaneous in situ and remote sensing measurements of SVCs were taken dur-ing the APE-THESEO campaign in the western Indian ocean in February/March 1999. The observed clouds, termed Ultrathin Tropical Tropopause Clouds (UTTCs), belong to the geometrically and optically thinnest large-scale clouds in the Earth’s atmosphere. Individual UTTCs may exist for many hours as an only 200–300 m thick cloud layer just 10
a few hundred meters below the tropical cold point tropopause, covering up to 105km2. With temperatures as low as 181 K these clouds are prime representatives for defining the water mixing ratio of air entering the lower stratosphere.
1. Introduction
Cirrus clouds are an essential element in the Earth’s radiation budget due to their 15
direct radiative forcing and their influence on the water budget in the middle and up-per troposphere (Lohmann and Roeckner, 1995). Cirrus clouds in the vicinity of the tropical tropopause regions might in part be responsible for the dehydration of the up-permost troposphere and therefore also for the water vapor mixing ratio in the lower stratosphere (Jensen et al., 1996, 2001; Sherwood and Dessler, 2000; Gettelman et 20
al., 2001). For cirrus clouds with particularly thin optical thickness, τ, Sassen et al. (1989) coined the term Subvisible Cirrus (SVC), and used τ < 0.03 as a visibility criterion. Previous studies have found SVCs with optical thicknesses typically in the range 10−3− 10−2(Heymsfield, 1986; Heymsfield and McFarquhar; 1996; Winker and Trepte, 1998; Wang et al., 1998; McFarquhar et al., 2000; Omar and Gardner, 2001), 25
ACPD
3, 1557–1578, 2003 Ultrathin Tropical Tropopause Clouds (UTTCs), Part I Th. Peter et al. Title Page Abstract Introduction Conclusions References Tables Figures J I J I Back Close Full Screen / EscPrint Version
Interactive Discussion
c
EGU 2003
emerging climatological information on laminar cirrus based on remote (lidar, satellite) and in situ (aircraft) retrievals suggest that they are probably ubiquitous in the tropics independent of seasons (e.g. Wang et al., 1998; McFarquhar et al., 2000; Winker and Trepte, 1998).
In February and March 1999, the European airborne campaign APE-THESEO was 5
performed from the Seychelles, 5◦S 55◦E, with the aim to investigate the effects of deep convective events and of cirrus on the Upper Troposphere/Lower Stratosphere (UTLS) water budget in the western Indian ocean. This paper describes the mor-phology and occurrence frequencies of the particularly thin and high SVCs observed during APE-THESEO. The underlying particle counter measurements are described 10
by Thomas et al. (2002). The details of the formation process of these clouds, how they are maintained, and to what degree they may lead to dehydration of the upper tro-posphere and lower stratosphere is still uncertain. A mechanism for their maintenance and stabilization is described in the companion paper (Luo et al., 2003b). Upon cool-ing UTTCs are prone to dehydratcool-ing the air before it enters the tropical stratosphere, a 15
mechanism described by Luo et al. (2003a).
2. APE-THESEO flight strategy
Two aircraft were employed during APE-THESEO and closely coordinated with each other: the low-flying Falcon, a German research aircraft equipped with a three-wave-lengths lidar system (1064, 532, 354 nm backscatter ratios; 532 nm depolarization ra-20
tio), and the high-flying Geophysica, a Russian research aircraft with various in-situ and short-range remote instruments for measuring particles (size distributions, water and nitric acid in the condensed phase, backscatter in-situ and between 300 m and 2500 m above the aircraft) and trace gases (gas phase water, ozone, CO, N2O, CFC-11, CFC-12, SF6). For more detailed descriptions of the Falcon lidar system see Wirth 25
and Renger (1996) and of the Geophysica payload see Stefanutti et al. (1999).
fea-ACPD
3, 1557–1578, 2003 Ultrathin Tropical Tropopause Clouds (UTTCs), Part I Th. Peter et al. Title Page Abstract Introduction Conclusions References Tables Figures J I J I Back Close Full Screen / EscPrint Version
Interactive Discussion
c
EGU 2003
tures. The Falcon lidar system allows to detect extremely thin cirrus structures, which can neither be observed by ground-based lidar nor by the pilot of the high-flying aircraft. At 1064 nm wave-length the backscatter ratio is a sensitive indicator of the presence of thin clouds or aerosol layers, even when the simultaneous backscatter measurements at 532 nm and 354 nm show practically no indication of a thin cloud feature. This is due 5
to the lower Rayleigh backscatter by the air molecules (∝ λ−4), while the backscatter of ice particles is nearly independent of wavelength as the particles are much larger than all wavelengths. The lidar information is available as on-line quick-look information during the flight. Owing to these capabilities the Falcon served as pathfinder for the Geophysica during APE-THESEO. The high flexibility of the Geophysica allows direct 10
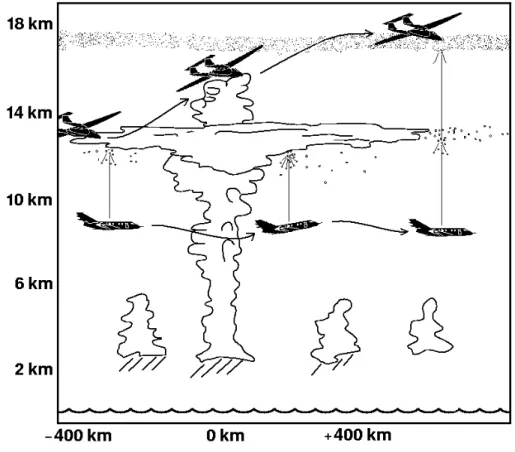
changes of altitude and flight direction according to in-flight requests by the mission scientist onboard the Falcon, e.g. for obtaining controlled changes in altitude in steps of 50 m. The Falcon, when throttled, can fly with the same speed (relative to ground) at 10–12 km as the Geophysica at 16–20 km, allowing simultaneous measurements on the same object, see Fig. 1. Alternatively, the Falcon can fly ahead with increasing 15
distance from Geophysica when new space is to be explored. For more information on the tandem flight options during APE-THESEO and during other campaigns see Peter et al. (2000).
The simultaneous remote sensing lidar measurement and the in-situ measurements provide new quantitative information on the microphysical and optical properties of 20
cirrus clouds in the 3–4 km below the cold point tropopause, the so-called Tropical Tropopause Layer, TTL (Sherwood and Dessler, 2000). Clouds with a wide range of backscattering ratios and various amounts of condensed water content were found. Besides SVCs and thicker visible cirrus clouds (Santacesaria et al., 2003), UTTCs were detected and could be characterized as a new, distinct class of ultrathin clouds 25
ACPD
3, 1557–1578, 2003 Ultrathin Tropical Tropopause Clouds (UTTCs), Part I Th. Peter et al. Title Page Abstract Introduction Conclusions References Tables Figures J I J I Back Close Full Screen / EscPrint Version Interactive Discussion c EGU 2003 3. Measurements 3.1. Overview
A total of seven scientific tandem flights were carried out during APE-THESEO, each 4–5 h long, mostly employing the Falcon in the pathfinding mode. Figures 2–4 give an overview over one of these coordinated flights, which took place on 24 February 1999. 5
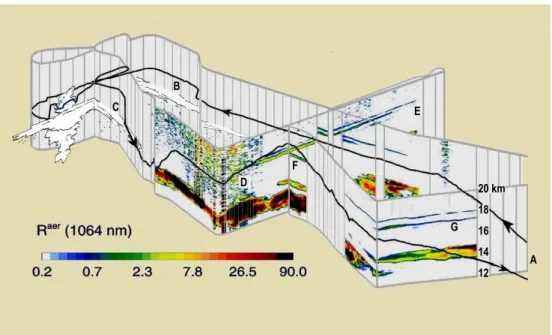
This flight aimed at investigating the microphysical properties of particle distributions in the TTL close to a deep convective system which was located about 950 km to the southwest of the Seychelles, see Fig. 2. In Fig. 3, the white curtain with cloud lidar images shows the Falcon measurements (flight level ∼10 km) and the black line (with arrows) is the Geophysica flight path (flight levels 14–18 km). In the vicinity of the trop-10
ical thunderstorm (from point B to C in Figs. 2 and 3), there are no lidar measurements due to heavy precipitation. On the other parts of the flight (C-D-F), an about 2 km thick visible cirrus deck was located between 12 to 14 km, which was directly connected with the anvil of the thunderstorm and might in part be outflow from this system. At greater distances from the storm (G) the visible cirrus cloud turns into an SVC layer at ∼14 km. 15
Distinct and extensive UTTC layers were detected above 17 km altitude. The UTTCs are separated from the anvil clouds and other cirrus by 3–4 km vertical distance. They are also disconnected from the cumulonimbus turrets, which reached a maximum alti-tude of 15 km, see Fig. 4 (see also Thomas et al., 2002). In some locations there is a UTTC double layer, probably related to a double tropopause (as often observed in the 20
Seychelles radio sondes).
The general pattern of thicker clouds below 15 km and very thin clouds above 17 km altitude without direct connection corroborates the concept of the TTL: deep convection lifts large amounts of water to the lower edge of the TTL, but usually not deeply into it. Within the TTL the air rises slowly, mainly radiatively and without further convec-25
tive drive. Cirrus clouds may form within the TTL and affect the water vapor budget. Though suggestive, this picture does not anticipate the mechanisms of dehydration in the TTL. Deep convection might lead to air masses overshooting the buoyancy
equi-ACPD
3, 1557–1578, 2003 Ultrathin Tropical Tropopause Clouds (UTTCs), Part I Th. Peter et al. Title Page Abstract Introduction Conclusions References Tables Figures J I J I Back Close Full Screen / EscPrint Version
Interactive Discussion
c
EGU 2003
librium height (hyperventilation), and consequently to cooling far below ambient tem-peratures. Provided that ice crystals grow to sufficient sizes and manage to sediment out of these air masses before they sink back to the equilibrium buoyancy level (with concomitant heating), hyperventilation might lead to extremely dry air masses. This mechanism has first been advocated by Danielsen (1981) and is recently again pro-5
moted by Sherwood and Dessler (2000). Furthermore, Sherwood (2002) argues that condensation outside of convection does not reset the water vapor to a lower value independent of convective influence. Whether the ice particles in convective hyperven-tilation can grow to sizes large enough for rapid sedimentation is currently very unclear. On the other hand, the measurements described in this work in combination with cirrus 10
cloud modeling lead Luo et al. (2003a) to conclude that UTTCs may indeed be the final step in the dehydration sequence through which air passes on its way from the lower troposphere to the stratosphere.
3.2. Lidar measurement of UTTCs
During APE-THESEO lidar measurements on board the Falcon were performed at 15
355 nm, 532 nm and 1064 nm. In addition, at 532 nm the depolarization ratio is mea-sured, which is an indicator for the shape of the particles (spherical droplets versus non-spherical crystals). Aerosol backscattering ratios at 1064 nm within UTTCs are in the range R1064aer = 1 − 7, while the cloud layers remain practically invisible at 532 nm, R532aer < 0.2. This makes these particles hard to detect, and standard aerosol lidar
20
measurements at 532 nm from the ground have no chance detecting UTTCs even af-ter long integration times. We performed ground measurements during night with the Falcon lidar at 1064 nm, and an integration over several hours reveals the presence of the UTTCs as a faint signal below the tropopause.
In principle, it is easier to observe thin laminar clouds at the tropical tropopause when 25
looking from above. The LITE experiment with an aerosol lidar at 532 nm onboard the space shuttle has demonstrated the existence of extensive laminar cirrus in the tropics all around the globe (Winker and Trepte, 1998). The clouds seen by LITE are
ACPD
3, 1557–1578, 2003 Ultrathin Tropical Tropopause Clouds (UTTCs), Part I Th. Peter et al. Title Page Abstract Introduction Conclusions References Tables Figures J I J I Back Close Full Screen / EscPrint Version
Interactive Discussion
c
EGU 2003
of similar thickness and altitude as UTTCs, but they find R532aer ≈ 3, and consequently the optical thickness of these clouds is typically one order of magnitude higher than UTTCs. UTTCs would probably not be visible for LITE.
The optical thickness at 1064 nm of UTTCs can be estimated to range from 1.3×10⁻⁴ to 8 × 10⁻⁴using a lidar coefficient of 80 (the ratio between the extinction coefficient to 5
backscattering coefficient) obtained by a T-matrix calculation assuming that the ice par-ticles are prolate spheroids with an aspect ratio ranging from 0.5 to 0.8 (Mishchenko, 1991; Carslaw et al., 1998). The aerosol backscattering ratio at shorter wavelengths (532 nm and 355 nm) are much smaller and are hardly distinguishable from the back-ground. The small backscattering ratios at 532 nm is corroborated by in situ measure-10
ments onboard Geophysica performed by the sideways-looking scatterometer MAS R532aer < 0.2.
From Figs. 2 and 3 based on lidar measurements the following characteristics of the UTTCs may be summarized:
(a) The clouds are located only a few hundred meters below the tropical cold point 15
tropopause with a vertical thickness of only 200–300 m, making them prime candi-dates for the last dehydration step of air during troposphere-to-stratosphere exchange. (b) Their horizontal extension is several thousands of square kilometers.
(c) Aerosol backscattering ratios of UTTCs are extremely low (R1064aer = 1 − 7, R532aer < 0.2), which makes these clouds currently best accessible by aircraft-borne lidar mea-20
surements at 1064 nm.
(d) The lidar signal at 532 nm of the UTTCs shows a depolarization signal of 10–30% from both OLEX (remotely from the Falcon) and MAS (in situ on Geophysica), indicat-ing particles are of non-spherical shape.
(e) Within UTTCs, the backscattering ratio is relatively homogeneous, despite the small 25
backscattering ratio, calling for a non-trivial stabilization mechanism (Luo et al., 2003b). (f) During the total of 19 h of OLEX in-flight observations on 7 mission flights, the UTTC coverage was 31%, see Table 1 for more statistical information.
ACPD
3, 1557–1578, 2003 Ultrathin Tropical Tropopause Clouds (UTTCs), Part I Th. Peter et al. Title Page Abstract Introduction Conclusions References Tables Figures J I J I Back Close Full Screen / EscPrint Version
Interactive Discussion
c
EGU 2003
3.3. In-situ measurements
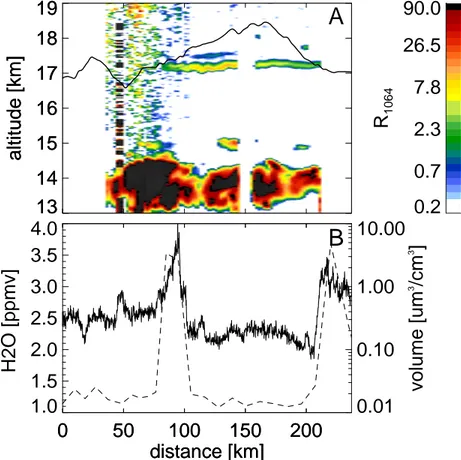
One section of the extensive UTTC shown in Figs. 2–4 is also shown in Fig. 5a, together with results from the in situ total water measurements (FISH) and the particle counter measurements (FSSP-300) on board of the Geophysica in Fig. 5b. The total water, measured by the Ly-α hygrometer FISH, is shown by the solid line. Extremely low 5
water mixing ratios were found in the tropical tropopause region (2.0–2.5 ppmv in the cloud free areas). Subtracting the gas phase (obtained from the cloud-free areas) from the total H2O pressure measured by FISH and averaging over the cloud altitude ranges (identified by FSSP, dashed line) yields about 100 ppbv of H2O in the condensed phase (after correcting for oversampling of particulate water in the cloud particles by a factor 10
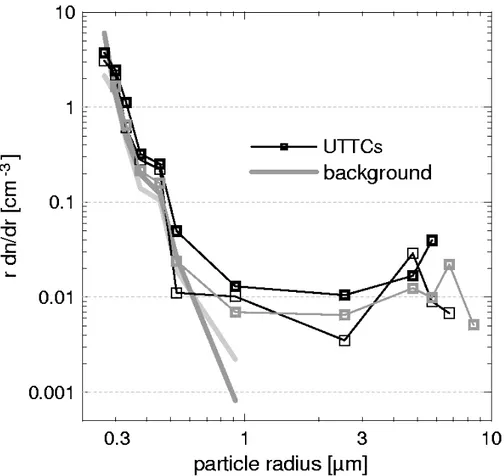
of ∼5). The FSSP-300 measurements (Fig. 5b and Fig. 6) show a sudden increase in total particle volume when entering a UTTC. The FSSP-300 size distributions of UTTCs show a distinct particle mode around r ≈ 5 − 6 µm and particle number densities of 5– 10 particles per liter for r > 3 µm (Fig. 6), which are responsible for the measured high particulate volume. The volume density measured by the FSSP-300 corresponds to a 15
water vapor mixing ratio that condensed in the particulate phase of ∼40 ppbv, which is in fair agreement with the FISH measurement (the origin of the factor 2.5 discrepancy is not known, but given the accuracies of both instruments this discrepancy is quite acceptable).
Given the small fraction of only 1–5% of the total water residing in the condensed 20
phase the identification of the UTTCs as water ice particles must be questioned. An alternative identification as nitric acid containing particles, e.g. nitric acid trihydrate (NAT ≡ HNO3·3H2O) as known from polar stratospheric clouds, would automatically result in very small amounts of condensate, as there is only a limited amount of HNO3 at the tropical tropopause. The existence of NAT at the tropical tropopause has been 25
suggested by Hervig and McHugh (2002). However, Luo et al. (2003a, b) address this question specifically and conclude that the UTTC particles consist indeed of water ice. This conclusion is, besides other arguments, corroborated by the counter-flow
ACPD
3, 1557–1578, 2003 Ultrathin Tropical Tropopause Clouds (UTTCs), Part I Th. Peter et al. Title Page Abstract Introduction Conclusions References Tables Figures J I J I Back Close Full Screen / EscPrint Version
Interactive Discussion
c
EGU 2003
virtual impactor (CVI) measurements onboard of the Geophysica. The CVI has an integrated tunable diode laser spectrometer (CVI-TDL) for the measurement of HNO3 in the particulate phase, but the instrument showed practically no particulate nitric acid during the campaign (not shown here, see Luo et al., 2003a), except for one flight into a tropical cyclone.
5
Vertical profiles of the in-situ measurements are shown in the companion paper (Luo et al., 2003b). On 24 January 1999 the tropopause over the western Indian ocean was extremely cold (T ≈ 188 K) with a height of about 17.5 km. The UTTCs indicated by an enhancement in the ice volume were located at about 17.1 km, 400 m below the cold point tropopause. The air was subsaturated with respect to ice below the UTTCs and 10
supersaturated above the UTTCs. In the cloud layer, the air was in equilibrium with ice. This observation is important to explain the stability of these thin cloud layers, as we discuss in detail in the companion paper (Luo et al., 2003b).
3.4. Determination of UTTC condensed mass from lidar measurements
The water mixing ratios, that condensed in the UTTCs, can also be estimated from the 15
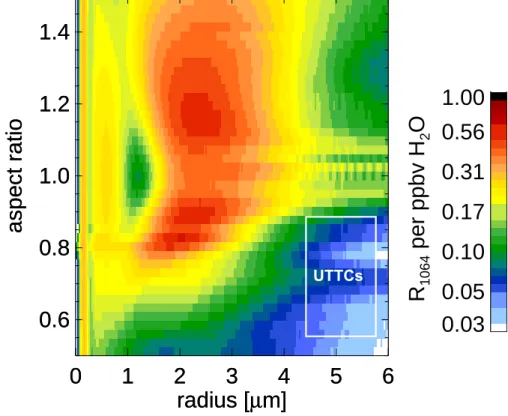
remote sensing lidar measurement using the T-matrix method for the backscattering coefficients (Mishchenko, 1991; Carslaw et al., 1998). The simulated lidar backscat-tering ratio at 1064 of 1 ppbv H2O condensed in ice particles is shown in Fig. 7. A temperature of 190 K is used for the calculation of the molecular number density of air. The size of the UTTC particles is 5–6 µm according to the in situ FSSP measurement. 20
For particles with this size the lidar back-scattering ratio of 1 ppbv of ice ranges from 0.04 to 0.2, depending on the aspect ratio (ratio between the axes perpendicular and parallel to the rotational symmetry). This leads to an ice water content of 5 to 25 ppbv for a cloud with backscattering ratio of unity at 1064 nm. For the observed UTTCs with R1064aer = 1 − 7, this results in about 25–170 ppbv of H2O that condensed as ice 25
(for aspherical particles with aspect ratio= 0.5) or 5–70 ppbv (for nearly spherical or oblate particles). The same cloud was also sampled by the in situ instruments (Fig. 5), showing an ice water content of 40–100 ppbv. The ice water content of 25–170 ppbv
ACPD
3, 1557–1578, 2003 Ultrathin Tropical Tropopause Clouds (UTTCs), Part I Th. Peter et al. Title Page Abstract Introduction Conclusions References Tables Figures J I J I Back Close Full Screen / EscPrint Version
Interactive Discussion
c
EGU 2003
obtained from the lidar measurements, consistent with the in situ data, provided an aspect ratio of 0.5 for the ice particles is assumed. A more spherical shape (aspect ratio > 0.5) would lead to less ice water content. The analysis above suggests that the ice particles with r ≈ 5 µm may have a highly non-spherical shape. In the flight on 27 February 1999, even lower aerosol lidar backscatter ratios at 1064 nm (1–2) over a 5
larger area were found, indicating that the ice water content can be as low as 25 ppbv. Hence, the three independent instruments agree with each other within a factor of 2.5, providing strong evidence that the total amount of condensed phase water is very small, 25–100 ppbv.
4. Conclusions
10
UTTCs have the following characteristics: (i) the coverage of these clouds was found to be high (31%) during the APE-THESEO campaign in February/March 1999 in the western Indian Ocean; (ii) the vertical thickness of UTTCs are only 200–300 m; (iii) they reside only a few hundred meters below the cold point tropopause; (iv) their horizontal extent may reach thousands of square kilometers; (v) the inside of the cloud layer is 15
characterized by a high degree of homogeneity; (vi) they consist of water ice particles with a condensed matter in the cloud particles of 25–100 ppbv H2O, corresponding to only 1–5% of the total available water vapor; (vii) ice crystal radii are 5–6 µm, number densities 5-10 L−1.
The high degree of homogeneity, the large geographic extent and the faint nature of 20
UTTCs requires a stabilization mechanism, which is not necessary or known for other kinds of clouds. This is treated in detail in the companion paper (Luo et al., 2003b). The unique combination of high altitude and low number density makes UTTCs highly suited to serve as drying agent during the last step of dehydration of air directly before troposphere-to-stratosphere exchange. Luo et al. (2003a) investigate the conditions 25
under which UTTCs serve this purpose. They conclude, that UTTCs are likely to yield a lowering of 0.35 ppmv of H2O in the air exchanged from the troposphere to the
strato-ACPD
3, 1557–1578, 2003 Ultrathin Tropical Tropopause Clouds (UTTCs), Part I Th. Peter et al. Title Page Abstract Introduction Conclusions References Tables Figures J I J I Back Close Full Screen / EscPrint Version
Interactive Discussion
c
EGU 2003
sphere in the tropics.
Acknowledgement. We are grateful to S. Balestri (APE) and H. Finkenzeller (DLR) for their
organizational and infra-structural work, without which the campaign would not have taken place. We thank the pilots on both aircraft, M. Scherdel, S. Grillenbeck, O. Chtchepetkov and A. Bestchastnov, for their extremely flexible approach to even the most difficult tasks. Further we
5
thank G. Faure (Director General of Civil Aviation) and A. Volcere (Airport Manager – operations – DCA Seychelles) of the Seychelles Airport authorities for their unbureaucratic support in all phases of the campaign. We are grateful to A. Tompkins at ECMWF and Marcia Baker at the University of Washington for fruitful discussions. Finally, we thank the European Commission for funding the APE-THESEO campaign, and several national agencies for additional support.
10
References
Carslaw, K. S., Wirth, M., Tsias, A., Luo, B. P., D ¨ornbrack, A., Leutbecher, M., Volkert, H., Renger, W., Bacmeister, J. T., and Peter, Th.: Particle microphysics and chemistry in re-motely observed mountain polar stratospheric clouds, J. Geophys. Res., 100, 5785–5796, 1998.
15
Danielsen, E. F.: A dehydration mechanism for the stratosphere, Geophys. Res. Lett. 9, 605– 608, 1982.
Gettelman A., Holton, J. R., and Douglass, A. R.: Simulations of water vapor in the lower stratosphere and upper troposphere, J. Geophys. Res., 105, 9003–9023, 2000.
Hervig, M. and McHugh, M.: Tropical Nitric Acid Clouds, Geophys. Res. Lett., 29,
20
10.1029/2001GL014271, 2002.
Heymsfield, A. J.: Ice particles observed in a cirriform cloud at −85◦C and implications for polar stratospheric clouds, J. Atmos. Sci., 43, 851–855, 1986.
Heymsfield, A. J. and McFarquhar, G. M.: high albedos of cirrus in the tropical Pacific warm pool: Microphysical interpretations from CEPEX and from Kwajalein, Marshall islands, J.
25
Atmos. Sci., 53, 2424–2445, 1996.
Jensen, E. J., Toon, O. B., Pfister, L., and Selkirk, H. B.: Dehydration of the upper troposphere and lower stratosphere by subvisible cirrus clouds near the tropical tropopause, Geophys. Res. Lett., 23, 825–828, 1996.
ACPD
3, 1557–1578, 2003 Ultrathin Tropical Tropopause Clouds (UTTCs), Part I Th. Peter et al. Title Page Abstract Introduction Conclusions References Tables Figures J I J I Back Close Full Screen / EscPrint Version
Interactive Discussion
c
EGU 2003 Jensen, E. J., Pfister, L., Ackerman, A. S., Toon, O. B., and Tabazadeh, A.: A conceptual
model of the dehydration of air due to freeze-drying by optically thin, laminar cirrus rising slowly across the tropical tropopause, J. Geophys. Res., 106, 17 237–17 252, 2001.
Lohmann, U. and Roeckner, E.: Influence of cirrus cloud radiative forcing on climate and climate sensitivity in a general circulation model, J. Geophys. Res., 100, 16 305–16 324, 1995.
5
Luo, B. P., Peter, Th., Fueglistaler, S., Wernli, H., Wirth, M., Kiemle, C., Flentje, H., Yushkov, V. A., Khattatov, V., Rudakov, V., Thomas, A., Borrmann, S., Toci, G., Mazzinghi, P., Beuer-mann, J., Schiller, C., Cairo, F., Di Donfrancesco, G., Adriani, A., Volk, C.M., Strom, J., Noone, K., Mitev, V., MacKenzie, R. A., Carslaw, K. S., Trautmann, T., Santacesaria, V., and Stefanutti, L.: Dehydration potential of ultrathin clouds at the tropical tropopause, Geophys.
10
Res. Lett., submitted, 2003a.
Luo, B. P., Peter, Th., et al.: Ultrathin Tropical Tropopause Clouds (UTTCs): II. Stabilization and Destabilization Mechanisms, Atmos. Chem. Phys. Disc., 3, 1579–1597, 2003b.
Mishchenko, M. I.: Light scattering by randomly oriented axially symmetric particles, J. Opt. Soc. Am., 8, 871–882, 1991.
15
McFaquhar, G. M., Heymsfield, A. J., Spinhirne, J., and Hart, B.: Thin and subvisual tropopause tropical cirrus: Observations and radiative impacts, J. Atmos. Sci., 57, 1841–1853, 2000. Omar, A. H. and Gardner, C. S.: Observation by the Lidar In-Space Technology Experiment
(LITE) of high altitude cirrus clouds over the equator in regions exhibiting extremely cold temperatures, J. Geophys. Res., 106, 1227–1236, 2001.
20
Peter, Th., Meilinger, S. K., and Carslaw, K. S.: Quasi-Lagrangian Measurements of Clouds at and above the Tropopause, SPARC Newsletter No. 12, 2000.
Santacesaria, V., Carla, R., MacKenzie, R.A., Adriani, A., Cairo, F., Didonfrancesco, G., Kiemle, C., Redaelli, G., Beuermann, J., Schiller, C., Peter, Th., Luo, B. P., Wernli, H., Ravegnani, F., Ulanovsky, A., Yushkov, V., Sitnikov, N., Balestri, S., and Stefanutti, L.: Clouds at the
trop-25
ical tropopause: a case study during the APE-THESEO campaign over the western Indian Ocean, J. Geophys. Res., 108, D2, 4044, doi:10.1029/2002JD002166, 2003.
Sassen, K., Griffin, M. K., and Dodd, G. C.: Optical-scattering and microphysical properties of subvisual cirrus clouds, and climate implications, J. Appl. Meteorol., 28, 91–98, 1989. Sherwood, S. C.: A stratospheric “drain” over the maritime continent, Geophys. Res. Lett., 27,
30
677–680, 2000.
Sherwood, S. C. and Dessler, A. E.: On the control of stratospheric humidity, Geophy. Res. Lett., 27, 2513–2516, 2000.
ACPD
3, 1557–1578, 2003 Ultrathin Tropical Tropopause Clouds (UTTCs), Part I Th. Peter et al. Title Page Abstract Introduction Conclusions References Tables Figures J I J I Back Close Full Screen / EscPrint Version
Interactive Discussion
c
EGU 2003 Sherwood, S. C.: A Microphysical Connection Among Biomass Burning, Cumulus Clouds, and
Stratospheric Moisture, Science, 295, 1272–1275, 2002.
Stefanutti, L., Sokolov, L., Balestri, S., MacKenzie, A. R., and Khattatov, V.: The M-55 Geophys-ica as a platform for the Airborne Polar Experiment Jour. Ocean Atm. Tech., 16, 1303–1312, 1999.
5
Thomas, A., Borrmann, S., Kiemle, Ch., Cairo, F., Volk, M., Beuermann, J., Lepuchov, B., Santacesaria, V., Matthey, R., Rudakov, V., Yushkov, V., MacKenzie, A. R., and Stefanutti, L.: In-situ measurements of background aerosol and subvisible cirrus in the tropical tropopause region, J. Geophys. Res., 107, D24, 4763, doi:10.1029/2001JD001385, 2002.
Wang, P. H., Minnis, P., McCormick, M. P., Kent, G. S., Yue, G. K., Young, D. F., and Skeens, K.
10
M.: A study of the vertical structure of tropical ( 20◦S–20◦N) optically thin clouds from SAGE II observations, Atmos. Res., 47–48, 599–614, 1998.
Winker, D. M. and Trepte, C. R.: Laminar cirrus observed near the tropical tropopause by LITE, Geophys. Res. Lett. 25, 3351–3354, 1998.
Wirth, M. and Renger, W.: Evidence of large scale ozone depletion within the Arctic polar vortex
15
ACPD
3, 1557–1578, 2003 Ultrathin Tropical Tropopause Clouds (UTTCs), Part I Th. Peter et al. Title Page Abstract Introduction Conclusions References Tables Figures J I J I Back Close Full Screen / EscPrint Version
Interactive Discussion
c
EGU 2003 Table 1. Statistics of the total of 19 h of OLEX in-flight observations covering some 14 000 km
of flight distance. Clouds which are optically so thick that it cannot be judged whether or not a UTTC is above the cloud are not included in this statistics
19 h of airborne aerosol lidar observations Fraction of observations Thicker cirrus (visible or SVC) without UTTCs 40%
Thicker cirrus and UTTCs 19%
Only UTTCs, no thicker cirrus 12%
ACPD
3, 1557–1578, 2003 Ultrathin Tropical Tropopause Clouds (UTTCs), Part I Th. Peter et al. Title Page Abstract Introduction Conclusions References Tables Figures J I J I Back Close Full Screen / EscPrint Version
Interactive Discussion
c
EGU 2003 Peter et al., Fig.1
Fig. 1. Sketch of flight strategy of the Falcon (below 12 km) and the Geophysica (up to 21 km). Both aircraft can travel at the same speed. On line evaluation of the Falcon lidar measurements allows to maneuver the Geophysica into extremely thin clouds, e.g. the UTTC shown at 17 km, which remain invisible to the Geophysica pilot.
ACPD
3, 1557–1578, 2003 Ultrathin Tropical Tropopause Clouds (UTTCs), Part I Th. Peter et al. Title Page Abstract Introduction Conclusions References Tables Figures J I J I Back Close Full Screen / EscPrint Version
Interactive Discussion
c
EGU 2003
Peter et al., Fig.2
5°S
E
A
G
B
F
D
C
10°S
45°E 50°E 55°E
Fig. 2. Meteosat cloud image of western Indian ocean on 24 February 1999 showing a tropical thunderstorm centered at 8◦S 46◦E, about 1000 km southwest of the Seychelles at 5◦S 55◦E (point A). Colors indicate brightness temperatures (i.e. approximately the temperature at the altitude below which the cloud becomes optically thick in the infrared): pink below 213 K; light blue below 208 K; dark blue below 203 K. Yellow and red line: tandem flight path of Falcon and Geophysica (except excursion to point E: Falcon only). Red flight legs: UTTCs detected remotely by Falcon lidar or in situ onboard Geophysica. Yellow flight legs: UTTCs either not present (parts between A and B and around E) or not detectable because of technical reasons (heavy precipitation between B and C, window icing between F and G). UTTCs cover a region of ∼ 105km2(D-E-F-G and on the way from A to B) and persist at least 3 h (around F).
ACPD
3, 1557–1578, 2003 Ultrathin Tropical Tropopause Clouds (UTTCs), Part I Th. Peter et al. Title Page Abstract Introduction Conclusions References Tables Figures J I J I Back Close Full Screen / EscPrint Version
Interactive Discussion
c
EGU 2003 Peter et al., Fig.3
20 km 18 16 14 12 A G F E C B D
Fig. 3. Aerosol backscatter ratio at 1064 nm (i.e. Raer = R1064− 1= the backscatter coefficient of aerosol divided by that of cloud-free air) measured by OLEX on the Falcon on the same flight as in Fig. 2. Measurement curtain from 12 to 20 km altitude. Periods with no measurements (either due to heavy precipitation in the vicinity of the Cb or due to window icing) are marked by gray vertical lines. The Geophysica flight path is marked as black curve. Geophysica followed the Falcon initially with 30–45 min delay, but after a northward excursion of the Falcon (to E) was flying exactly above it (from F on within a few tens of meters in the horizontal direction).
ACPD
3, 1557–1578, 2003 Ultrathin Tropical Tropopause Clouds (UTTCs), Part I Th. Peter et al. Title Page Abstract Introduction Conclusions References Tables Figures J I J I Back Close Full Screen / EscPrint Version
Interactive Discussion
c
EGU 2003
Peter et al., Fig.4
C U T T A U U C S
A B C D F G A
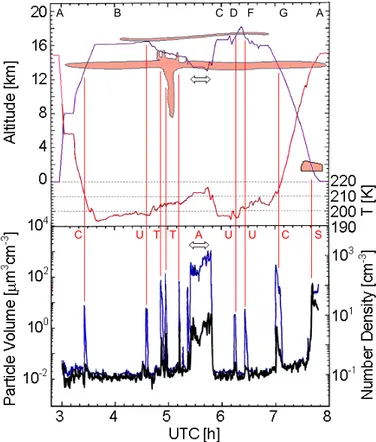
Fig. 4. In-situ measurements onboard Geophysica on 24 February 1999, same flight as in Figs. 2 and 3. Upper panel: flight altitude and temperature with a sketch of the cloud pattern as derived from the remote and in situ measurements. Lower panel: FSSP-300 particle volume (blue curve) and particle number density (black curve). Marks A-G in upper panel are equivalent to Figs. 2 and 3. Marks in lower panel: C= cirrus; U = UTTC; T = cumulonimbus turret; A = cirrus anvil; S= stratus cloud.
ACPD
3, 1557–1578, 2003 Ultrathin Tropical Tropopause Clouds (UTTCs), Part I Th. Peter et al. Title Page Abstract Introduction Conclusions References Tables Figures J I J I Back Close Full Screen / EscPrint Version
Interactive Discussion
c
EGU 2003 Peter et al., Figure 5
13
14
15
16
17
18
19
altitude [km]
13
14
15
16
17
18
19
altitude [km]
A
0.2
0.7
2.3
7.8
26.5
90.0
R
10640
50
100
150
200
distance [km]
1.0
1.5
2.0
2.5
3.0
3.5
4.0
H2O [ppmv]
B
0
50
100
150
200
distance [km]
0.01
0.10
1.00
10.00
volume [um
3/cm
3]
Fig. 5. Simultaneous lidar and in situ measurements of the UTTCs between points D and F in Fig. 3. Panel A: the cloud lidar backscattering ratio at 1064 nm. The black line shows the flight route of the Geophysica aircraft. Panel B: in situ measurements on board of Geophysica. Dashed line: volume in condensed phase measured by the FSSP-300. Solid line: total water measured by the hygrometer FISH (which oversamples particulate water by a factor of 5).
ACPD
3, 1557–1578, 2003 Ultrathin Tropical Tropopause Clouds (UTTCs), Part I Th. Peter et al. Title Page Abstract Introduction Conclusions References Tables Figures J I J I Back Close Full Screen / EscPrint Version
Interactive Discussion
c
EGU 2003 Peter et al., Figure 6
Fig. 6. Particle size distributions as function of (equivalent sphere) radius r measured by the FSSP-300 on board of Geophysica on 24 February 1999. Open squares: measurements inside UTTCs from several cloud encounters (see Fig. 4 and Fig. 3 between points D and F). Lines without symbol: background aerosols in the immediate vicinity below or above UTTCs.
ACPD
3, 1557–1578, 2003 Ultrathin Tropical Tropopause Clouds (UTTCs), Part I Th. Peter et al. Title Page Abstract Introduction Conclusions References Tables Figures J I J I Back Close Full Screen / EscPrint Version
Interactive Discussion
c
EGU 2003 Peter et al., Figure 7
0
1
2
3
4
5
6
radius [
µ
m]
0.6
0.8
1.0
1.2
1.4
aspect ratio
0
1
2
3
4
5
6
radius [
µ
m]
0.6
0.8
1.0
1.2
1.4
aspect ratio
0.03
0.05
0.10
0.17
0.31
0.56
1.00
R
1064per ppbv H
2O
UTTCsFig. 7. Aerosol lidar backscattering ratio of 1 ppbv H2O condensed as ice particles with radius and asphericity as indicated on the axes (aspect ratio defined as ratio between the axes per-pendicular and parallel to the rotational symmetry). The aerosol backscatter is calculated by using the T-matrix method (Mishchenko, 1991) assuming that the particles are spheroids. The backscattering ratio can be scaled to other ice water content by just multiplying the scale shown in the right hand side by the amount of the actual ice water content in ppbv. The radius given here is the mode radius (equivalent sphere) of a lognormal size distribution with mode width