HAL Id: hal-00301364
https://hal.archives-ouvertes.fr/hal-00301364
Submitted on 12 Nov 2003HAL is a multi-disciplinary open access
archive for the deposit and dissemination of sci-entific research documents, whether they are pub-lished or not. The documents may come from teaching and research institutions in France or abroad, or from public or private research centers.
L’archive ouverte pluridisciplinaire HAL, est destinée au dépôt et à la diffusion de documents scientifiques de niveau recherche, publiés ou non, émanant des établissements d’enseignement et de recherche français ou étrangers, des laboratoires publics ou privés.
Measurements of the sum of HO2NO2 and CH3O2NO2
in the remote troposphere
J. G. Murphy, J. A. Thornton, P. J. Wooldridge, D. A. Day, R. S. Rosen, C.
Cantrell, R. E. Shetter, B. Lefer, R. C. Cohen
To cite this version:
J. G. Murphy, J. A. Thornton, P. J. Wooldridge, D. A. Day, R. S. Rosen, et al.. Measurements of the sum of HO2NO2 and CH3O2NO2 in the remote troposphere. Atmospheric Chemistry and Physics Discussions, European Geosciences Union, 2003, 3 (6), pp.5689-5710. �hal-00301364�
ACPD
3, 5689–5710, 2003 Measurements of the sum of HO2NO2 and CH3O2NO2 J. G. Murphy et al. Title Page Abstract Introduction Conclusions References Tables Figures J I J I Back CloseFull Screen / Esc
Print Version Interactive Discussion
© EGU 2003 Atmos. Chem. Phys. Discuss., 3, 5689–5710, 2003
www.atmos-chem-phys.org/acpd/3/5689/ © European Geosciences Union 2003
Atmospheric Chemistry and Physics Discussions
Measurements of the sum of HO
2
NO
2
and
CH
3
O
2
NO
2
in the remote troposphere
J. G. Murphy1, J. A. Thornton11, *, P. J. Wooldridge1, D. A. Day1, R. S. Rosen1, C. Cantrell2, R. E. Shetter2, B. Lefer2, and R. C. Cohen1, 3, 4
1
University of California at Berkeley, Department of Chemistry, Berkeley, CA, USA 2
National Center for Atmospheric Research, Atmospheric Chemistry Division, Boulder, CO, USA
3
University of California at Berkeley, Department of Earth and Planetary Science, Berkeley, CA, USA
4
Lawrence Berkeley National Laboratory, Division of Energy and Environment Technologies, Berkeley, CA, USA
*
now at University of Toronto, Department of Chemistry, Toronto, ON, Canada Received: 16 September 2003 – Accepted: 3 November 2003 – Published: 12 November 2003
ACPD
3, 5689–5710, 2003 Measurements of the sum of HO2NO2 and CH3O2NO2 J. G. Murphy et al. Title Page Abstract Introduction Conclusions References Tables Figures J I J I Back CloseFull Screen / Esc
Print Version Interactive Discussion
© EGU 2003
Abstract
The chemistry of peroxynitric acid (HO2NO2) and methyl peroxynitrate (CH3O2NO2) is predicted to be particularly important in the upper troposphere where temperatures are frequently low enough that these compounds do not rapidly decompose. At tem-peratures below 240 K, we calculate that about 20% of NOy in the mid and polar
lati-5
tude upper troposphere is HO2NO2. Under these conditions, the reaction of OH with HO2NO2is estimated to account for as much as one third of the permanent loss of hy-drogen radicals. During the Tropospheric Ozone Production about the Spring Equinox (TOPSE) campaign, we used thermal dissociation laser-induced fluorescence (TD-LIF) to measure the sum of peroxynitrates (ΣPNs ≡ HO2NO2 + CH3O2NO2+ PAN + PPN
10
+ ...), aboard the NCAR C-130 research aircraft. We infer the sum of HO2NO2 and
CH3O2NO2 as the difference between ΣPN measurements and gas chromatographic measurements of the two major peroxy acyl nitrates, peroxy acetyl nitrate (PAN) and peroxy propionyl nitrate (PPN). Comparison with NOy and other nitrogen oxide mea-surements confirms the importance of HO2NO2and CH3O2NO2 to the reactive
nitro-15
gen budget and shows that current thinking about the chemistry of these species is approximately correct. The temperature dependence of the inferred concentrations corroborates the contribution of overtone photolysis to the photochemistry of peroxyni-tric acid.
1. Introduction
20
Reactions of hydrogen radicals (HOx≡ OH+ HO2, and RO2) and nitrogen radicals
(NOx≡ NO+ NO2) affect atmospheric composition and climate by regulating global
tropospheric ozone and the Earth’s oxidative capacity. Peroxynitrates (RO2NO2) link these chemical families, thereby influencing tropospheric ozone production and the abundance of OH in both the troposphere and stratosphere. Non-acyl peroxynitrates
25
ACPD
3, 5689–5710, 2003 Measurements of the sum of HO2NO2 and CH3O2NO2 J. G. Murphy et al. Title Page Abstract Introduction Conclusions References Tables Figures J I J I Back CloseFull Screen / Esc
Print Version Interactive Discussion
© EGU 2003 240 K, because the molecules are very weakly bound (∼95 kJ/mol) and rapidly
disso-ciate at higher temperature. Consequently these molecules are most important in the stratosphere and upper troposphere.
Knowledge of the chemistry of alkyl RO2NO2 species is limited because they are difficult to isolate in the laboratory or to observe directly in the atmosphere. Remote
5
sensing measurements of peroxynitric acid concentrations in the stratosphere show that HO2NO2mixing ratios peak at approximately 200 ppt near 27 km altitude (Rinsland et al., 1996; Rinsland et al., 1986; Sen et al., 1998). The only other measurements are from the Antarctic surface where Slusher et al. (2001) used chemical ionization mass spectrometry to observe HO2NO2 mixing ratios on the order of 20 ppt, showing they
10
were nearly equal to nitric acid mixing ratios. Recent OH and HO2 measurements made in the lower stratosphere at high solar zenith angles (SZA) indicate that there is a source of HOx that dissociates following absorption of low energy photons (Salaw-itch et al., 1994; Wennberg et al., 1999). Overtone photodissociation of HO2NO2, as suggested by Donaldson et al. (1997), can explain these observations and some of the
15
temporal variability seen in remote sensing of HO2NO2(Salawitch et al., 2002). These observations and calculations of HO2NO2abundances and their effect on stratospheric HOx have been the impetus for revisiting the long-wavelength photolysis and kinetics of peroxynitrates in the laboratory (Knight et al., 2002; Roehl et al., 2002; Zhang et al., 2000).
20
Here we describe the first in situ measurements of these peroxynitrates in the free troposphere. The measurements were made during the Tropospheric Ozone Produc-tion about the Spring Equinox (TOPSE) experiment (Atlas et al., 2003). Analysis along chemical coordinates (Cohen et al., 2000), in this case temperature and NO2, and con-sideration of the NOybudget are used to evaluate current understanding of photolytic
25
ACPD
3, 5689–5710, 2003 Measurements of the sum of HO2NO2 and CH3O2NO2 J. G. Murphy et al. Title Page Abstract Introduction Conclusions References Tables Figures J I J I Back CloseFull Screen / Esc
Print Version Interactive Discussion
© EGU 2003
2. Instrumentation
NOy and its components were measured from the NCAR C-130 aircraft during the TOPSE experiment. Ridley et al. measured NO, NO2 and NOy by conversion to NO followed by O3+ NO chemiluminescence (Ridley et al., 2000). The NO2measurements were precise to ±4 ppt and accurate to 5%. C1–C4 alkyl nitrates were quantified by GC
5
analysis of whole air samples (Blake et al., 2003). In our analysis, the sum of C1–C4 alkyl nitrate observations was linearly interpolated to a 1 min time base. Nitric acid was measured using a mist chamber followed by ion chromatography (Talbot et al., 1990). PAN and PPN were measured in situ by the NCAR Gas Chromatography with Elec-tron Capture Detection (GC-ECD) instrument (The behavior of PANs and the balance
10
of NOy during TOPSE, Flocke et al., in prep). The PAN and PPN measurements rep-resent 1–3 s samples with a precision of ±5 ppt at 20 ppt, ±3 ppt at 100 ppt, ±5–7 ppt at 500 ppt. The accuracy of the PAN and PPN measurements is 10%. Because they were made with the same instrument, we assume their uncertainties are correlated, that is, if necessary, both could be brought to the “true” value by multiplying by a single
15
constant. During a 5 min interval, two PAN measurements and one PPN are obtained. A two-channel thermal dissociation laser-induced fluorescence (TD-LIF) instrument was used for observations of total peroxynitrates (ΣPNs ≡ PAN+ PPN + HO2NO2+ CH3O2NO2+ ...) and of NO2. TD-LIF is described in
detail in Day et al. (2002). The specific instrument configuration used during TOPSE
20
is presented by Thornton (2002). Briefly, TD-LIF relies on a heated inlet to dissociate RO2NO2 to yield NO2 and RO2. The resultant NO2 is quantified along with ambient NO2 using laser-induced fluorescence (LIF). By operating the heated inlet in parallel with an inlet maintained at ambient temperature, ΣPN mixing ratios can be derived from the difference between the NO2signals of the two channels. The first third of the
25
campaign was used to test and improve some aspects of instrument performance. High time resolution measurements of NO2 and ΣPNs were obtained simultaneously and continuously during the final nineteen flights of the TOPSE experiment. The
ACPD
3, 5689–5710, 2003 Measurements of the sum of HO2NO2 and CH3O2NO2 J. G. Murphy et al. Title Page Abstract Introduction Conclusions References Tables Figures J I J I Back CloseFull Screen / Esc
Print Version Interactive Discussion
© EGU 2003 precision of the measurements for a 1 min average in each channel under optimal
conditions was ±20 ppt which is dominated by uncertainty in the instrument zero. Under some conditions, usually after steep altitude changes, the apparent precision is ±50 ppt. The accuracy of channel 1 is estimated to be 10% and the accuracy of channel 2 to be 15%. The precision ofΣPNs is given by:
5
σ(ΣPNs)=[(σchannel 1)2+ (σchannel 2)2]1/2 (1)
and for a typical scenario σ(ΣPNs) is ±28 ppt for 1 min averaging. The accuracy is es-timated to be 15% since the accuracy of the two channels is largely correlated and most of the signal is in channel 2. While TD-LIF NO2 measurements were used for calculating ΣPN, in the model calculations below we use the NCAR
photolysis-10
chemiluminescence measurements of NO2 because of their superior precision in the low concentration ranges encountered during TOPSE.
Measurements suggest that PAN is the dominant contribution toΣPNs and that PPN is the only other major acyl peroxynitrate in the air sampled during TOPSE. In order to infer abundances of non-acyl peroxynitrates (hereafter referred to asΣPNs) we subtract
15
speciated measurements of PAN and PPN obtained by the NCAR GC-ECD instrument from the TD-LIF measurements ofΣPNs.
∆PNs=ΣPNs−PAN−PPN. (2)
We averaged 1 min of TD-LIF data about each PAN measurement and interpolated PPN to generate a dataset of all species coincident in time.
20
The uncertainty in ∆PNs has components associated with both the precision and accuracy of the TD-LIF and GC measurements. In what follows, we do not draw any conclusions based on individual measurements, rather our conclusions are based on averages over a large enough sample that uncertainty in mean quantities is entirely a function of the instruments’ accuracies. The techniques are thought to be accurate to
25
10% (GC) and 15% (LIF) and for both techniques one single multiplicative correction (if it could be known) would bring the observed values to the “true” values (to within
ACPD
3, 5689–5710, 2003 Measurements of the sum of HO2NO2 and CH3O2NO2 J. G. Murphy et al. Title Page Abstract Introduction Conclusions References Tables Figures J I J I Back CloseFull Screen / Esc
Print Version Interactive Discussion
© EGU 2003 the precision uncertainty). The accuracy of these instruments depends on a chain of
calibration that connects to NIST traceable reference standards of NO or NO2, on the accuracy of flow controllers used to dilute these standards and on titration reactions. None of these factors depend on environmental parameters. Thus the associated ac-curacy in the average value of a combined quantity like∆PNs adds in quadrature, since
5
the accuracy of the GC and LIF measurements are assumed to be uncorrelated, re-sulting in a combined accuracy of 18%. The random error associated with an individual ∆PNs measurement is obtained by standard propagation of error based on Eq. (2);
σ(∆PNs)=[(σΣPNs)2+ (σPAN)2+ (σPPN)2]1/2, (3)
which results in an uncertainty of ±29 ppt.
10
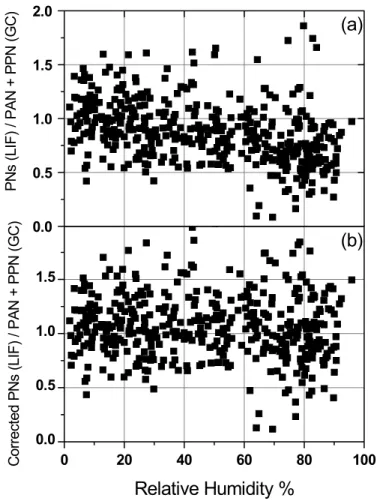
Figure 1a shows the ratio ofΣPNs/(PAN+PPN) versus humidity for data that calcu-lations suggest have negligible amounts of ∆PNs (∆PNs less than 10% of PAN). In contrast to the expectations outlined above, Fig. 1 shows that the two techniques differ by 35% at high relative humidity and agree at low humidity. The absolute difference is larger than expected and the accuracy is not observed to be independent of
environ-15
mental parameters. One or both instruments are not accurate to within the 10 or 15% quoted.
Neither technique is known to have a humidity-dependent bias or interference of this magnitude. Applying a constraint that
∆PNs ≥ 0 (4)
20
permits the derivation of a constant that implicitly couples the calibration constants for the two instruments and corrects for this difference as a function of humidity. A correction factor, C = (1 + 0.0025 * % RH), was generated that brings the average (PAN+ PPN)/ΣPNs near one when ∆PNs are insignificant. Since we have no reason to apply the correction to one or the other instrument, the TD-LIF data was multiplied
25
by the correction factor C, and the GC data was divided by this factor. This removed the humidity bias (Fig. 1b). Throughout the remainder of this paper we use these adjusted
ACPD
3, 5689–5710, 2003 Measurements of the sum of HO2NO2 and CH3O2NO2 J. G. Murphy et al. Title Page Abstract Introduction Conclusions References Tables Figures J I J I Back CloseFull Screen / Esc
Print Version Interactive Discussion
© EGU 2003 datasets. Applying the factor C to the two data sets alters them by 12% on average
(+12% ΣPNs and −12% PAN and PPN). Using Eq. (2) with the corrected datasets provides 1433 measurements of∆PNs, which calculations suggest are predominantly HO2NO2and CH3O2NO2. We estimate the uncertainty in∆PNs is 25%.
Measurements of NOy and comparison to the sum of individual NOy compounds
5
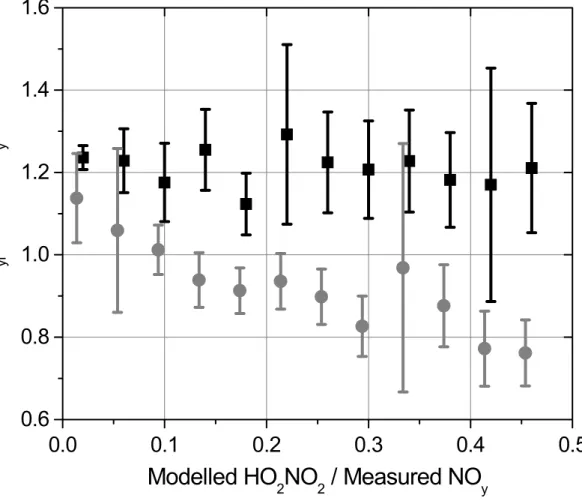
(ΣNOy) provide another means to evaluate the relative calibration of the GC-ECD, TD-LIF and NOy techniques, as well as our ability to infer ∆PNs from the adjusted dif-ference of the two sets of measurements. Figure 2 demonstrates the importance of HO2NO2in the reactive nitrogen budget and the ability of TD-LIF∆PN measurements to account for this compound. The ratioΣNOyi/total NOy, with the above correction
ap-10
plied to each peroxynitrate dataset, is plotted against fraction of NOy that is predicted by a model to be HO2NO2. The ratio where ΣNOyi = NOx+ HNO3 + ΣANs + PAN + PPN (gray circle) decreases from a value of 1.2 where∆PNs are insignificant to close to 0.8 where HO2NO2 contributes nearly half of total NOy. Conversely, the NOy bud-get using TD-LIF measurementsΣNOyi= NOx+ HNO3+ ΣANs + ∆PN (black square)
15
suggests that our measurements account for the predicted contribution of HO2NO2 to the reactive nitrogen budget. If the modelled ∆PNs are added to the PAN and PPN measurements, the averageΣNOyi/total NOy ratio over the whole campaign is 1.2.
3. Model description and comparison to observations
Peroxynitrates are formed when an RO2 radical (where R = H, alkyl, or acyl group)
20
reacts with NO2 (R5). In the remote atmosphere, HO2 and CH3O2 make up a large fraction of RO2. Sinks of HO2NO2 and CH3O2NO2 include thermal decomposition (R6), photolysis (R7), and for HO2NO2, reaction with OH (R8). Note that the products given for (R8) have not been measured. Models all assume that water is a product of (R8) and consequently that (R8) is a sink for HOx radicals.
25
ACPD
3, 5689–5710, 2003 Measurements of the sum of HO2NO2 and CH3O2NO2 J. G. Murphy et al. Title Page Abstract Introduction Conclusions References Tables Figures J I J I Back CloseFull Screen / Esc
Print Version Interactive Discussion © EGU 2003 RO2NO2+ M → RO2+ NO2+ M (6) RO2NO2+ hν → RO2+ NO2 (7a) or → RO+ NO3 (7b) HO2NO2+ OH → H2O+ NO2+ O2. (8)
Uncertainties associated with this chemistry are large. For example, for the thermal
5
decomposition of HO2NO2 the JPL panel recommends an uncertainty factor of 5 at 298 K and of 13 at 230 K (Sander et al., 2003). Recent laboratory measurements of the UV (Knight et al., 2002) and IR (Roehl et al., 2002) cross sections of peroxynitric acid greatly improve our understanding of its photolysis rate, (J≡R7), although the tem-perature and pressure dependencies of the quantum yield require further investigation.
10
We know little about the photolysis of CH3O2NO2.
We use an instantaneous steady state model representing (R5)–(R8) to predict the abundances of HO2NO2and CH3O2NO2.
[HO2NO2]SS= k5[HO2][NO2][M]
k6[M]+ J + k8[OH] (9)
[CH3O2NO2]SS=k50[CH3O2][NO2][M]
k60[M]+ J0
. (10)
15
Measurements of NO2, the spectrally resolved actinic flux, temperature, and pressure are used in the calculations. As a result of the low mixing ratios of NO2 (50% of the observations have NO2 below 11 ppt) the precision of the model calculations are roughly proportional to the precision of the NO2 measurements, for example ±40% at 10 ppt NO2. Although OH and HO2 were measured during the TOPSE campaign,
20
the observations were too infrequent to use in the model. Steady state concentrations of OH, HO2, and CH3O2 were calculated using the photochemical model described by Cantrell et al. (2003), which included the steady state equations for HO2NO2 and
ACPD
3, 5689–5710, 2003 Measurements of the sum of HO2NO2 and CH3O2NO2 J. G. Murphy et al. Title Page Abstract Introduction Conclusions References Tables Figures J I J I Back CloseFull Screen / Esc
Print Version Interactive Discussion
© EGU 2003 CH3O2NO2. Four individual calculations in which radicals and reservoirs were solved
self-consistently were used to investigate the main sources of uncertainty in the kinetics of HO2NO2. Rate constants used in the model are from the JPL-2000 recommenda-tions except for the self-reaction of HO2(Christensen et al., 2002) and for the reaction HO2+ O3 and OH+ O3 for which we use JPL-97 recommendations (see Lanzendorf
5
et al., 2001). Photolysis rates were determined using measured actinic flux and made use of the recent molecular data for H2CO (Smith et al., 2002) and HO2NO2 (Knight et al., 2002; Roehl et al., 2002). The UV cross section of CH3O2NO2 is assumed to be equal to that of HO2NO2, and we assume it has no infrared component because it lacks the OH group required for significant IR overtone photodissociation. In the first
10
calculation (Model A), the IR photolysis rate of HO2NO2 is set at 1 × 10⁻⁵s−1, slightly higher than the recommendation of 8.3×10⁻⁶s−1from Roehl et al., which was given for a system with no albedo. In a second calculation (Model B), the IR photolysis rate for HO2NO2was set to zero. In two separate calculations, the rate of thermal decomposi-tion of HO2NO2 was varied to the maximum (Model C) and minimum (Model D) limits
15
given in JPL-2003. Model A, with standard thermal decomposition and IR photolysis, calculates peak HO2NO2and CH3O2NO2mixing ratios during the last 19 flights of the TOPSE experiment that range as high as 300 ppt and 100 ppt respectively. It predicts HO2NO2 reaching as much as 50% of measured NOy and CH3O2NO2 as much as 15% of measured NOy.
20
Figure 3 depicts the temperature dependence of the thermal and photochemical sinks of these two peroxynitrates. The photochemical sinks (R7 and R8) are nearly independent of temperature. HO2NO2has a slower thermal decomposition rate and a faster photochemical loss than CH3O2NO2because of its large infrared photodissocia-tion cross secphotodissocia-tion and because its reacphotodissocia-tion with OH also contributes to photochemical
25
loss. For HO2NO2, thermal decomposition becomes faster than the photochemical sinks above 240 K, while the crossing point for CH3O2NO2is near 220 K. One conse-quence of this is that the lifetime of HO2NO2(∼12 h in sunlit conditions) is independent of temperature for the colder conditions sampled during TOPSE.
ACPD
3, 5689–5710, 2003 Measurements of the sum of HO2NO2 and CH3O2NO2 J. G. Murphy et al. Title Page Abstract Introduction Conclusions References Tables Figures J I J I Back CloseFull Screen / Esc
Print Version Interactive Discussion
© EGU 2003 The instantaneous steady state model is valid only when the lifetime of the HO2NO2
or CH3O2NO2 is short compared to the rate of change of its sources and sinks. This is not always true for these peroxynitrates under the coldest conditions sampled during TOPSE. However, many of the data points were collected at high latitudes during the late spring, where the photochemistry has a fairly shallow diurnal profile, making the
5
model steady state predictions reasonable estimates. To help avoid any bias due to be-ing strongly out of steady state, model results in which the lifetime of either compound exceeded 12 h were discarded, unless there were more than 20 h of sunlight per day at that location.
In the lower panel of Fig. 3, the∆PN concentrations inferred from our observations
10
are displayed versus temperature. The mixing ratios below approximately 250 K are larger than at warmer temperatures. The wide range of concentrations at each tem-perature derives partly from variation in the abundance of HO2, CH3O2 and NO2 rad-icals in the airmass. As an example, the large symbols are the mean∆PNs within a 5 K bin for NO2 mixing ratios above (black squares) and below (open circles) 11 ppt,
15
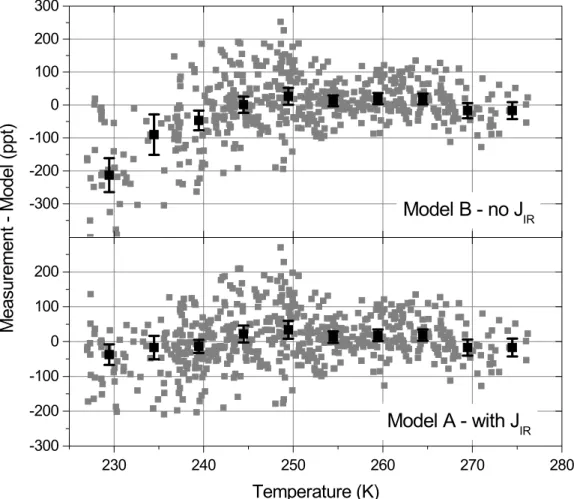
which was the median NO2 during the last 19 flights of TOPSE. On average, higher values of∆PNs were observed when NO2mixing ratios were higher than average and vice versa. In addition to being proportional to NO2, below 250 K∆PNs are calculated to depend strongly on the IR photolysis of HO2NO2, which has only recently been recognized as large enough to affect its atmospheric mixing ratio. Our data provides
20
direct observational evidence for this term. In the upper panel of Fig. 4 we show the difference between the ∆PN observations and model B (no IR photolysis) and in the lower panel we show the difference between ∆PNs and model A. The relative signifi-cance of IR photolysis increases strongly as a function of decreasing temperature and dominates over thermal decomposition as a sink of HO2NO2below 235 K. At 230 K, the
25
model without IR photolysis has, on average, 200 ppt more HO2NO2than the observed ∆PNs. There are specific events where modeled ∆PNs exceed the measurements by 400 ppt without the infrared sink of HO2NO2.
ACPD
3, 5689–5710, 2003 Measurements of the sum of HO2NO2 and CH3O2NO2 J. G. Murphy et al. Title Page Abstract Introduction Conclusions References Tables Figures J I J I Back CloseFull Screen / Esc
Print Version Interactive Discussion
© EGU 2003 The model A peroxynitrate (HO2NO2 + CH3O2NO2) predictions are compared to
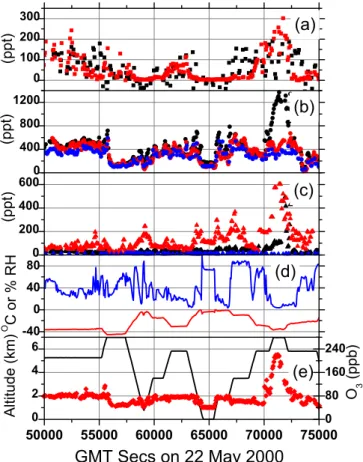
∆PN measurements in a time series during a TOPSE flight on 22 May (Fig. 5 up-per panel). This flight between Thule and Winnipeg sampled a wide range of tropo-spheric conditions and encountered air of mixed stratotropo-spheric-tropotropo-spheric character (O3> 100 ppb) near the end of the flight. HNO3and NOxmake significant contributions
5
to NOy in this particular airmass, which nonetheless has quite high PAN mixing ratios. The ∆PN measurements are generally scattered around the model predictions and tend to be highest under the coldest conditions as expected based on the chemistry described above. During this flight, NOx and∆PNs are nearly equal.
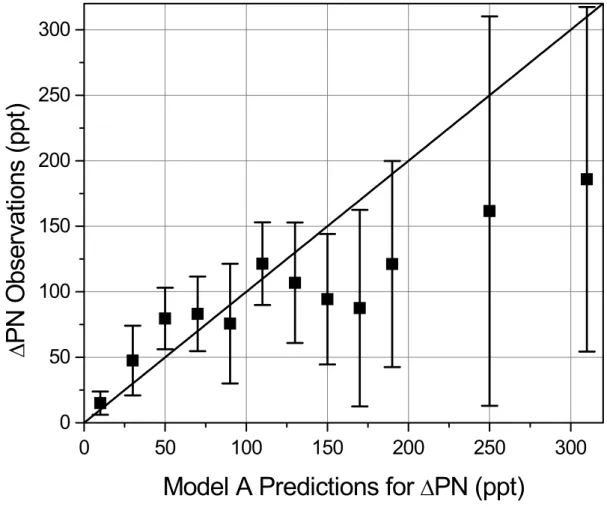
The figures above show that∆PNs vary as expected in response to two of the
indi-10
vidual terms in the steady-state equations (J and NO2) and vary along a flight track as the steady state calculation suggests they should. Figure 6 shows a direct comparison of calculations of∆PNs and the observations. Within the statistical variance, the ob-servations and model agree. However model predictions exceed the obob-servations at higher mixing ratios and the fact that nearly all calculated concentrations above 150 ppt
15
are higher than observations suggests the effect is statistically reliable. If the steady state approximation is correct, then this could indicate an error in the photochemistry of HO2NO2 or the thermal decomposition of CH3O2NO2. We investigated the factor of 5–15 uncertainty in the HO2NO2thermal decomposition rate at temperatures in the 220–298 K range. Model calculations (C, D) that incorporated the most extreme
val-20
ues for rates of thermal decomposition predicted∆PN concentrations that differed at most by 100 ppt, with the greatest effect occurring between 235 and 250 K. Both mod-els were less consistent with the observations than Model A, but because HO2NO2is largest where thermal decomposition is slow compared to photolysis we are unable to define substantially more precise limits on the rate of thermal decomposition than
rec-25
ommended by the JPL panel. We examined other possible effects but found no single explanation that would bring the model-measurement comparison into agreement.
ACPD
3, 5689–5710, 2003 Measurements of the sum of HO2NO2 and CH3O2NO2 J. G. Murphy et al. Title Page Abstract Introduction Conclusions References Tables Figures J I J I Back CloseFull Screen / Esc
Print Version Interactive Discussion
© EGU 2003
4. Discussion
In the upper troposphere, several studies (Folkins et al., 1997; Jaegle et al., 2000; Jaegle et al., 2001) have described calculations indicating that reaction of OH with HO2NO2 is a dominant sink for HOx. Analysis of HOx observations by Faloona et al. (2000) suggest that a model in which the HO2NO2equilibrium constant is reduced
5
by a factor of five, or with HO2NO2 formation suppressed entirely, provides a more accurate representation of upper tropospheric HOx observations than the standard model. We estimate that inclusion of the IR photolysis of HO2NO2should have nearly the same effect on HO2NO2concentrations at the altitudes where most of the observa-tions described by Faloona et al. were collected. The main consequence is a decrease
10
in the modelled abundance of HO2NO2. However, the IR photolysis will have a distinctly different temperature dependence than the suggested change to the equilibrium con-stant. For the coldest conditions sampled during TOPSE, between 220 K and 240 K, Model A, which includes IR photolysis, predicts ∼10% more HOx than Model B, and also results in slightly different HOxpartitioning.
15
Another interesting aspect of HO2NO2and CH3O2NO2chemistry is their behavior as a short-term reservoir for HOx and NOx radicals. Under sunlit conditions, the radicals and alkyl peroxynitrates should reach steady state, yet once the sun sets, formation diminishes and the only remaining sink is thermal decomposition. During 12 h of dark-ness in the upper troposphere at 240 K, all the CH3O2NO2and over half of the HO2NO2
20
will have thermally dissociated, releasing on the order of tens to hundreds ppt of CH3O2 and HO2. The fate of these radicals during the night will depend strongly on the abun-dance of NOxand O3. This fact underscores the importance of making measurements at night to challenge our understanding of radical sources and sinks.
ACPD
3, 5689–5710, 2003 Measurements of the sum of HO2NO2 and CH3O2NO2 J. G. Murphy et al. Title Page Abstract Introduction Conclusions References Tables Figures J I J I Back CloseFull Screen / Esc
Print Version Interactive Discussion
© EGU 2003
5. Conclusions
We describe observations of ∆PNs and demonstrate that they are HO2NO2 and CH3O2NO2. The observations show that during the spring high latitude conditions sampled during the TOPSE experiment, the contribution of∆PNs to NOyis highly tem-perature dependent, with∆PNs on average 30% of NOy at 230 K and 7% of NOy at
5
250 K. The magnitude and observed temperature dependence of the mixing ratios is consistent with recent laboratory evidence that the J value for HO2NO2has a large IR component. Prior analyses of the NOy budget in the upper troposphere that did not take into account HO2NO2or the new J value should be revisited.
Acknowledgements. We thank B. Ridley, F. Flocke, A. Weinheimer, D. Blake, and R. Talbot
10
for use of their TOPSE data. J. G. Murphy acknowledges a NSERC PGS-B fellowship and J. A. Thornton acknowledges a NASA Earth Systems Science Fellowship. This material is based upon work supported by the National Science Foundation under Grant No. 0138669 and through its Office of Polar Programs under Grant No. 9907928.
References
15
Atlas, E. L., Ridley, B. A., and Cantrell, C. A.: The Tropospheric Ozone Production about the Spring Equinox (TOPSE) Experiment: Introduction, J. Geophys. Res.-Atmos., 108, 8353, doi:8310.1029/2002JD003172, 2003.
Blake, N. J., Blake, D. R., Sive, B. C., Katzenstein, A. S., Meinardi, S., Wingenter, O. W., Atlas, E. L., Flocke, F., Ridley, B. A., and Rowland, F. S.: The seasonal evolution of NMHCs and light
20
alkyl nitrates at middle to high northern latitudes during TOPSE, J. Geophys. Res.-Atmos., 108, 8359, doi:8310.1029/2001JD001467, 2003.
Cantrell, C. A., Mauldin, L., Zondlo, M., Eisele, F., Kosciuch, E., Shetter, R., Lefer, B., Hall, S., Campos, T., Ridley, B., Walega, J., Fried, A., Wert, B., Flocke, F., Weinheimer, A., Hannigan, J., Coffey, M., Atlas, E., Stephens, S., Heikes, B., Snow, J., Blake, D., Blake, N., Katzenstein,
25
A., Lopez, J., et al.: Steady state free radical budgets and ozone photochemistry during TOPSE, J. Geophys. Res.-Atmos., 108, 8361, doi:8310.1029/2002JD002198, 2003.
ACPD
3, 5689–5710, 2003 Measurements of the sum of HO2NO2 and CH3O2NO2 J. G. Murphy et al. Title Page Abstract Introduction Conclusions References Tables Figures J I J I Back CloseFull Screen / Esc
Print Version Interactive Discussion
© EGU 2003 Christensen, L. E., Okumura, M., Sander, S. P., Salawitch, R. J., Toon, G. C., Sen, B., Blavier,
J.-F., and Jucks, K. W.: Kinetics of HO2+ HO2to H2O2+ O2: Implications for Stratospheric H2O2, Geophys. Res. Lett., 29, 1299, doi:1210.1029/2001GL014525, 2002.
Cohen, R. C., Perkins, K. K., Koch, L. C., Stimpfle, R. M., Wennberg, P. O., Hanisco, T. F., Lanzendorf, E. J., Bonne, G. P., Voss, P. B., Salawitch, R. J., Del Negro, L. A., Wilson, J.
5
C., McElroy, C. T., and Bui, T. P.: Quantitative constraints on the atmospheric chemistry of nitrogen oxides: An analysis along chemical coordinates, J. Geophys. Res.-Atmos., 105, 24 283–24 304, 2000.
Day, D. A., Wooldridge, P. J., Dillon, M. B., Thornton, J. A., and Cohen, R. C.: A thermal dissoci-ation laser-induced fluorescence instrument for in situ detection of NO2, peroxy nitrates, alkyl
10
nitrates, and HNO3, J. Geophys. Res.-Atmos., 107, 4046, doi:4010.1029/2001JD000779, 2002.
Donaldson, D. J., Frost, G. J., Rosenlof, K. H., Tuck, A. F., and Vaida, V.: Atmospheric radical production by excitation of vibrational overtones via absorption of visible light, Geophys. Res. Lett., 24, 2651–2654, 1997.
15
Faloona, I., Tan, D., Brune, W. H., Jaegle, L., Jacob, D. J., Kondo, Y., Koike, M., Chatfield, R., Pueschel, R., Ferry, G., Sachse, G., Vay, S., Anderson, B., Hannon, J., and Fuelberg, H.: Observations of HOx and its relationship with NOxin the upper troposphere during SONEX, J. Geophys. Res.-Atmos., 105, 3771–3783, 2000.
Folkins, I., Wennberg, P. O., Hanisco, T. F., Anderson, J. G., and Salawitch, R. J.: OH, HO2, and
20
NO in two biomass burning plumes: Sources of HOxand implications for ozone production, Geophys. Res. Lett., 24, 3185–3188, 1997.
Jaegle, L., Jacob, D. J., Brune, W. H., Faloona, I., Tan, D., Heikes, B. G., Kondo, Y., Sachse, G. W., Anderson, B., Gregory, G. L., Singh, H. B., Pueschel, R., Ferry, G., Blake, D. R., and Shetter, R. E.: Photochemistry of HOx in the upper troposphere at northern midlatitudes, J.
25
Geophys. Res.-Atmos., 105, 3877–3892, 2000.
Jaegle, L., Jacob, D. J., Brune, W. H., and Wennberg, P. O.: Chemistry of HOx radicals in the upper troposphere, Atmos Environ, 35, 469–489, 2001.
Knight, G., Ravishankara, A. R., and Burkholder, J. B.: UV absorption cross sections of HO2NO2between 343 and 273 K, Phys Chem Chem Phys, 4, 1432–1437, 2002.
30
Lanzendorf, E. J., Hanisco, T. F., Wennberg, P. O., Cohen, R. C., Stimpfle, R. M., and Anderson, J. G.: Comparing atmospheric [HO2]/[OH] to modeled [HO2]/[OH]: Identifying discrepancies with reaction rates, Geophys. Res. Lett., 28, 967–970, 2001.
ACPD
3, 5689–5710, 2003 Measurements of the sum of HO2NO2 and CH3O2NO2 J. G. Murphy et al. Title Page Abstract Introduction Conclusions References Tables Figures J I J I Back CloseFull Screen / Esc
Print Version Interactive Discussion
© EGU 2003 Ridley, B., Walega, J., Montzka, D., Grahek, F., Atlas, E., Flocke, F., Stroud, V., Deary, J.,
Gallant, A., Boudries, H., Bottenheim, J., Anlauf, K., Worthy, D., Sumner, A. L., Splawn, B., and Shepson, P.: Is the Arctic surface layer a source and sink of NOx in winter/spring?, J Atmos Chem, 36, 1–22, 2000.
Rinsland, C. P., Gunson, M. R., Salawitch, R. J., Michelsen, H. A., Zander, R., Newchurch, M.
5
J., Abbas, M. M., Abrams, M. C., Manney, G. L., Chang, A. Y., Irion, F. W., Goldman, A., and Mahieu, E.: Atmos/Atlas-3 Measurements of Stratospheric Chlorine and Reactive Nitrogen Partitioning Inside and Outside the November 1994 Antarctic Vortex, Geophys. Res. Lett., 23, 2365–2368, 1996.
Rinsland, C. P., R., Z., C.B., F., R.H., N., L.R., B., J.M., R., and J.H., P.: Evidence for the
pres-10
ence of 802.7 cm−1band Q branch of HO2NO2in high-resolution solar absorption-spectra of the stratosphere, Geophys. Res. Lett., 13, 761–764, 1986.
Roehl, C. M., Nizkorodov, S. A., Zhang, H., Blake, G. A., and Wennberg, P. O.: Photodissocia-tion of peroxynitric acid in the near-IR, J. Phys. Chem. A, 106, 3766–3772, 2002.
Salawitch, R. J., Wennberg, P. O., Toon, G. C., Sen, B., and Blavier, J. F.: Near IR photolysis of
15
HO2NO2: Implications for HOx, Geophys. Res. Lett., 29, 1762, 1710.1029/2002GL015006, 2002.
Salawitch, R. J., Wofsy, S. C., Wennberg, P. O., Cohen, R. C., Anderson, J. G., Fahey, D. W., Gao, R. S., Keim, E. R., Woodbridge, E. L., Stimpfle, R. M., Koplow, J. P., Kohn, D. W., Webster, C. R., May, R. D., Pfister, L., Gottlieb, E. W., Michelsen, H. A., Yue, G. K., Prather,
20
M. J., Wilson, J. C., Brock, C. A., Jonsson, H. H., Dye, J. E., Baumgardner, D., Proffitt, M. H., Loewenstein, M., Podolske, J. R., Elkins, J. W., Dutton, G. S., Hintsa, E. J., Dessler, A. E., Weinstock, E. M., Kelly, K. K., Boering, K. A., Daube, B. C., Chan, K. R., and Bowen, S. W.: The Diurnal Variation of Hydrogen, Nitrogen, and Chlorine Radicals - Implications For the Heterogeneous Production of HNO2, Geophys. Res. Lett., 21, 2551–2554, 1994.
25
Sander, S. P., Kurylo, J. M., Orkin, V. L., Golden, D. M., Huie, R. E., Finlayson-Pitts, B. J., Kolb, C. E., Molina, M. J., Friedl, R. R., Ravishankara, A. R., and Moortgat, G. K.: Chemical Kinetics and Photochemical Data for Use in Stratospheric Modeling, evaluation number 14, NASA Jet Propulsion Laboratory, California Institute of Technology, Pasadena, CA, 2003. Sen, B., Toon, G. C., Osterman, G. B., Blavier, J. F., Margitan, J. J., Salawitch, R. J., and Yue,
30
G. K.: Measurements of reactive nitrogen in the stratosphere, J. Geophys. Res.-Atmos., 103, 3571–3585, 1998.
ACPD
3, 5689–5710, 2003 Measurements of the sum of HO2NO2 and CH3O2NO2 J. G. Murphy et al. Title Page Abstract Introduction Conclusions References Tables Figures J I J I Back CloseFull Screen / Esc
Print Version Interactive Discussion
© EGU 2003 technique for measurement of pernitric acid in the upper troposphere and the polar boundary
layer, Geophys. Res. Lett., 28, 3875–3878, 2001.
Smith, G. D., Molina, L. T., and Molina, M. J.: Measurement of radical quantum yields from formaldehyde photolysis between 269 and 339 nm, J. Phys. Chem. A, 106, 1233–1240, 2002.
5
Talbot, R. W., Vijgen, A. S., and Harriss, R. C.: Measuring Tropospheric HNO3 – Problems and Prospects For Nylon Filter and Mist Chamber Techniques, J. Geophys. Res.-Atmos., 95, 7553–7561, 1990.
Thornton, J. A.: Nitrogen Dioxide, Peroxynitrates, and the Chemistry of Tropospheric O3 Pro-duction: New Insights from In Situ Measurements, Doctoral thesis, University of California,
10
Berkeley, 2002.
Wennberg, P. O., Salawitch, R. J., Donaldson, D. J., Hanisco, T. F., Lanzendorf, E. J., Perkins, K. K., Lloyd, S. A., Vaida, V., Gao, R. S., Hintsa, E. J., Cohen, R. C., Swartz, W. H., Kusterer, T. L., and Anderson, D. E.: Twilight observations suggest unknown sources of HOx, Geophys. Res. Lett., 26, 1373–1376, 1999.
15
Zhang, H., Roehl, C. M., Sander, S. P., and Wennberg, P. O.: Intensity of the second and third OH overtones of H2O2, HNO3, and HO2NO2, J. Geophys. Res.-Atmos., 105, 14 593–14 598, 2000.
ACPD
3, 5689–5710, 2003 Measurements of the sum of HO2NO2 and CH3O2NO2 J. G. Murphy et al. Title Page Abstract Introduction Conclusions References Tables Figures J I J I Back CloseFull Screen / Esc
Print Version Interactive Discussion © EGU 2003 0 20 40 60 80 100 0.0 0.5 1.0 1.5
(b)
Relative Humidity %
C orr ec te d P N s (L IF ) / P A N + P P N (G C ) 0.0 0.5 1.0 1.5 2.0(a)
P N s (L IF ) / P A N + P P N (G C )Fig. 1. (a) Humidity trend in ratio of LIF to GC measurements where HO2NO2is predicted be less than 10% of PAN(b) Ratio after the humidity-dependent correction has been applied.
ACPD
3, 5689–5710, 2003 Measurements of the sum of HO2NO2 and CH3O2NO2 J. G. Murphy et al. Title Page Abstract Introduction Conclusions References Tables Figures J I J I Back CloseFull Screen / Esc
Print Version Interactive Discussion © EGU 2003
0.0
0.1
0.2
0.3
0.4
0.5
0.6
0.8
1.0
1.2
1.4
1.6
Σ
NO
yi/ T
ota
l N
O
yModelled HO
2NO
2/ Measured NO
yFig. 2.ΣNOyi/NOyvs calculated HO2NO2/NOy, usingΣNOyi= NOx+ HNO3+ ΣANs + PAN + PPN (grey) andΣNOyi= NOx+ HNO3+ ΣANs + ΣPNs (black). The data were averaged within ±.04 of HO2NO2/NOyand the error bars represent twice the standard deviation of the mean.
ACPD
3, 5689–5710, 2003 Measurements of the sum of HO2NO2 and CH3O2NO2 J. G. Murphy et al. Title Page Abstract Introduction Conclusions References Tables Figures J I J I Back CloseFull Screen / Esc
Print Version Interactive Discussion © EGU 2003 220 230 240 250 260 270 280 -200 -100 0 100 200 300 400 500 600 All Observations then sorted by:
NO2 <11 ppt NO2 <11 ppt
Temperature (K)
∆
PN (ppt)
0.01 0.1 1 10 100 1000 J-1 kd-1 HO2NO2 CH3O2NO2Lifetim
e (h)
Fig. 3. (Upper panel) lifetime of HO2NO2with respect to thermal decomposition (large black circle) and the sum of photolysis and reaction with OH (large black dot) and of CH3O2NO2 with respect to thermal decomposition (large grey square) and photolysis (small grey square). (Lower panel)∆PN measurements (small grey square) as a function of temperature, averaged into separate temperature bins for NO2< 11 ppt (big black circle) and for NO2> 11 ppt (large black square).
ACPD
3, 5689–5710, 2003 Measurements of the sum of HO2NO2 and CH3O2NO2 J. G. Murphy et al. Title Page Abstract Introduction Conclusions References Tables Figures J I J I Back CloseFull Screen / Esc
Print Version Interactive Discussion © EGU 2003 230 240 250 260 270 280 -300 -200 -100 0 100 200
M
eas
ur
em
en
t
M
ode
l (
pp
t)
Temperature (K)
-300 -200 -100 0 100 200 300Model A - with J
IRModel B - no J
IRFig. 4. Difference between measured and modelled ∆PNs for a model without IR photoly-sis(upper panel) and a model including IR photolysis for HO2NO2(lower panel). The black squares represent the median of each 5 K bin and the error bars are twice the standard devia-tion of the mean.
ACPD
3, 5689–5710, 2003 Measurements of the sum of HO2NO2 and CH3O2NO2 J. G. Murphy et al. Title Page Abstract Introduction Conclusions References Tables Figures J I J I Back CloseFull Screen / Esc
Print Version Interactive Discussion © EGU 2003 50000 55000 60000 65000 70000 75000 0 2 4 6 GMT Secs on 22 May 2000 Altitude (km) -40 0 40 80 O C or % RH 0 200 400 600 (ppt) 0 400 800 1200 (ppt) 0 100 200 300 (d) (c) (b) (a) (e) (ppt) 0 80 160 240 O 3 (ppb)
Fig. 5. Observations during a flight between Thule and Winnipeg on 22 May 2000, (a)∆PN measurements (small black square) and predictions from Model A (small red square),(b) NOy (black dot), PAN+ PPN (blue dot), ΣPN (red dot), (c) HNO3(red triangle), NOx(black triangle), ΣAlkyls (blue triangle), (d) temperature (red line), % relative humidity (blue line), (e) altitude (black line), O3(red diamond).
ACPD
3, 5689–5710, 2003 Measurements of the sum of HO2NO2 and CH3O2NO2 J. G. Murphy et al. Title Page Abstract Introduction Conclusions References Tables Figures J I J I Back CloseFull Screen / Esc
Print Version Interactive Discussion © EGU 2003
0
50
100
150
200
250
300
0
50
100
150
200
250
300
∆
P
N
O
bse
rv
at
io
ns
(
ppt
)
Model A Predictions for
∆
PN (ppt)
Fig. 6. Comparison of average∆PN observations and Model A predictions with the error bars representing twice the standard deviation on the mean and a 1:1 line shown.