New insight into the atmospheric chloromethane budget gained using gained using
22
0
0
Texte intégral
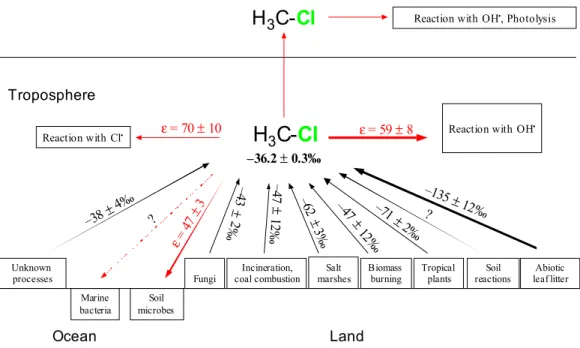
Figure
Documents relatifs
