HAL Id: insu-02916949
https://hal-insu.archives-ouvertes.fr/insu-02916949
Submitted on 19 Aug 2020HAL is a multi-disciplinary open access archive for the deposit and dissemination of sci-entific research documents, whether they are pub-lished or not. The documents may come from teaching and research institutions in France or abroad, or from public or private research centers.
L’archive ouverte pluridisciplinaire HAL, est destinée au dépôt et à la diffusion de documents scientifiques de niveau recherche, publiés ou non, émanant des établissements d’enseignement et de recherche français ou étrangers, des laboratoires publics ou privés.
Experimentally determined Si isotope fractionation
between zircon and quartz
Dustin Trail, Paul Savage, Frédéric Moynier
To cite this version:
Dustin Trail, Paul Savage, Frédéric Moynier. Experimentally determined Si isotope fractionation between zircon and quartz. Geochimica et Cosmochimica Acta, Elsevier, 2019, 260, pp.257-274. �10.1016/j.gca.2019.06.035�. �insu-02916949�
1 submitted to GCA 1 2 3 4
Experimentally determined Si isotope
5
fractionation between zircon and quartz
6 7 8 9
Dustin Trail1, Paul S. Savage2 and Frédéric Moynier3,4
10 11 12
1
Department of Earth & Environmental Sciences, University of Rochester, Rochester, NY 13
14627, USA. 14
2
School of Earth and Environmental Sciences, University of St Andrews, Irvine Building, 15
Scotland, UK, KY16 9AL 16
3
Université de Paris, Institut de physique du globe de Paris, CNRS, F-75005 Paris, France 17
4
Institut Universitaire de France, Paris, France 18
19
Corresponding author: Dustin Trail ([email protected]) 20 21 Submitted Feb 9th 2019 22 Revised June 20th, 2019 23 24 25 26 27
Keywords Si isotopes; fractionation; igneous; zircon; quartz; three-isotope
28
2
Abstract. The silicon isotope composition of detrital quartz and zircon have the potential to
29
inform us about secular changes to the silica cycle and weathering reactions on Earth. However,
30
inferring source melt Si isotope composition from out-of-context minerals is hampered by the
31
fact that, to-date, there is limited Si isotope equilibrium fractionation data for minerals. Here, we 32
report experimental data to constrain Si isotope equilibrium fractionation between zircon and 33
quartz, using two fundamentally different strategies, but with the same experimental design. 34
First, zircon and quartz were hydrothermally synthesized from Zr(OH)4 and SiO2 at 1.5 GPa and
35
temperatures of 725, 800, and 900 oC. The second experimental strategy utilized the
three-36
isotope method; the starting materials consisted of natural zircon and isotopically-labelled SiO2.
37
Three sets of hydrothermal time-series experiments were conducted at the same pressure and 38
temperatures as the direct synthesis experiments. For all experiments, quartz and zircon were 39
separated and 30Si/28Si and 29Si/28Si ratios were measured by solution multi-collector inductively
40
coupled plasma mass spectrometry. The three-isotope method, which provides the best indicator 41
of equilibrium fractionations, yields the following relationship: 42 43 Δ30 Si(qtz-zrc) = (0.53±0.14)×106/T2 44 45
where Δ30Si(qtz-zrc) is the relative difference in 30Si/28Si between quartz and zircon in permil, T
46
is temperature in K, and the error is 2 s.e. This relationship can be used to calculate the 47
fractionation between zircon and other phases, and to estimate the Si isotope composition of the 48
melt from which a zircon crystallized. The results may be used to assess equilibrium-49
disequilibrium isotope fractionations between quartz and zircon and co-existing phases in 50
igneous rocks. These data can also be applied to out-of-context zircon (and quartz) to estimate 51
the isotope composition of the host rock. Zircons crystallizing from a melt derived from purely 52
igneous sources – i.e., without the involvement of “weathered” material – are expected to display 53
a δ30SiNBS-28 (permil deviation of the 30Si/28Si from the NBS28 standard) range from 0.7 to
-54
0.35‰. Deviations from this range indicate assimilation of non-igneous (i.e., sedimentary) 55
material in the melt source. 56 57 58 59 60 61 62 63 64 65 66 67 68 69 70 71 72 73 74
3 75
1. Introduction
76 77
The processes of silicate weathering and assimilation of sedimentary material into crustal 78
melts have been explored in detail through measurements of oxygen isotope ratios in whole rock 79
for over 50 years (Taylor, 1968; Taylor and Sheppard, 1986). This is because oxygen isotope 80
ratios of supracrustal and aqueously-altered rocks are fractionated away from the canonical 81
mantle value (O’Neil and Chappell, 1977; Harmon and Hoefs, 1995). Anatexis of such altered 82
material during the formation of melt thus yields different bulk-rock 18O/16O ratios when
83
compared to primitive mantle-derived magmas. In most cases, supracrustal contamination yields 84
igneous rocks enriched in 18O compared to the upper mantle, because weathering results in
85
relatively large enrichment in the heavy isotopes of the weathered rocks (Savin and Epstein, 86
1970). Trends to 18O/16O values lower than mantle may occur by assimilation of
high-87
temperature, hydrothermally-altered material caused by a change in the fractionation direction 88
vs. temperature during chemical weathering (e.g. Wenner and Taylor, 1973; Chacko et al., 2001), 89
or by assimilation of material altered by meteoric water (e.g., Bindeman et al., 2007). 90
Using oxygen isotopes as a proxy for supracrustal contamination in igneous systems at 91
the mineral-scale requires knowledge of the direction and magnitude of O isotope fractionation 92
among phases. Experimentally-, empirically, and theoretically-derived mineral-mineral oxygen 93
isotope fractionations (Keiffer, 1982; Mathews et al., 1983; Chiba et al., 1989; Chacko et al., 94
2001; Trail et al., 2009) have resulted in a clearer understanding of the relationship between 95
crustal weathering, recycling, and the isotopic composition recorded in individual igneous 96
phases. One phase that has offered many important insights is zircon, which is generally 97
unaffected by chemical weathering (e.g., Valley et al., 1994; 2003; Grimes et al., 2013; Loewen 98
and Bindeman, 2015, 2016) and can be dated by U-Pb geochronology (Harrison et al., 2017). For 99
instance, some zircons older than 4.0 Ga have oxygen isotope compositions that are enriched in 100
18
O relative to mantle zircon (Valley et al., 1998; Cavosie et al., 2009), providing evidence for 101
low-temperature fluid alteration of their protoliths and suggesting that significant volumes of 102
liquid water were interacting with the crust as early as 4.2 to 4.3 Ga (Mojzsis et al., 2001; 103
Cavosie et al., 2005). 104
Other isotope tracers, such as 7Li/6Li and 26Mg/24Mg, have been used with success to
105
study silicate weathering (e.g. Teng et al., 2010, Wimpenny et al., 2011) though perhaps no other 106
isotope system is more important than Si due its pervasive abundance in the lithosphere and 107
weathered products. Silicon isotopes, like oxygen isotopes, fractionate away from igneous 108
compositions during weathering in many low-temperature water-rock interactions, particularly 109
during desilicification and neoformation of clay minerals (Opfergelt et al., 2012; Savage et al., 110
2013). There is also evidence that a supracrustal Si isotope signature can be transferred to a melt; 111
depletions in the light isotopes of Si were detected in several peraluminous leucogranites 112
(Poitrasson and Zambardi, 2015). Savage et al. (2012) also identified measurable differences in 113
the Si isotopic composition of igneous rocks from the Lachlan Fold Belt, Australia, which 114
revealed new information about the source materials of these (S)edimentary- and (I)gneous- type 115
granitoids. Specifically, Ordovician sediments near these granitoids are often interpreted to 116
represent the supracrustal end-member for the S-type rocks (e.g., Keay et al., 1997), yet Si 117
isotope compositions strongly suggest that these sediments were not the only source of material 118
(Savage et al., 2012); pre-Ordovician metasedimentary crust may have also contributed to the 119
isotopic character of the LFB granitoids (Chappell et al., 1988). 120
4
Studies have also coupled Si and O isotope ratios to infer that Si from marine 121
hydrothermal origin and a minor fraction from continental weathering contributed to the 122
chemistry of banded iron formations, as early as 3.8 Ga (Heck et al., 2011). More recently, new 123
insights into the terrestrial silica cycle and weathering reactions prior to 3.8 Ga have been 124
gleaned from coupled Si and O isotope measurements of Archean and Hadean detrital zircons 125
(Trail et al., 2018). These data provide evidence for the presence (and subsequent melting) of 126
fluid-altered, crustal assemblages such as serpentinites and possibly authigenic silica on the 127
Hadean Earth. 128
As with O isotopes, the direction and magnitude of Si isotope high temperature 129
fractionations among co-existing igneous phases needs to be well constrained so that the bulk-130
rock Si isotope composition can be confidently inferred, particularly when ex-situ mineral phases 131
are analyzed. This will allow for any signature of supracrustal material in the melt source to be 132
better elucidated via this isotope system. The importance of this is amplified because Si isotope 133
fractionations produced during weathering or low temperature hydrothermal processes are 134
typically smaller in magnitude than O isotopes. The Si isotope composition of clays, for 135
example, are typically confined to -0.5 to -3 ‰ (relative difference when compared to the mantle 136
frame of reference; Opfergelt et al., 2012), though Bayon et al. (2018) showed that a small 137
fraction of clays can in be isotopically unfractionated relative to average (unweathered) felsic 138
crustal composition. In comparison, clay mineral 18O/16O ratios with differences of +10 ‰
139
compared to the mantle frame of reference are common (Savin and Epstein, 1970; Chacko et al., 140
2001). 141
Variations in δ30Si between natural igneous mineral assemblages have been measured in
142
previous studies (Savage et al. 2011, 2012), where δ30Si is defined as the permil difference of the
143
30
Si/28Si ratio of the sample relative to the same ratio in NBS-28 silica sand, as follows:
144 145 (1). 146 147
Silicon isotope mineral-mineral fractionations at igneous temperatures are typically range from 148
0.05 – 0.50 ‰ (Savage et al., 2012; and Trail et al., 2018), though density functional theory 149
(DFT) calculations predict quartz-clinopyroxene (i.e., diopside and clinoenstatite) fractionations 150
that approach or exceed 0.5 ‰ (1000 K; Méheut et al., 2009; Qin et al., 2016). The direction and 151
magnitude of fractionation is thought to be controlled by the relative degree of polymerization of 152
the minerals. Restated, phases with higher proportions of Si-O-Si bonds tend to prefer the 153
heavier Si isotopes (e.g., Méheut et al., 2009; Savage et al., 2011); i.e., orthosilicates (e.g., 154
olivine) are almost always isotopically lighter than tectosilicates (e.g., feldspar). 155
Due to the orthosilicate structure of zircon, it is predicted that zircon should be 156
isotopically light, particularly if crystallizing from a high silica melt where most liquidus phases 157
are tectosilicates (Qin et al., 2016). Quartz, on the other hand, should be enriched in the heavy 158
isotopes of Si. This was confirmed by Trail et al. (2018), who measured zircon-quartz 159
fractionation values for an aliquot of zircon and quartz from the I-type Jindabyne tonalite, from 160
the Lachlan Fold Belt (LFB), Australia (Trail et al., 2017). A fractionation of δ30Si(qtz) –
161
δ30
Si(zrc) = Δ30Si(qtz-zrc) = 0.47±0.06 ‰ (Tcryst ~750 oC) was measured via multi-collector
162
inductively-coupled-plasma mass-spectrometry (MC-ICP-MS). These measurements also agree 163
with DFT calculations for analogous mineral pairs. That is, quartz-pyrope fractionations (pyrope 164
being an orthosilicate) are equal to 0.48 ‰ at 750 oC (Méheut and Schauble, 2014).
5
However, there are some important caveats for the above generalizations. Firstly, implicit 166
in constraining a fractionation from natural samples is the assumption that zircon and quartz 167
crystallized contemporaneously and in equilibrium, which may or may not be the case. 168
Secondly, it is not clear to what extent the predicted polymerization-related fractionation rule 169
holds when other network-modifying cations, such as Al, OH-, B are present in high abundances
170
in the melt and crystallizing phases. The control of relative polymerization on Si isotope 171
fractionation is clearly not a consistent phenomenon, as both empirical measurements and first 172
principle DFT calculations imply that olivine is isotopically heavier than coexisting 173
clinoenstatite, despite having more “non-bridging” oxygens (Méheut et al., 2009; Savage et al., 174
2011). Moreover, measured fractionations between quartz and biotite/phlogopite (Ding et al. 175
1996; Georg, 2006) are lighter than would be expected by a applying the simple polymerization 176
rule for the three corner-sharing structure of trioctahedral phyllosilicates (Méheut and Schauble, 177
2014). Zircon also exhibits unique properties among the silicate minerals whose fractionations 178
were calculated by DTF (Qin et al., 2016). That is, its calculated 30Si/28Si reduced partition
179
function ratio vs. Si-O polyhedron volume is well outside the trend identified for other silicates, 180
which is due to a large distortion in the zircon silica tetrahedron (Qin et al., 2016). Thirdly, even 181
I-type granitoids are known to contain inherited zircons (e.g., Kemp et al., 2005), which means 182
that the natural quartz-zircon fractionation noted above could be affected by a mixture of 183
multiple zircon populations. Finally, stable isotope fractionation is a temperature-dependent 184
process. Constraining the sensitivity of Δ30Si(qtz-zrc)to crystallization temperature is critical to
185
accurately infer whole-rock/melt compositions from out-of-context minerals. 186
Thus, there is a need to approach the topic of igneous Si isotope fractionation between 187
zircon and whole-rock/coexisting minerals in a systematic and controlled fashion. While several 188
studies have conducted calculations to constrain Si isotope fractionations among coexisting 189
minerals and fluids (Méheut et al., 2007, 2009; Méheut and Schauble, 2014; Huang et al., 2014; 190
Qin et al., 2016), we aware of no experimental Si isotope fractionation data for igneous minerals. 191
We present high temperature Si isotope fractionation experiments between zircon and quartz by 192
direct synthesis, and through application of the three-isotope method (e.g. Matsuhisa et al., 1978; 193
Shahar et al., 2008; Macris et al., 2013), to place inferences made from zircon Si isotope 194
measurements in a more complete context. We show that the direction of experimentally 195
determined Si isotope quartz-zircon fractionations agrees with natural and theoretical data (Qin 196
et al., 2016; Trail et al., 2018), though some differences in the magnitude are observed. When 197
experimentally determined quartz-zircon fractionations are combined with measurements 198
collected on natural samples, we also show that the Si isotopic difference between zircon and 199
whole rock can be confidently estimated in simplified scenarios. 200 201 202
2. Methods
203 2042.1 Experimental strategy and design
205 206
High temperature Si isotope fractionations – in this case quartz and zircon – are typically 207
described by the following relationship: 208 209 (2) 210 211
6
where T is in K, and αqtz-zrc is the fractionation factor defined by the 30Si/28Si value in quartz
212
divided by the equivalent ratio in zircon, and A is a constant parameter. This relationship is 213
typically assumed to be a valid description of high temperature (≥500 oC) isotope fractionations
214
(Bottinga and Javoy, 1973). While polynomial expressions such as 103ln(αmineral1-mineral2) =Ax -
215
Bx2 + Cx3 – where x=106/T2 – are frequently used for theoretical calibrations (e.g., Qin et al.,
216
2016), such functions are rarely used for high temperature experimental or naturally-calibrated 217
fractionation studies because the obtained fractionations are typically not precise enough to 218
resolve the B- and C-values. For the data presented here, we utilize equation (2) which implies 219
an assumed linearity for Δ30Si(qtz-zrc) vs. 1/T2, that αqtz-zrc is close to 1, and that A can be solved
220
for by knowing T and the Si isotope compositions of quartz and zircon. We conducted a series 221
of fluid-saturated experiments in a piston cylinder device to characterize the A-value using two 222
different experimental designs. 223
224
2.1.1 Direct synthesis experiments
225 226
We performed direct synthesis experiments of zircon and quartz with starting materials 227
consisting of Zr(OH)4, SiO2, and a 10 mM CaCl2 solution. The SiO2 consisted of 325 mesh
228
fused ~amorphous powder from Alfa Aesar with a stated purity of 99.8%. The Zr(OH)4 was
229
made by first dissolving 99.9% pure ZrCl4 from Sigma Aldrich in distilled water under a fume
230
hood; a Zr(OH)4 gel was precipitated by adding NH4OH to this solution (Montel et al., 1989;
231
Trail et al., 2011). The gel was carefully rinsed, left to sit at room temperature until dry, and 232
then ground. A 10 mM CaCl2 solution was made by dissolving CaCl2·2H2O (99% purity, Alfa
233
Aesar) and trace DyCl3 (99.99% purity; Sigma Aldrich) in distilled water.
234
The SiO2 and Zr(OH)4 were weighed out for each individual experiment in 2:1
235
abundances by mole, for a total mass of ~70 mg. This material was coarsely mixed by hand in 236
the weighing paper with a spatula before loading it into a 4.8 mm diameter capsule machined 237
from an Ag rod with an outer diameter of 7.3 mm. Approximately 60 µL of 10 mM CaCl2
238
solution was added with a micro-syringe. The capsule was then surrounded by components of 239
the solid media pressure cell (Figure 1), loaded into a pressure vessel with a ¾” tungsten-carbide 240
core, and then end-loaded. The Ag capsule was pressure-sealed to a 2 mm thick Ag lid by 241
applying pressure to the sample piston with a hand pump. 242
Experiments were heated to 900, 800, or 725 oC with a ramp rate of ~300o per minute.
243
Specifically, they were ramped at 300 oC per minute to 25o below the set point, and then at 100o
244
per minute for the final 25o. The temperature was monitored using calibrated 25%WRe–3%WRe
245
thermocouple wire. The temperature choices result in approximately equivalent spacings when T 246
(in K) is expressed as 106/T2. The pressure was kept fixed at 1.5 GPa using a 20 cm Heise gauge
247
and experiment durations were 48, ~94, or 140 h for 900, 800, and 725 oC experiments,
248
respectively. Experiments were quenched by cutting power to the transformer. Prior to opening 249
the capsules, they were gently cleaned with a file and a lathe to remove Mg-oxide pressure media 250
and a small amount of the exterior wall the Ag capsule. All capsules exhibited evidence for 251
fluid-under-pressure, and expelled liquid once the water-tight seal was breached. In preparation 252
for MC-ICP-MS measurements, quartz crystals (50 – 300 µm) were extracted from the capsules 253
with tweezers, sonicated in ethanol, and then inspected for inclusions by reflected light, 254
transmitted light, and backscattered electron imaging. Zircon crystal picking was prohibitive due 255
to size (~<5 μm), so aliquots were treated in dilute HF acid overnight to remove residual silica 256
quench or quartz. Hydrofluoric acid cleaning of non-metamict zircon effectively separates 257
7
zircon from other silicate material (e.g., Watson et al. 2006; Trail et al. 2009) and zircon crystal 258
surfaces are not altered by acid treatment (Cherniak and Watson, 2010). 259
To prevent entry of foreign material, HF treatment was carried out in a teflon container 260
that was loosely-capped, but the cap was not tightened based on the expectation that volatile 261
SiF4, formed by reaction of the acid with quartz+quench, would be preferentially lost. After
262
treatment, the HF was carefully poured out of the container and discarded, with the last drop 263
wicked away with a kimwipe®. The remaining material was rinsed several times in ethanol and 264
dried. A small amount of pre- and post-treated “zircon fraction” was cast into epoxy, polished 265
with an automated polisher with a slurry of 1 µm Al2O3+H2O, and then finished with colloidal
266
silica. Cathodoluminesence (CL) and secondary electron (SE) images were collected for the 267
samples. 268
269
2.1.2 Three-isotope exchange method
270 271
Our second set of experiments implemented the three-isotope exchange method (e.g. 272
Matsuhisa et al., 1978; Shahar et al., 2008), though were otherwise identical to the design 273
presented in Figure 1. The method involves doping one of the equilibrating phases – quartz in 274
this case – in the denominator isotope (28Si). Quartz will thus plot below the terrestrial mass
275
isotope fractionation line (TMFL). The bulk composition of the quartz and undoped zircon 276
mixture will define a secondary mass fractionation line (SMFL; Figure 2). As these two phases 277
are brought to equilibrium by recrystallization at high temperature, each will progressively 278
approach the SMFL. The loci of the SMFL in isotope space is therefore constrained by the slope 279
of the SMFL and the isotopic composition of the system (i.e., quartz+zircon). Here we assume a 280
slope (γ) of 0.5178 for the SMFL based on equilibrium isotope fractionation theory: 281 282 (3) 283 284
where m28 is the mass of 28Si, etcetera (Young et al., 2002). A series of isothermal experiments
285
conducted for progressively longer durations should produce an array of points for each phase 286
that trends toward the equilibrium fractionation value, defined by the intercept with the SMFL. 287
We prepared SiO2 for our experiments by mixing reagent-grade SiO2 with 28Si-enriched
288
SiO2 from Isoflex USA ®, with a stated purity of 99.4% 28SiO2. First, an initial mixture
289
containing about 1.1 wt% of isotopically-labeled SiO2 was mixed with the same Alfa Aesar
290
material as the previous section. This was ground in a ceramic Al2O3-based mortar and pestle
291
(Diamonite ®) for approximately 1 hour. A small chip of the Diamonite® mortar was removed, 292
mounted in epoxy, polished, and analyzed by energy dispersive spectroscopy confirming that it 293
is Al2O3-based, with a binding agent containing Ca, Mg, Si, and Cr.
294
The 28Si-enriched mixture yielded δ29SiNBS-28 and δ30Si NBS-28 values of ~–10.7 ‰. In
295
these experiments, it is important not to “overspike” with 28SiO2, so that the amount of
296
extrapolation to the SMFL is reasonable (Shahar et al., 2017). “Underspiking” may result in 297
changes to the equilibrating phases during the experiment that are too small to detect with the 298
MC-ICP-MS precision. Early attempts to conduct experiments with the above spiked mixture 299
were unsuccessful because the extrapolation to the SMFL was too large. Thus, we produced a 300
second SiO2 mixture in which the δ30Si ~–10.7 ‰ material was diluted further by adding
301
additional Alfa Aesar SiO2 (TMFL) material. This resulted in a mixture consisting of about 0.29
8
wt% of isotopically-labelled 28SiO2. Approximately 2 grams of SiO2 was thoroughly mixed in a
303
Diamonite ® mortar and pestle for approximately 1 hour. 304
The zircon starting material was a ~5 gram crystal from the Mud Tank carbonatite 305
(Currie et al., 1992). The crystal was inspected optically and was found to be free of visible 306
inclusions, though it did contain infrequent and small (1-5 µm) secondary opaques, likely Fe-307
oxides, along fractures in the crystal. It was crushed and ground under ethanol for approximately 308
1 hour. The resulting material was sieved to a size fraction smaller than 70 μm, and then ground 309
again. As later verified by SEM, this produced angular fragments of zircon which were expected 310
to have relatively high reactivity during the experiments. That is, the surfaces of crystal shards 311
are likely to have lower activation energy barriers causing them to more rapidly undergo 312
dissolution – and thus recrystallization – than primary crystal facets. 313
Silver capsules, of the same design described above, were loaded with equimolar 314
amounts of Si for each phase, resulting in a total weight of approximately 130 mg for each 315
experiment. For experiments performed at 900 and 800 oC, we added 4 wt. % of the same 10
316
mM CaCl2 fluid to the capsule, which also contained trace DyCl3. Like the direct synthesis
317
experiments, the CaCl2 was added because it has been shown to enhance re/crystallization of
318
zircon (e.g., Geisler et al. 2001). Based on the expectation that higher fluid contents would result 319
in faster equilibration, we added additional fluid (8 wt. % total) to our lowest temperature series 320
(725 oC). Dysprosium was included because it is a known cathodoluminescence emitter in
321
zircon and was thus used to evaluate the extent of recrystallization in trace element poor Mud 322
Tank zircon in the experimental products. Time series experiments ranged from 20 to 150 h for 323
900 oC, from 20 to 500 h for 800 oC, and from 20 to 1099 h for 725oC. At least 15 mg and 45
324
mg of cleaned quartz and zircon, respectively, were recovered from each experiment and 325
processed as for the direct synthesis experiments for MC-ICP-MS measurements. 326
327
2.2 MC-ICP-MS measurement
328 329
Starting materials, experimental products, and external standards were processed through 330
the same HF-free dissolution and purification procedure before Si isotope analysis. This method 331
is based closely on that described in detail in Georg et al. (2006) with specific modifications and 332
further details noted in Savage and Moynier (2013). The use of HF for sample dissolution is 333
avoided with use of an alkali flux digestion method. Each sample was weighed into a silver 334
crucible (made of 99.99% pure Ag sheet) along with enough NaOH flux (semiconductor grade, 335
99.99% pure, Sigma Aldrich) such that the mass ratio of sample to flux was ~1:20. The crucible 336
was then placed in a muffle furnace, heated to 720°C, for approximately 15 minutes. The 337
crucible was removed from the furnace, left to cool for 30 seconds, and submerged in ~ 20ml of 338
Milli-Q ® water (18.2 MΩ⋅cm) in a PTFE container. The resultant fusion cake is water-soluble 339
and is readily removable from the crucible: this was performed by submitting the crucible-340
containing PTFE container to ultrasonication and gentle heating, then pipetting the dissolved 341
cake into a pre-cleaned polypropylene bottle. The transferred fusion material is diluted further 342
with Milli-Q ® water and then acidified to 1% HNO3 v/v with thermally distilled nitric acid
343
(~15.7 M) – the amount of HNO3 added is calculated based on the mass of NaOH used in each
344
fusion. The degree of dilution (i.e., how much water is added to the final solution) is estimated, 345
based on the initial amount of sample dissolved, to allow for a final solution concentration of 346
between 10 and 20 ppm Si. The Si concentration in each solution is determined photometrically 347
using the “Heteropoly-Blue” method (with Hach-Lange ® Ultra-low range Si reagents) and 348
9
fusion yield estimated based on the weighed amount of sample and the measured ppm of Si. The 349
calculated fusion yields were all between 95 and 99% Si recovery. 350
The Si from the samples and standards were purified using a one-step column procedure 351
utilizing 1.8ml of BioRad AG50 X-12 (200-400 mesh) cation exchange resin loaded into BioRad 352
“Poly-Prep” columns, again following methods detailed in Georg et al. (2006) and Savage and 353
Moynier (2013). Silicon in neutral to acidic media does not adhere to the resin, and elutes 354
straight through, whereas other cations are held on to the resin and are quantitatively removed 355
from the matrix. All other anions, if present, are at too low concentrations relative to Si to affect 356
isotopic measurement (c.f. Georg et al 2006). Total procedural blanks are on the order of 0.1 μg 357
Si, which typically represents ~0.35% of total Si and are therefore negligible. 358
Over the course of this study, Si isotope measurements were made on two Neptune Plus 359
Multi-Collector Inductively Coupled Plasma Mass spectrometers (MC-ICP-MS); one at the 360
Institut de Physique du Globe de Paris (IPGP), the second in the St Andrews Isotope 361
Geochemistry (STAiG) laboratories. Running conditions for both instruments are as described in 362
Trail et al. (2018) and more general details are provided in Savage and Moynier (2013). Both 363
instruments were operated in ‘medium’ resolution mode to avoid polyatomic interferences (in 364
particular the large 14N16O+ interference that would otherwise overwhelm the 30Si+ signal).
365
Samples were introduced to the instrument using a 75 μl min-1 ESI PFA microflow nebulizer via
366
the Thermo Scientific “SIS” spray chamber. 367
Samples were analyzed at a concentration of 2 ppm Si, which gave ~16V on the 28Si
368
beam (using a 1011 Ω resistor) in medium resolution mode. Ratios were measured in static mode,
369
and each measurement consisted of 25 cycles of ~3 s integrations with a 3 s idle time. Sample 370
δ29
Si (i.e., [(29Si/28Sisample)/(29Si/28SiNBS-28) -1]×1000) and δ30Si values were calculated using the
371
standard-sample bracketing method (relative to NIST RM 8546 silica sand, historically called 372
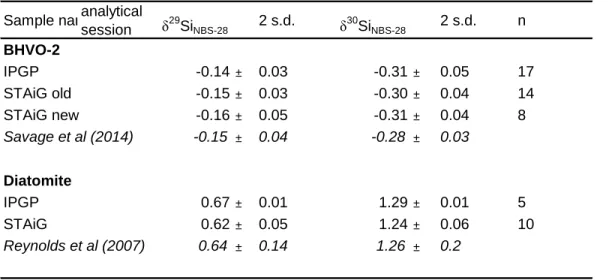
NBS-28). Aliquots of the USGS geostandard BHVO-2 and the Si standard ‘Diatomite’ were 373
routinely ran alongside the unknown samples to monitor accuracy. These analyses are given in 374
Table 1. Our analyses match the ‘accepted’ reference values for these standards exactly 375
(Reynolds et al., 2007; Savage et al., 2014). Standards “BHVO-2 STAiG old” and “Diatomite 376
STAiG” are aliquots taken from the same sample dissolutions as those for the relevant IPGP 377
measurements; comparison of these data show that there is no systematic instrumental offset 378
between the two measurement locations. Additionally, “BHVO-2 STAiG new” is a repeat 379
dissolution of BHVO-2 performed at St Andrews; the lack of offset between this datum and 380
previous BHVO-2 measurements shows that Si isotope analysis at St Andrews produces accurate 381
data with comparable precision. 382
383
3 Results
384 385
3.1 Images and description of experimental products
386 387
Electron microscopy shows that the zircon crystals produced by direct synthesis are 388
relatively euhedral and approximately 1 to 5 µm (Figure 3a). Quartz crystals from the same 389
experiments (not shown) were approximately 50 to 300 µm. With respect to the three-isotope 390
exchange method, the crushed Mud Tank zircon shards used in experiments show clear evidence 391
for recrystallization, analogous to observations made by Ayers et al. (2018) for their zircon-fluid 392
partitioning experiments. An example secondary electron image of the starting material reveals 393
10
numerous angular fragments (Fig. 3b) that exhibit evidence for dissolution as the experiment 394
duration is increased (Fig. 3c,d). 395
“Zircon fractions”, extracted directly from the capsule after hand cleaning, showed 396
occasional quartz (Fig. 3c). After treatment of this material in cold HF acid, no evidence for 397
quartz remained. In post-treated zircon fractions, we did not see evidence for quenched SiO2 in
398
epoxy grain mount either. If HF treatment removes the quartz, it is reasonable to expect that the 399
quench material, with smaller size (<<50 µm) and larger surface area to volume ratios, are also 400
likely removed. These results, including the observations made after the HF cleaning procedure, 401
agree with past studies (Trail et al., 2009). Quartz crystals are mostly free of inclusions, though 402
they do contain rare occurrences of sub- to micron-sized zircons (Fig. 3e). We estimate that all 403
mineral aliquots separated for isotope analyses were >95% pure. 404
Evidence for zircon recrystallization is also present through inspection of CL images. 405
While the starting material shows only modest luminescence (Fig. 3f), the experimental products 406
show evidence of recrystallization near the rims of the crystals (Fig. 3g-i). This is caused by 407
substitution of CL-active Dy, added as a trace impurity in the starting fluid, into the zircon 408
lattice. 409
410
3.2 Silicon isotope data
411 412
Silicon isotope ratios (30Si/28Si and 29Si/28Si) are reported relative to NBS-28 quartz sand.
413
Table 1 provides external standard data, and Tables 2 and 3 contains the analyses of the direct 414
synthesis and 3-isotope experimental run products, respectively. Analytical errors for individual 415
phases represent the 2 standard deviations (2 s.d.) of 4 to 5 analyses of a purified sample aliquot 416
(Tables 2 and 3). 417
The long-term external reproducibility of the MC-ICP-MS measurements can be assessed 418
using external standard data; each Si isotope analytical session includes measurement of an 419
aliquot of BHVO-2 (and often Diatomite) which was processed through chemistry at the same 420
time as the other samples being analyzed. The long-term reproducibility can be therefore 421
quantified by calculating the 2 × standard deviation of the δ30SiNBS-28 and δ29SiNBS-28 BHVO-2
422
(and Diatomite) values generated in each measurement session. As each standard measurement 423
also represents a separate chemical separation procedure, this reproducibility also takes into 424
account the variations in the Si isotope separation method. For the IPGP instrument, over a 425
period of 5 months, the external precision on BHVO-2 was δ30SiNBS-28 ± 0.04‰ and δ29SiNBS-28 ±
426
0.03‰ (2 s.d.). For the St Andrews instrument, over a period of 9 months, the external precision 427
on both BHVO-2 and Diatomite was δ30SiNBS-28 ± 0.03‰ and δ29SiNBS-28 ± 0.03‰ (2 s.d.).
428
These long term external reproducibilities are comparable to, and are mostly lower than, 429
the 2 s.d. values calculated for each individual sample measurement, based on the 4 or 5 analyses 430
of the same purified sample aliquot (Tables 2 and 3). For simplicity, we could choose to apply 431
the external precision to all data. However, this does not tell the whole story, as instrumental 432
running conditions can be variable, and will differ between each measurement session, meaning 433
that “short-term” precision on sample measurements will also differ. Because samples are often 434
measured only once, and all samples presented in this study were not measured during the same 435
session, we prefer to utilize the individual analytical errors (as 2 s.d.) in the subsequent 436
discussion and error propagation. 437
438
3.2.1 Direct synthesis
11 440
Direct synthesis experiments yield Δ30Si(qtz-zrc) values of 0.27 ± 0.07, 0.29 ± 0.09 and
441
0.21 ± 0.08 ‰ for respective temperatures of 725, 800, and 900 oC (Table 2). The Δ30Si(qtz-zrc)
442
errors are calculated via (√[(errqtz)2 + (errzrc)2]), using 2 s.d. errors for quartz and zircon. The
443
measured δ30SiNBS-28 value of the starting material is -0.14 ± 0.05 ‰. In all three cases, this is
444
less than 0.1 ‰ from calculated mass balance values of the experiments. Considering the average 445
error associated with this estimate (±0.08 ‰), the average Si isotopic composition for quartz and 446
zircon supports Si isotope mass balance for the direct synthesis experiments. 447
3.2.2 Three-isotope method.
448 449
The δ29Si and δ30
Si values for starting materials and experimental products are reported 450
in Table 3. The starting material for 900 and 800 oC experiments consisted of quartz
pre-451
synthesized in a piston cylinder device, whereas the starting material for the 725 oC experiments
452
used mechanically mixed SiO2 powder without pre-synthesis. The δ30Si(ave) column is
453
calculated by taking the average δ30Si(qtz) and δ30Si(zrc) for each experiment, and assuming a
454
1:1 quartz to zircon ratio, by mole. This reveals that the experimental charges exhibit very good 455
agreement with the average isotopic composition of the starting material, which indicates the 456
experiments approximate a closed system with respect to Si (Figure 4). When compared to the 457
starting materials, Si isotopic compositions of quartz and zircon show progressive exchange for 458
longer experiment durations. A simple percent exchanged calculation, which compares the 459
amount of isotope exchange between the initial and the experimental product with the difference 460
between the initial composition and intercept, ranges between 15 and 36%. 461
After Figure 2, the starting compositions and the measured phases for each isotope 462
exchange experiment were plotted on a δ29Si vs. δ30Si plot. A line was fitted to the data using a
463
York regression in the Origin 2016 ® software package. This line was extrapolated to intercept 464
the SMFL. In all cases, our three sets of experiments show quartz and zircon approaching the 465
SMFL. Intercepts and the errors were solved for each zircon and quartz pair. These intercepts 466
constrain the Δ30Si(qtz-zrc) at each of the three experiment temperatures.
467
These intercepts are also constrained by mass balance of the system (Figure 4). To take 468
this into consideration, our final calculated fractionations involved a Monte Carlo simulation of 469
possible Δ30Si(qtz-zrc) equilibrium values constrained by the SMFL intercept, the 95%
470
confidence intervals associated with the SMFL intercept, and the mass balance of the system. 471
Inputs for δ30Si(qtz) and δ30Si(zrc) were randomly generated by assuming the probability of
472
distribution was defined by the 95% confidence intervals of the intersection to the SMFL. The 473
next criterion requires that selected δ30
Si(qtz) and δ30Si(zrc) values satisfy mass balance of the
474
system, where tolerances for this criterion are provided on Figure 4. We randomly selected 475
10,000 δ30Si(qtz) and δ30Si(zrc) SMFL intercept values that satisfy mass balance, and the
476
average of these results was used to predict the fractionation. In general, the errors associated 477
with the York fits for zircon were smaller and quartz. While the error on the fit may be larger if 478
quartz is considered independently, the error becomes smaller when the mass balance constraint 479
is utilized. The standard deviation of the successful Monte Carlo sampling was used to calculate 480
the error (see the Electronic Annex for additional details). Our calculated Δ30Si(qtz-zrc)
481
fractionations for 900, 800, and 725 oC are 0.40 ± 0.46, 0.51 ± 0.18, and 0.50 ± 0.29 ‰ (2 s.d.),
482 respectively (Figure 5). 483 484
4 Discussion
48512 486
4.1 Si isotope quartz-zircon fractionation calibration
487 488
For each experiment, the orthosilicate zircon preferentially incorporates the lighter 489
isotopes of Si relative to quartz, as predicted by first principles equilibrium isotope theory and 490
previous – but limited – natural sample measurements (Méheutet al., 2009; Savage et al., 2012;
491
Qin et al., 2016; Trail et al., 2018). However, there is systematic shift between the fractionation 492
factors determined via the direct synthesis and three-isotope exchange methods. The average 493
difference between the larger Δ30Si(qtz-zrc) fractionations calculated for the three-isotope
494
exchange method, compared to the direct synthesis experiments for the three temperatures, is 495
0.18 ‰. This difference is smaller than the average Δ30
Si(qtz-zrc) three-isotope method errors 496
(±0.31 ‰, 2 s.d.). The error calculated for the direct synthesis is 0.08 ‰ (2 s.d.), which only 497
takes into consideration the reproducibility of the measurements. The larger errors associated 498
with the three-isotope method are because they represent the uncertainty of the measurements 499
and the extrapolation of phases – that exchanged at most ~40% of their Si during the experiment
500
– to the SMFL. Although the direct synthesis and three-isotope methods yield Δ30
Si(qtz-zrc) 501
values that are similar when error is considered, this sort of magnitude in Si isotope space is on 502
the same order as the isotopic difference between basaltic and rhyolitic magmas (Savage et al., 503
2011), and is therefore worth commenting upon. Here we explore potential reasons that may be 504
affecting the resultant isotope fractionations predicted using both methods. 505
First, there are limited experimental studies in which Si isotope fractionations between 506
phases have been characterized by different techniques for comparison. There are, however, 507
experimental data for Si isotope fractionations between molten silicate and metal, which used 508
methods similar to the direct synthesis and three-isotope methods employed here (Shahar et al. 509
2009; 2011; Hin et al. 2014). While silicate-metal systems are not directly analogous to our 510
experiments, they are of interest here because the different techniques utilized in these studies 511
yielded different Δ30Si(silicate-metal) vs. 1/T2 calibrations. For experiments conducted using the
512
three-isotope scheme, the silicate material was doped with 28Si to trace the exchange of Si
513
between the metal and silicate. Experiments were performed at 1 GPa or 7 GPa, and from 1800 514
to 2200 oC (Shahar et al., 2009; 2011). On the other hand, Hin et al. (2014) experimentally
515
calibrated the Si isotope fractionation between metal and silicate liquids using undoped 516
materials, though with other deviations from the general design of Shahar et al. (2009; 2011). 517
For instance, Hin et al. (2014) used modest to moderately different starting compositions. The 518
main differences were that they added a combined total of ~2.5 wt% Na2O and K2O to their
519
silicate mixture, and used a Fe-Si metal which contained ~1 wt% Mo and 10 wt% Sn for most of 520
the experiments. That said, the absence of Sn from two of their experiments did not lead to an 521
appreciable change in their Δ30Si(silicate-metal) vs. 1/T2 relationship. Hin et al. (2014) also used
522
a centrifuging piston cylinder for most of their experiments, though for a single experiment 523
conducted in a standard piston cylinder, the Δ30Si(silicate-metal) vs. 1/T2 relationship was not
524
appreciably different. With these differences and comparisons noted, Hin et al. (2014) reported 525
smaller Δ30Si(silicate-metal) fractionations than those of Shahar et al. (2011), once temperature
526
is considered. As a specific example, Hin et al. (2014) predicts Δ30Si(silicatemetal) =
-527
1.08±0.01‰ at 1750 oC, whereas the three-isotope calibration of Shahar et al. (2011) yields
528
Δ30
Si(silicate-metal) = -1.82±0.10‰ at the same temperature. The explanation for this 529
difference suggested by Hin et al. (2014) is that some Si was lost to the capsule thus 530
compromising the simple application of the three-isotope method presented in Figure 2. In our 531
13
experiments, we can rule out loss of Si to the capsule wall as Si-oxide is insoluble in Ag. The 532
fluid medium does result in dissolved silica during the experiment, which leads to a loss of silica 533
from the SiO2-zircon system. This effect appears to be negligible as it pertains to the isotopic
534
composition of the system, an inference based on the attainment of isotope mass balance for each 535
experiment (i.e. Figure 4). Hence, this is unlikely to be the explanation for the systematic offsets. 536
A second possibility is that, in the isotope exchange setup implemented here, the degree 537
of reaction of one of the starting materials with the fluid component could have been larger than 538
for the other phase. The direct synthesis method does not require dissolution of pre-existing 539
zircon which can be temporally prohibitive due to the refractory nature and slow dissolution 540
kinetics of zircon. This would essentially mean that calculation of the SMFL based on an 541
equimolar mixture is incorrect. However, this effect does not seem to be pronounced in our 542
experiments because the average composition of the experimental products agree with the 543
starting composition, and the calculated percent exchanged for zircon and quartz pairs in 544
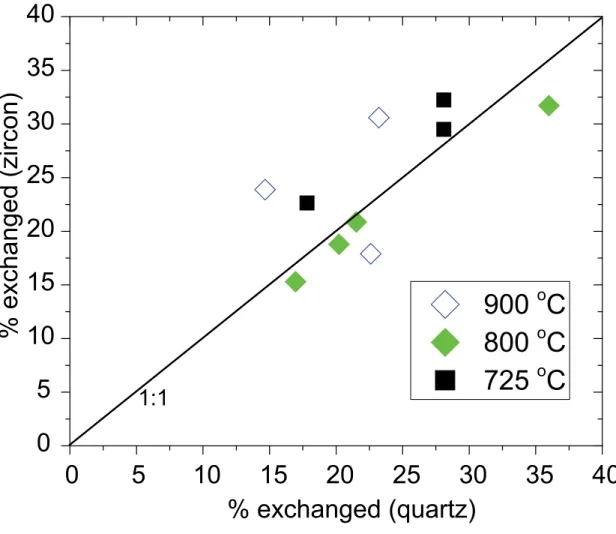
individual experiments are in broad agreement (Figure 6). 545
A third possibility – fractionation of isotopes by diffusion – is not considered a viable 546
explanation for the differences observed either. While such effects may be possible in 547
experiments in which metal is a phase of interest (Lazar et al., 2012), the diffusion of cations in 548
most mineral oxides are not fast enough in most scenarios. The images presented in Figure 3 549
show that recrystallization during the experiments occurs at the micron-scale for zircon. The 550
scale is perhaps tens of microns for quartz if the zircon inclusions identified within the quartz 551
crystals are used as a marker (Figure 3e). These distances are significantly longer than length 552
scales for self-diffusion of Si in quartz and zircon. The characteristic diffusive length scale 553
([4D·t]1/2, D = diffusivity and t = time) for Si in quartz is only ~1 nm for a temperature of 900 oC
554
and a duration of 104 years using the Arrhenius relationship of Béjina and Jaoul (1996). The
555
same temperature and time yield a similar length scale for self-diffusion of Si in zircon 556
(Cherniak, 2008). While these calculations were conducted by extrapolating diffusivities 557
collected from ~1600 to 1300 oC down to 900 oC, the resulting characteristic diffusive length
558
scales strongly suggest kinetic effects related to self-diffusion of Si are not important, when 559
compared to recrystallization. The slow diffusivities of Si in quartz and zircon also mean that 560
time series experiments are not likely to fully remove any kinetic-based isotope fractionations 561
due to crystal growth. 562
A fourth possibility to consider is the crystallization of the phases of interest during 563
heating of the direct synthesis experiments. Non-equilibrium fractionations were invoked by 564
Clayton et al. (1972) to explain the discrepancy between quartz-fluid oxygen isotope 565
fractionation synthesis and exchange experiments whose heating times range between 20 and 40 566
minutes for temperatures of 250 to 500 oC. No evidence for disequilibrium was reported for
567
experiments conducted at 750 oC for experiments of a similar design (Clayton et al., 1972). Our
568
experiments were heated at a rate of ~300o/min, to lessen the severity of this effect, however we
569
return to the issue of early phase nucleation in light of the differences in isotope fractionations 570
measured between the two techniques. To supplement our understanding of the heating step, we 571
conducted a ‘zero time’ experiment. This was heated at 300o
/min to 900 oC and then
572
immediately quenched. All other aspects of the experiment were identical to the direct synthesis 573
procedure presented in section 2.1.1. The heat-treated product was extracted from the capsule, 574
and an X-ray diffraction (XRD) pattern was collected with no other sample preparation. For 575
comparison, an XRD pattern was also collected for the starting material. This revealed a starting 576
material that is almost exclusively amorphous – with a minor fraction of tridymite detected – 577
14
whereas the heat-treated product contains evidence for abundant quartz and zircon (Electronic 578
Annex). Element transport of O during the heating process is unlikely to be restricted, that of Si 579
is likely is highly restricted, with crystallization occurring without full chemical communication 580
of the entire capsule. While speculative, this scenario may result in an underestimate of Si 581
isotope fractionation factor, with both phases having compositions closer to the bulk 582
experimental composition. 583
The presence of nucleated zircon and quartz during heating, coupled with the low 584
expected transport of silica, is reason to consider the direct synthesis fractionations with caution. 585
We therefore consider the fractionations derived from the three-isotope method experiments to 586
the be the best reflection of equilibrium fractionations. These Δ30Si(qtz-zrc) data are plotted
587
against 1/T2 (in K) and fitted by regressing through the origin. This latter constraint is common
588
among stable isotope fractionation studies, whether used for theoretical results, experimental 589
data, or empirical studies (e.g. Qin et al., 2016; Shahar et al. 2009; Valley et al., 2003), which 590
significantly reduces the error on the slope in almost all cases. We assume that this constraint is 591
applicable here for our data, and in doing so, an A-value of 0.53 ± 0.14 is obtained using only the 592
three-isotope fractionations (equation 2). 593
594
4.2 Comparison of Si isotope quartz-zircon fractionations
595 596
While we view this A-value estimation as capturing the pertinent features of our data, this 597
it is not as robust as A-values reported for other isotope systems (e.g., Shahar et al., 2008), due to 598
the slower approach to equilibrium of silicate phases. We use this section to provide a simple 599
comparison of other available constraints and predicted Δ30Si(qtz-zrc) fractionations. The latter
600
are provided at 700 oC, a typical temperature for zircon crystallization in terrestrial magmas (e.g.,
601
Watson and Harrison, 1983; Watson et al., 2006; Boehnke et al., 2013). Using an A-value of 602
0.53 presented in the previous section yields a δ30Si(qtz) value 0.56 ‰ higher than co-existing
603
zircon at 700 oC. If only data from the direct synthesis experiments are used, this would yield
604
Δ30
Si(qtz-zrc) = 0.32‰. Trail et al. (2018) reported Si isotope measurements for an aliquot of 605
zircon (~103 grains) and quartz from the Lachlan Fold Belt Jindabyne tonalite. The zircons from
606
this tonalite have an average crystallization temperature of 755 oC (Trail et al., 2017). Assuming
607
this temperature represents crystallization T of the mineral pair, and that Δ30Si(qtz-zrc) tends
608
toward zero when temperature tends toward infinity, an A-value of 0.50 can be calculated (and a 609
Δ30
Si(qtz-zrc) = 0.53 ‰ at 700 oC). While the direction of the predicted fraction is the same for
610
both experimental methods, these natural data are in best agreement with the A-value calculated 611
with three-isotope method experiments. Finally, Qin et al. (2016) reported calculations, based on 612
density functional theory, to quantify the fractionation factors for a wide range of silicates. This 613
study predicts a Δ30Si(qtz-zrc) fractionation of 0.39 ‰ at 700 oC, which is in closest agreement
614
with the direct synthesis only work presented here. A summary of these fractionations is 615
provided in Figure 8 and Table 4. 616
617
4.3 Inferring whole rock Si isotope composition from out-of-context zircon and quartz
618 619
A goal of this work is to better constrain the Si isotope composition of an igneous rock 620
via analysis of zircon or quartz, as both minerals are common in the detrital record. Here, we 621
provide a relatively robust parametrization to allow for this, albeit within a simplified model. The 622
first requirement is to explore how the δ30Si(qtz) and δ30Si(zrc) values relate to the whole rock
15
(WR). In general, the present observations of natural samples show that the quartz Si isotope 624
composition is a broad proxy for WR δ30Si. Felsic WR and mineral separate data reported by
625
Savage et al. (2012) show that quartz is generally isotopically heavier than whole rock, but with 626
only a small (+0.05‰) enrichment in the heavier Si isotopes. This is perhaps not surprising, 627
especially in granites, where quartz has high modal abundances. For example, for a δ30Si
NBS-628
28(zrc)= -0.55 ‰, we predict a δ30SiNBS-28(qtz)of -0.05 ‰, for a crystallization temperature of
629
~700 oC. This would give an approximate δ30Si NBS-28(WR) of -0.10‰.
630
However, the nature of the Δ30Si(WR-zrc) relationship is less predictable as host-rock
631
composition (and mineralogy) change. In other words, there is no simple isotope relationship 632
between the WR and mineral because this relationship is a function of WR mineralogy and 633
composition. Nevertheless, broad predictions can be made within our current framework of 634
understanding. As mentioned, it appears that the relative polymerization degrees of the various 635
mineral and melt phases exert a strong control on the relative Si isotope fractionation between 636
these phases. High-SiO2 melts are both highly polymerized and typically precipitate framework
637
silicates such as quartz, feldspars, and feldspathoids which tend to prefer the heavier isotopes of 638
Si. Zircon (an orthosilicate) crystallizing in this system should therefore strongly favor the 639
lighter isotopes of Si. The largest Δ30Si(WR-zrc)should therefore be associated with zircons
640
formed from high-SiO2 melts, because these systems also crystallize at the lowest temperatures.
641
It is also likely that in evolved but silica-undersaturated systems, where feldspathoids dominate, 642
the difference in polymerization degree between these minerals and zircon – if saturated – should 643
still mean that our Δ30Si(qtz-zrc) calibration will provide a broad estimate of whole-rock Si
644
isotope composition. 645
It is less clear how Δ30Si(WR-zrc) will scale with significantly lower bulk SiO2
646
concentration, but we predict that this magnitude will be smaller for zircons crystallizing from 647
more primitive melts. This could be particularly important for kimberlitic zircons; although their 648
petrogenesis is debated, they are often found intergrown with mafic phases such as Fe-rich 649
olivine, Cr-rich diopsides, and Fe-Ti oxides (Spetsius et al., 2002; Page et al., 2007). The 650
difference in polymerization degree between these phases is minimal, and hence this factor 651
should not exert such a strong control on the Si isotope composition of zircons in this system. 652
In fact, (limited) measurements and calculations do imply that Δ30Si(WR-zrc) positively
653
correlates with the SiO2 content of the WR (Qin et al. 2016; Trail et al., 2018). For instance,
654
Trail et al. (2018) reported a Δ30Si(WR-zircon) value of 0.37 ‰ for a tonalite (~65 wt% SiO2),
655
which broadly agrees with calculations by Qin et al. (2016) who estimated a Δ30Si(WR-zrc)
656
fractionation for an intermediate felsic rock of ~0.3 ‰ at 750 oC. Moreover, the Duluth Gabbro
657
“mantle” zircons analyzed by Trail et al. (2018) have δ30
SiNBS-28 ≈ -0.36‰, which is only subtly
658
lighter than the current estimate for bulk silicate Earth (-0.29 ± 0.07‰, Savage et al., 2014). The 659
effect that decreasing the SiO2 content of the system is predicted to have on Δ30Si(WR-zrc) is
660
illustrated in Figure 9, where the “mafic” value for A (see equation 2) is estimated from the 661
offset of Duluth Gabbro zircons from Si isotope composition of the mantle (δ30Si(BSE)= -0.29
662
‰; Savage et al., 2014) and a formation temperature of 800 °C. It is shown schematically that 663
Δ30
Si(WR-zrc) should decrease as SiO2 of the system decreases; however it should not be
664
assumed that Δ30
Si(WR-zrc) and SiO2 content will vary linearly. This schematic predicts that,
665
when estimating δ30Si(WR) from an out-of-context zircon, one might over- or underestimate the
666
whole rock composition by around 0.25 ‰, which is on the order of the precision of a typical ion 667
microprobe Si isotope measurement. 668
16
Constraining the sensitivity of Δ30Si(WR-zrc) to whole-rock SiO2 is potentially important
669
for better bulk-rock Si isotope composition from Archean-age and older zircons, where the bulk 670
composition of the continental crust is a subject of debate (e.g. Harrison et al., 2017; Greber et al. 671
2017; Caro et al., 2017; Cawood and Hawkesworth, 2019; Deng et al., 2019). Nevertheless, 672
zircons crystallizing from a melt derived from purely igneous sources – i.e., without the 673
involvement of “weathered” material – are expected to display a δ30
SiNBS-28 range from 0.70 to
-674
0.35‰ (if we base the higher bound on the Duluth Gabbro sample). This inference applies to 675
rocks with ~50-78 wt.%, SiO2. Deviations from this δ30SiNBS-28(zircon) range should indicate the
676
presence of “non-igneous” material in the melt source. 677
678
4.4 Δ30
Si(qtz-zrc) and Δ18O(qtz-zrc) as geothermometers?
679 680
Our experiments and natural measurements predict resolvable Si isotope inter-mineral 681
fractionations between zircon and quartz in igneous systems, larger than most other mineral-682
mineral pairs (Savage et al., 2011, 2012; Trail et al., 2018). This opens the possibility that 683
Δ30
Si(qtz-zrc)values could be used as a geothermometer in rocks where quartz and zircon are in
684
equilibrium. In this regard, a key source of comparison is the widely used Ti-in-zircon 685
geothermometer and the Ti-in-quartz geothermobarometer (Watson and Harrison, 2005; Ferry 686
and Watson, 2007; Thomas et al., 2010). This method requires measurement of the Ti content in 687
the phase-of-interest, which is a simple measurement by in-situ techniques. The calibrations are 688
precise (~±20 °C) though there may be uncertainties in the titania activity during zircon and 689
quartz saturation, which could propagate additional uncertainties into the final calculated 690
temperature. Watson and Harrison (2005) estimate a ca. 50o increase in the calculated zircon
691
crystallization temperature for titania activities that change from 1 to 0.5. The titania activity 692
term does not simply cancel out if both phases are considered together because the Ti 693
concentration in quartz is pressure-dependent too (Thomas et al., 2010). 694
However, Δ30Si(qtz-zrc)or Δ18O(qtz-zrc)fractionations can only provide crude inferences
695
about the crystallization temperature, if reasonably pure aliquots of zircon and quartz are 696
obtainable. Such a measurement is also significantly more complex analytically. A measured 697
Δ30
Si(qtz-zrc) of 0.56 ‰ with a precision of 0.06 ‰ would result in a temperature estimate of 698
~700±150 °C (2 s.d.). A similar calculation for Δ18O(qtz-zrc) = 2.46 ‰ with a precision of 0.2
699
‰ yields ~700±130 °C when the O isotope Aqtz-zrc of 2.33 ± 0.24 is applied (Trail et al., 2009).
700
Thus, the current calibrations do not make useful geothermometers, given that errors are so large 701
as to make any such T-based calculation to be of limited value. Considering the isotope systems 702
together, however, may help evaluate whether the two phases crystallized in equilibrium (Figure 703
10). The slope of Δ18O(qtz-zrc) vs. Δ30Si(qtz-zrc) fractionation vs. T is 4.4, reflecting the ratio 704
of the A-values. Coupled measurements of Si and O isotopes in zircon and quartz that are well 705
resolved from a slope of 4.4±1.5 (2 s.d) are likely to have crystallized out of equilibrium. 706
While these igneous T estimates are very crude by most modern techniques, there are 707
systems where such strategies could be of value. Recently, Ackerson et al. (2018) measured Ti 708
contents in quartz from the Tuolumne Intrusive Suite, located in the central Sierra Nevada, 709
California. Coupled with independent pressure estimates, the low Ti contents were interpreted to 710
reflect crystallization temperatures from ~475 to 560 oC. This was not predicted to be an isolated
711
occurrence; for instance, perhaps 75% of the quartz in this suite could have crystallized 100 to 712
200 oC below the wet granite solidus (Ackerson et al., 2018). The use of coupled Δ18O(qtz-zrc)
713
and Δ30Si(qtz-zrc) to probe temperature is potentially appealing because the low predicted