HAL Id: hal-00318165
https://hal.archives-ouvertes.fr/hal-00318165
Submitted on 20 Sep 2006
HAL is a multi-disciplinary open access
archive for the deposit and dissemination of
sci-entific research documents, whether they are
pub-lished or not. The documents may come from
teaching and research institutions in France or
abroad, or from public or private research centers.
L’archive ouverte pluridisciplinaire HAL, est
destinée au dépôt et à la diffusion de documents
scientifiques de niveau recherche, publiés ou non,
émanant des établissements d’enseignement et de
recherche français ou étrangers, des laboratoires
publics ou privés.
cusp latitudes
J. Moen, H. C. Carlson, K. Oksavik, C. P. Nielsen, S. E. Pryse, H. R.
Middleton, I. W. Mccrea, P. Gallop
To cite this version:
J. Moen, H. C. Carlson, K. Oksavik, C. P. Nielsen, S. E. Pryse, et al.. EISCAT observations of plasma
patches at sub-auroral cusp latitudes. Annales Geophysicae, European Geosciences Union, 2006, 24
(9), pp.2363-2374. �hal-00318165�
© European Geosciences Union 2006
Geophysicae
EISCAT observations of plasma patches at sub-auroral cusp
latitudes
J. Moen1,*, H. C. Carlson2, K. Oksavik3, C. P. Nielsen4, S. E. Pryse5, H. R. Middleton5, I. W. McCrea6, and P. Gallop6 1Department of Physics, University of Oslo, Norway
2Air Force Research Laboratory, Air Force Office of Scientific Research, Arlington, Virginia, USA 3The Johns Hopkins University Applied Physics Laboratory, Laurel, Maryland, USA
4Norwegian Polar Institute, Ny-Aalesund, Norway
5Institute of Mathematical and Physical Sciences, University of Wales, Aberystwyth, SY23 3BZ, UK 6Rutherford Appleton Laboratory, Chilton, Didcot, OX11 0QX, UK
*also at: Arctic Geophysics, The University Centre in Svalbard, Longyearbyen, Norway
Received: 30 November 2005 – Revised: 22 March 2006 – Accepted: 26 April 2006 – Published: 20 September 2006 Part of Special Issue “Twelfth EISCAT International Workshop”
Abstract. A sequence of 3 patches of high-density (1012m−3)cold plasma on a horizontal scale-size of 300– 700 km was observed near magnetic noon by the EISCAT VHF radar above Svalbard on 17 December 2001. The patches followed a trajectory towards the cusp inflow region. The combination of radar and all-sky observations demon-strates that the patches must have been segmented equator-ward of the cusp/cleft auroral display, and hence their prop-erties had not yet been influenced by cusp particle showers and electrodynamics on open flux tubes. The last patch in the sequence was intersected by radio tomography observations, and was found to be located adjacent to a broader region of the same high electron density further south. The patches occurred under moderately active conditions (Kp=3) and the total electron content (TEC) of the high-density plasma was 45 TEC units. The train of patches appeared as a segmen-tation of the tongue of ionization. The sequence of patches occurred in association with a sequence of flow bursts in the dusk cell return flow. It is proposed that reconnection driven pulsed convection is able to create sub-auroral patches in the region where high density mid-latitude plasma is diverted poleward toward the cusp. It is the downward Birkeland cur-rent sheet located at the equatorward boundary of the flow disturbance that represents the actual cutting mechanism.
Keywords. Ionosphere (Auroral ionosphere; Electric fields
and currents; Polar ionosphere)
Correspondence to: J. Moen ([email protected])
1 Introduction
Crowley (1996) defined polar cap patches as islands of high density ionospheric plasma surrounded by plasma of half the density or less. After formation by ionospheric cusp dynam-ics, the patches follow the convection pattern across the pole from day to night and are pulled into the nightside oval on ex-iting the polar cap (Buchau et al., 1983; Weber et al., 1984; Lorentzen et al., 2004). Several observation techniques have been used for patch studies, such as direct electron density measurements by ionosonde (Buchau et al., 1983; Dandekar and Bullett, 1999; Dandekar, 2002), incoherent scatter radar (e.g. Valladares et al., 1994, 1996, 1998; Carlson et al., 2002, 2004, 2006; Lockwood and Carlson, 1992; Lockwood et al., 2005a, 2005b; Oksavik et al., 2006a), and ionospheric to-mography (Walker et al., 1999; Pryse et al., 2004), 630.0-nm airglow intensity that is proportional to electron density (We-ber et al., 1984; McEwen and Harris, 1995, 1996; McEwen et al., 1995, 2004; Lorentzen et al., 2004), and more indirectly by HF coherent scatter radars of the SuperDARN network (Rodger et al., 1994; Ogawa et al., 1998; Rodger and Gra-ham, 1996; Milan et al., 2002, 2005; Oksavik et al., 2006a). The latter technique does not provide a measurement of the electron density but gives the backscatter power from irreg-ularities on electron density gradient associated E×B drift instability (Tsunoda, 1988; Chaturvedi and Ossakow, 1981). The SuperDARN network has the advantage of large spatial coverage and high temporal resolution, and also the possibil-ity for conjugate measurements in the Northern and Southern Hemispheres (Rodger et al., 1994).
Electron density patches and associated density gradients give rise to disturbances on HF radio communication links in polar regions and may under extreme conditions give rise
to an inaccuracy or loss of signals in satellite navigation and communication systems. It is important to know when and where these extreme situations may occur. The main focus with regards to the plasma structure has been the formation of polar cap patches in the cusp inflow region. It was recog-nized at an early stage that mid-latitude ionospheric plasma produced by solar EUV provided a viable reservoir of source plasma for polar cap patches, with the plasma being drawn by convection into the polar cap in a tongue of ionization. The tongue of ionization is usually thought of as a homoge-nous stream of plasma that follows the convection stream-lines of the afternoon cell into the cusp region, and hence is a potential source for polar cap ionospheric patches. Us-ing measurements by the Chatanika incoherent scatter radar in Alaska, Foster (1984) mapped the average diurnal pattern of convection and the F-region density around the auroral oval. In the rest frame of the Earth he documented the stag-nation in the plasma flow in the post-noon sector where so-lar EUV ionization is high before heading towards the cusp inflow region. He mapped the cusp convection throat to a longitudinally narrow region of 3-4 hours wide in MLT. In a series of papers Foster and coworkers documented the reg-ular occurrence of high-TEC patches and plumes of ioniza-tion observed in the dusk sector immediately equatorward of the ionospheric trough, a phenomenon called storm en-hanced density events (SEDs) (e.g. Foster, 1993; Foster et al., 2004a). Under disturbed conditions the presence of a sub-auroral electric field driven by tail dynamics speeds up high density plasma to move sunward. Foster et al. (2002) linked an SED event to structuring and drainage of the outer plasmasphere. The phenomenon of SEDs is by observation addressed to the American sector, but one should expect to see similar F-region dynamics in the European sector. Due to the Earth’s dipole tilt relative to its rotational axis, SEDs will occur at higher geographic latitude in the European sec-tor, and hence the electron density of this phenomenon is ex-pected to be much lower than in the American sector.
The difficulty with patch segmentation is to explain the low density regions between patches (Lockwood et al., 2005b). The mechanisms that have been suggested to seg-ment the intake of cold solar EUV ionized plasma into the cusp throat can be divided in three families:
– IMF regulation of the cusp convection pattern causing
alternating intake of high and low density plasma (An-derson et al., 1988; Rodger et al., 1994; Milan et al., 2002).
– Plasma depletion within flow-burst channels due to
en-hanced recombination (Rodger et al., 1994; Sojka et al., 1993; Valladares et al., 1994; Pitout and Blelly, 2003; Pitout et al., 2004) associated with newly-opened mag-netic flux tubes.
– Plasma structuring by transient reconnection where the
open closed boundary (OCB) leaps equatorward to a
gion of higher density plasma, followed by poleward re-laxation of that boundary carrying with it the high den-sity plasma accelerated into the polar flow (Lockwood and Carlson, 1992; Carlson et al., 2002, 2004, 2006). In contrary to polar cap patches observed within the polar cap, the current paper reports on a sequence of patches at sub-auroral cusp latitudes, appearing as a segmentation of the tongue of ionization well equatorward of the auroral cusp on closed magnetic field lines. Localized density enhancements equatorward of the auroral cusp were reported by Pryse et al. (2004). Milan et al. (2002) presented patch structures in HF cusp backscatter interpreted as subauroral patches. In this paper we present a combination of observations by the EIS-CAT radar, all-sky camera and ionopsheric tomography, and as such provide the first documentation of plasma islands ex-isting within the tongue of an ionization region, at subauroral latitudes.
2 Observations
ACE was situated at (235, 31, 0) RE in (X, Y, Z) GSM
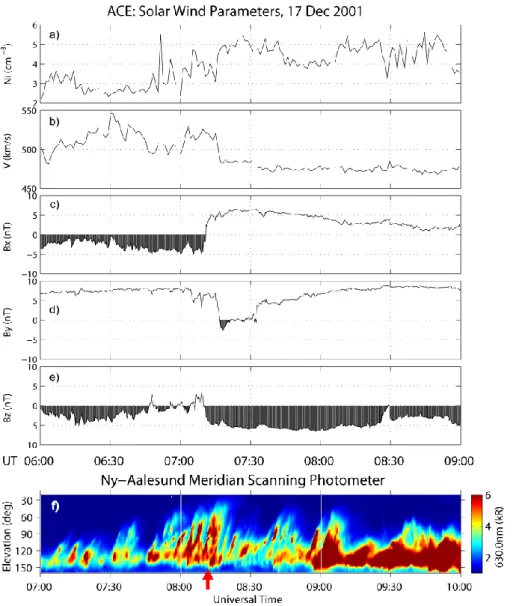
co-ordinates. Solar wind plasma and IMF data from 06:00 to 09:00 UT are presented in Fig. 1. The solar wind speed was ∼500 kms−1, on average, and the delay from ACE to the solar wind impact on the ionosphere was expected to be about 1 h. Figure 1f presents a keogram for the 630.0 nm au-roral emission recorded by the Ny- ˚Alesund Meridian Scan-ning Photometer (78.9◦N, 12.0◦E, 76.0 MLAT) from 07:00 to 10:00 UT. Note that the MSP time axis has been shifted 1 h forward relative to the ACE time axis. The keogram dis-plays emission intensity versus scan angle (15◦north to 175◦
south) and time. This paper will focus on plasma structures observed by EISCAT between 08:00–09:15 UT, and particu-lar attention is therefore drawn to the ACE data from 07:00 to 08:15 UT. BY was strong and positive all morning,
ex-cept for an interval of ∼20 min starting around 07:15 UT, when it suddenly went from 7 nT to –2.5 nT in 2.5 min. Af-ter a brief negative excursion, it hovered around zero until a sudden jump up to 3 nT and then a gradual increase back to values exceeding 5 nT. The sharp, negative transition in BZ
at ∼07:10 UT provides a suitable test on the timing. This is in alignment with a well-defined equatorward step in the cusp auroral boundary at 08:11 UT (marked by a red arrow), consistent with intensified magnetopause reconnection. The cusp aurora was very broad in latitudinal extent at this time, with simultaneous brightening at either side of zenith (90◦
elevation), indicating simultaneous lobe and magnetopause reconnection associated with the BZnegative turning
(Sand-holt et al., 1998). This was followed by a sequence of the classical poleward moving auroral forms (Sandholt et al., 1990, 1993; Denig et al., 1993; Milan et al., 1999; Moen et al., 2001; Oksavik et al., 2004, 2005) attributed to pulsed magnetopause reconnection (Lockwood et al., 1998).
Fig. 1. Solar wind plasma and interplanetary magnetic field (IMF) data measured by ACE near the first Lagrange point from 06:00–09:00 UT (panels a–e), and a keogram of the 630.0-nm auroral emissions recorded by the Ny- ˚Alesund Meridian Scanning Photometer from 07:00– 10:00 UT (panel f). The magnetic field components are presented in GSM coordinates.
The EISCAT VHF radar was operated in a split-beam configuration at its lowest possible elevation (30◦). The geometry is illustrated in the upper left frame of Fig. 3, which we will return to soon. The bore site beam (Beam 1) of the VHF radar was pointing towards geographic north, and Beam 2 pointed 12◦ west of Beam 1 which is to-ward the magnetic pole. The data have been processed at a 1-min resolution. Figure 2a shows electron density measured along Beam 2 from 07:00–09:15 UT (∼10:10– 12:25 MLT), and Fig. 2b shows the corresponding obser-vations from Beam 1. As indicated on the right-hand axis, over the latitude span from 70–75 MLAT, the height varied from 220 km to 600 km. Figures 2c and 2d show electron and ion temperatures from Beam 1, respectively. Figure 2e presents flow vectors obtained by combining line-of-sight
ve-locities from corresponding MLAT positions along the two radar beams. This procedure assumes uniform plasma flow along L-shells, i.e. over a longitudinal distance increasing from 110 km at 70 MLAT to 280 km at 75 MLAT, which can-not always be expected true during local flow disturbances in the cusp. However, in Fig. 2e we see a predominant north-westerly oriented plasma flow, particularly strong poleward of 72.5 MLAT between 07:00–08:00 UT. Transient enhance-ments in Ti(strong Joule heating) are also seen within this
re-gion. Beam 1 observed a band of enhanced electron density between 72–73 MLAT which represents the tongue of ioniza-tion. The equatorward boundary of this band migrated equa-torward and the electron density within the band increased as time progressed. Beam 2 encountered the tongue of ioniza-tion at ∼07:40 UT. A sequence of poleward moving plasma
Fig. 2. Observations from the EISCAT VHF radar plotted versus magnetic latitude and time. Beam 1 was pointing 12◦east of Beam 2, which was directed towards magnetic north. The data shown are: (a) electron density from Beam 2; (b) electron density from Beam 1; (c) electron temperature from Beam 1; (d) ion temperature from Beam 1; and (e) flow vectors derived by combining line-of-sight velocities from Beam 1 and Beam 2.
filaments were observed in both radar beams from 07:00– 07:40 UT. These patch forms are uniquely related to a cor-responding sequence of poleward moving auroral forms seen from 07:00–07:40 UT in Fig. 1f. This time interval provides ample evidence for polar cap ionospheric patches being cut off from the tongue of ionization by transient reconnection, and the event sequence has been examined in detail by Carl-son et al. (2006). They found the patch formation entirely consistent with the Lockwood and Carlson (1992) concep-tual model which strictly relies on the open closed bound-ary (OBC) being located close to a gradient in solar EUV ionized plasma on the equatorward side. The current paper concentrates on the high-density (∼1012m−3)plasma struc-tures that have formed well equatorward of the cusp auroral boundary. In Beam 1, the electron concentration within the tongue of ionization gradually increases from 07:00 UT to 08:10 UT, and then it increases significantly to density
val-ues exceeding ∼1012m−3. Notably, the sudden increase co-incides in time with the southward transition in BZ. The
abrupt decrease in electron density at 08:26 UT marks the onset of a series of three patches. The same pattern is seen in Beam 2 located west of Beam 1, but delayed a few minutes and the forms are stretched further poleward in MLAT, con-sistent with the structures being frozen into a north-westerly plasma drift across the beams.
Red vectors in Fig. 2e have a west component and blue vectors have an east component. Spurious vectors indicate that our homogeneity assumption is violated. From ∼08:15– 09:15 UT in the latitude range from 70–73.5 MLAT a se-quence of four flow enhancements is seen (indicated by black arrows on the time line), intercepted by regions of distorted flow (blue). As will be commented in the Discussion sec-tion, the apparent shape of the patches observed by Beam 1 and Beam 2 is affected by the different look directions and by
08:34.50 UT 08:37.50 UT 08:38.50 UT 08:43.50 UT
08:45.50 UT 08:47.50 UT 08:48.50 UT 08:50.50 UT
08:52.50 UT 08:54.50 UT 08:55.50 UT 08:57.50 UT Beam 1
Beam 2
Patch 1 Patch 1 Patch 1 Patch 1
Patch 2
Patch 1 Patch 1
Patch 2 Patch 2 Patch 2
Patch 2 Patch 2 Patch 3
NIMS
Patch 3
08:52
08:57 08:59
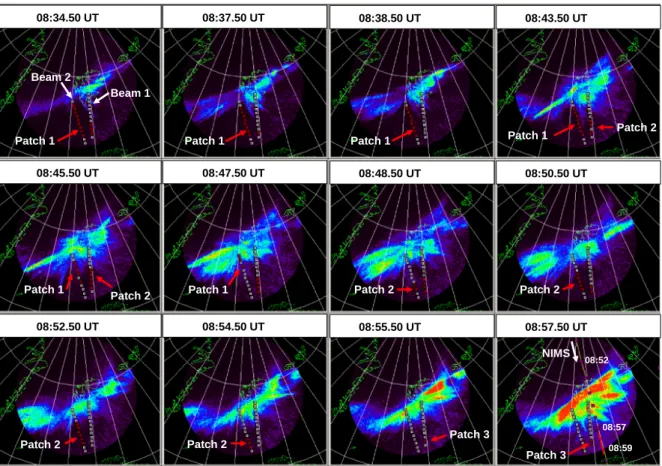
Fig. 3. A sequence of 630.0-nm images from the all-sky imager at Ny- ˚Alesund. The raw images have been cut at 75◦zenith angle and projected onto a geographic map assuming 250 km as the peak emission altitude for the 630.0-nm emission of atomic oxygen (O1S). The time is given on the top of each frame. The radar gates of the two beams of the EISCAT VHF, projected to 250 km altitude, are annotated in the upper left frame. Red squares mark their encounter with cold dense plasma. The yellow line superimposed on the bottom right frame depicts the ray path intersection at 350 km between the NIMS satellite and ground receivers.
spatial and temporal changes in the motion pattern. The cold high density plasma is located within the latitudinal range where pulsed convection bursts are seen.
Figure 3 shows a sequence of 630.0 nm all-sky images covering the time interval from 08:34.50–08:57.50 UT. Red squares mark the radar gates that were covered by patch densities (defined as twice the background), and the time refers to the auroral images. In the upper left image taken at 08:34.50 UT Patch 1 covers both beams simultaneously. It is essential to notice that the patch is located well equa-torward of the auroral boundary, and hence it has not been exposed to particle precipitation. Comparing Figs. 2b and 2c we see bite-outs in the high Te associated with the
high-density plasma structures. Strong Joule heating/high Ti in
Fig. 2d is observed in a region poleward of the patches, i.e. in the auroral cusp region. The patch therefore consists of cold plasma drifting in from the southeast. Between 08:37:50 and 08:38:50 UT the trailing edge of Patch 2 has disappeared from Beam 1. At 08:43:50 UT Patch 1 is still observed in Beam 2, while Patch 2 has just entered Beam 1. The plasma flow then speeds up (Fig. 2e). Patch 1 moves
pole-ward along Beam 2, and at 08:47:50 UT the leading edge in Fig. 2a has entered the auroral precipitation region. At 08:48:50 UT Patch 1 has disappeared, and Patch 2 covers both beams. Patch 2 disappears from Beam 1 at 08:52:50 UT and from Beam 2 just before Patch 3 encounters Beam 1 at 08:55:50 UT. The auroral activity intensified very strongly at the time when Patch 3 entered the EISCAT field-of-view. The auroral band expanded equatorward, and Patch 3 repre-sents the end of high density plasma drifting over the radar.
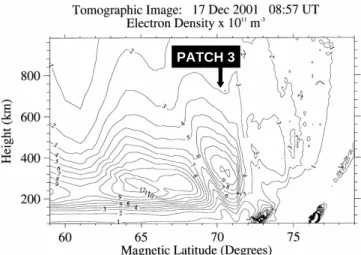
The yellow line superimposed on the bottom right im-age in Fig. 3 depicts the orientation of the plane of the ra-dio tomographic image presented in Fig. 4. Electron den-sity as a function of latitude and height is reconstructed from observed signals from the Navy Ionospheric Mon-itoring System (NIMS) satellite that traversed the region from north to south, crossing 75◦N at about 08:57 UT. The radio tomography monitoring system comprises re-ceivers at Ny- ˚Alesund (78.9◦N, 12.0◦E, 76.0 MLAT), Longyearbyen (78.2◦N, 15.3◦E, 75.1 MLAT), Bear Is-land (74.5◦N, 19.0◦E, 71.3 MLAT), and Tromsø (69.8◦N, 19.0◦E, 66.6 MLAT). The observations are then inverted in
PATCH 3
Fig. 4. A tomographic image of the electron density versus altitude and MLAT obtained along the yellow line in the bottom right image in Fig. 3, just east of the EISCAT field-of-view.
a reconstruction algorithm to create spatial images of the electron density distribution. The electron density is very small poleward of 72 MLAT. Two intensifications are seen below the 200 km altitude; one around 73 MLAT and another around 76.5 MLAT. Whilst some caution is necessary when interpreting the more poleward density enhancement, due to its proximity to an artifact arising from a loss of signal at the Longyearbyen receiver, it is interesting to note that the two enhancements correspond to ongoing precipitation at the two distinct regions observed along the satellite path in the bot-tom right image in Fig. 3. The high-density region between 69 and 72 MLAT is a cut through Patch 3, east of Beam 1. The red bar along the yellow path line marks the tomographic intersection of Patch 3 at the 350 km altitude. Although the F2-maximum may not be correctly positioned in altitude by tomography, the density, of the order of 1012m−3, is entirely consistent with EISCAT. Equatorward of Patch 3 there is a deep minimum. The total electron content (TEC) of Patch 3 is 45 TEC units, dropping to 23 TECu immediately pole-ward of it. The plasma streams entering cusp latitudes re-ported by Foster et al. (2002, 2004a) were 2–3 times higher in TECu, but were observed using signals from GPS satel-lites operating at around 20 000 km altitude. The observa-tions reported in this paper were recorded during moderate geomagnetic conditions with a Kp level of 3, for which storm time enhanced densities (SEDs) are regularly observed in the American sector.
3 Discussion
The IMF BY was 5 nT or higher throughout the time of
in-terest, with the exception of a 20-min time interval. EISCAT observed cold plasma drifting predominantly northwestward,
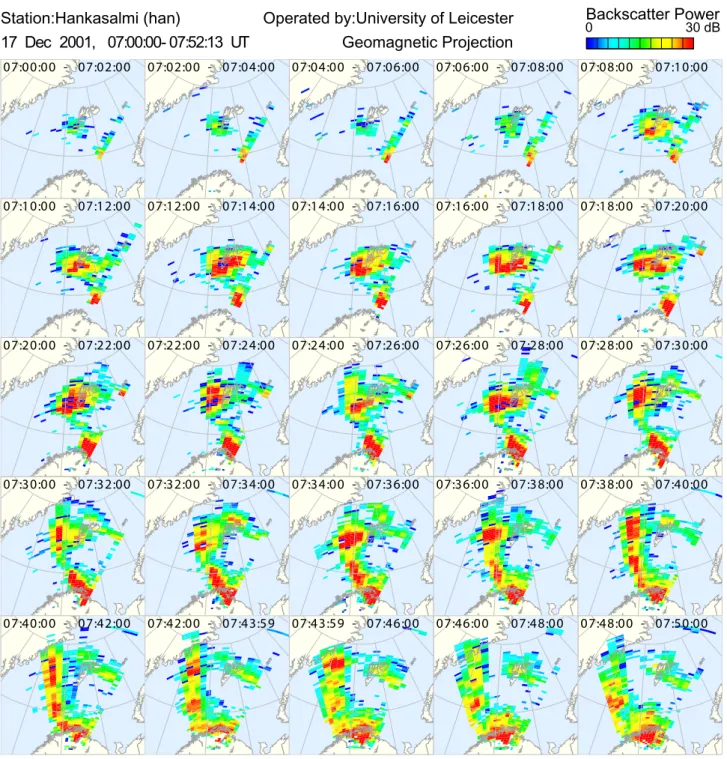
consistent with the radar being situated under the sunward return flow in the post-noon sector (Heppner and Maynard, 1987). Figure 5 shows maps of HF backscatter recorded by the CUTLASS Finland radar from 07:00 to 07:50 UT. Of particular interest is the tongue of enhanced HF backscatter that entered the southeastern corner of the radar field-of-view and then advected poleward to connect with the cusp activity west of Svalbard around 07:38 UT. The region of strongly en-hanced backscatter reached the EISCAT viewing area around 07:30 UT and is consistent with increased electron density around this time seen in Fig. 2a. From 07:34 UT onwards the morphology in the CUTLASS backscatter power indi-cates sub-structures in the tongue of ionization down to the north coast of Norway. The HF backscatter died out very rapidly after 07:50 UT. However, this gives a clear indication of how high density plasma entered the cusp throat.
The equatorward edge of cusp aurora is taken as a proxy for the open-closed boundary (e.g. Moen et al., 1998; Lock-wood et al., 1998; Milan et al., 2003). The tomographic im-age presented in Fig. 4 documents that Patch 3 was fully separated from a high density region at ∼70 MLAT. We therefore conclude that these plasma islands were formed on closed magnetic field lines and belong to a category of patches that is different to that of the polar cap patches that have been under investigation for more than two decades. We therefore introduce a new term, sub-auroral patches, to de-scribe this category at subauroral latitudes.
The apparent size and shape of the patches are different in Beam 1 and Beam 2, in particular Patch 1. This may be due to slightly different look directions, spatial and temporal vari-ability in the flow pattern, and also the shape of the patches. To investigate this further it is assumed that the patches take the shape of a sausage. Patch 1 and Patch 2 hit all radar gates between 72 and 73 MLAT almost simultaneously. Since Beam 1 is pointing toward geographic north, this is consis-tent with an encounter perpendicular to this beam, i.e. a mo-tion toward geographic west that is geomagnetic northwest (cf. Fig. 2). In Beam 2 pointing towards the magnetic pole, the leading edges of all three patches are tilted towards in-creasing latitude with time, a right-tilt. This means a signif-icant component of motion towards the magnetic pole along Beam 2, indicating that Beam 2 was closer to the cusp in-flow region. The slope towards left (decreasing latitude with time), on the trailing edge of patches in Fig. 2b, indicates a southward component of drift in Beam 1 that actually is seen in the line-of-sight flow data (not presented). From Fig. 2 we notice that the cusp auroral boundary migrated equator-ward, which indicates an expansion of the polar cap bound-ary. Pulses of reconnection with the intake of newly-open flux in the polar cap imply rapid boundary movements near the cusp (Lockwood et al., 1993). However, the left-tilt of the trailing edge may in part be due to a thinning of the sausage, more extended at lower latitudes. Patch 1 spent more time in Beam 2 than in Beam 1. From Fig. 2e during the passage of Patch 1 through Beam 2, we see one ion flow spurt at the
30 dB 0
17 Dec 2001, 07:00:00- 07:52:13 UT
Station:Hankasalmi (han)
Operated by:University of Leicester
Backscatter Power
Geomagnetic Projection
07:00:00 - 07:02:00 07:02:00 - 07:04:00 07:04:00 - 07:06:00 07:06:00 - 07:08:00 07:08:00 - 07:10:00 07:10:00 - 07:12:00 07:12:00 - 07:14:00 07:14:00 - 07:16:00 07:16:00 - 07:18:00 07:18:00 - 07:20:00 07:20:00 - 07:22:00 07:22:00 - 07:24:00 07:24:00 - 07:26:00 07:26:00 - 07:28:00 07:28:00 - 07:30:00 07:30:00 - 07:32:00 07:32:00 - 07:34:00 07:34:00 - 07:36:00 07:36:00 - 07:38:00 07:38:00 - 07:40:00 07:40:00 - 07:42:00 07:42:00 - 07:43:59 07:43:59 - 07:46:00 07:46:00 - 07:48:00 07:48:00 - 07:50:00Fig. 5. Maps of HF backscatter power from the CUTLASS Finland radar from 07:00–07:50 UT. Only echoes identified to be of ionospheric origin are shown, and of particular interest is the tongue of enhanced HF backscatter power that entered the field of view from the southeastern corner.
beginning and one spurt at the end. On the top of Patch 1 in Fig. 2a, there are two forms stretching out to increasing latitudes from the patch, each associated with the onset of the above-mentioned flow spurts. In the 08:43.50 UT frame of Fig. 3 we see a thin filament of auroral brightening in the western part of the field-of-view. The flow spurt starts a cou-ple of minutes later in Fig. 2e. This is consistent with a
re-connection burst, first giving rise to an auroral flash followed by a flow enhancement a couple of minutes later, consistent with the time it takes for an Alfv´en wave to transfer momen-tum down to the ionosphere (e.g. Moen et al., 2004; Carlson at al., 2006). The auroral phenomenon, a thin brightening arc filament with an ion flow component perpendicular to it, is a clear manifestation of plasma transport across the OCB,
i.e. reconnection. A similar clear manifestation of magne-topause reconnection was reported by Moen et al. (2001), combining optics and the EISCAT Svalbard Radar. Patches 2 and 3 did not reach the auroral boundary during their transit time through Beam 2. This indicates a westward shift in the cusp throat between Patch 1 and Patch 2. The 20-min inter-val of stronger plasma drift poleward can be explained by the
∼20-min interval of weak IMF BY. Weakening in BY will
introduce an eastward shift of the cusp throat. We inferred a time lag of 1 hour between ACE and the auroral response. The BY explanation for the poleward elongation of Patch 1
requires a time lag of 7 additional minutes, which is not in-consistent. Reconfiguration of the flow pattern will require multiple Alfv´en wave bounce times between the ionosphere and the magnetopause (Moen et al., 2004).
Due to the variability in plasma convection when the patches were in transit through the EISCAT field-of-view, it is not possible to derive an accurate estimate of the patch di-mension. However, Patch 2 arrived in Beam 1 at 08:44 UT and was present for about 9 min. The average flow veloc-ity at an altitude of about 350 km between 08:47–08:52 UT, when the patch covered both radar beams was, 1.3 kms−1 west and 0.3 kms−1 north. Thus, assuming that the density feature moved at a constant westward speed of 1.3 km/s, its maximum longitudinal length was 700 km. Due to the lim-ited EISCAT field-of-view in the F2 region, the observations do not necessarily reveal the full north-south extent of the patches. However, the latitudinal extent observed in Fig. 1a and 1b varied from ∼2–4◦. The patch intersected by iono-spheric tomography in Fig. 3 was about 300 km in the north-south extent.
The patch forms reported here were fully segmented at sub-auroral cusp latitudes down to 70 MLAT. The patches presented here have many similarities with the density fea-tures observed in the same latitude region with the Chatanika radar by Foster and Doupnik (1984); however, they were not able to differentiate between polar cap and subauro-ral patches. Milan et al. (2002) reported sequences of patchy structures in the CUTLASS HF radar backscatter re-turns above Svalbard in the same time sector. Their HF-backscatter patches spanned several degrees in latitude and were similar in spatial dimension to the electron density patches reported in the current paper. However, their patch forms streamed poleward out from a band of backscatter taken as the radar signature of the auroral oval. The patch forms separated from the auroral backscatter boundary at around ∼75 MLAT, which is a typical location of the cusp poleward boundary under moderate activity. Their patches belong therefore to the category of polar cap patches. How-ever, extremely relevant to this current study were struc-tures in HF backscatter regions that they reported at sub-auroral latitudes. Their observations indicated that high den-sity plasma pulled into the cusp from sub-auroral latitudes was replaced by low density plasma from the convection re-turn flow. Milan et al. (2002) suggested that plasma
struc-turing at sub-auroral latitudes, as well as formation of polar patches, can be explained by the IMF-induced changes in the dayside convection, where plasma intake alternates between high and low density source regions. Milan et al. (2002) found their patches to be consistent with high density plasma pulled in from the south during periods dominated by BZ
negative with the intake of lower density plasma occurring when the IMF BY controlling the zonal flow component was
dominating. This current study also has well-defined discon-tinuities in the IMF. The onset of >1012m−3plasma coin-cided in time with a southward turning of IMF, but the low density regions between patches was not regulated by cor-responding enhancements in BY, except maybe Patch 1. As
was mentioned in the above paragraph, the motion pattern of Patch 1 appeared to be influenced by IMF BY, and as
such the minima before and after could potentially be argued from the strengthening in the BY/BZratio before and after.
However, this mechanism cannot explain the formation of Patches 2 and 3 in the sequence. The segmentation must have occurred prior to their encounter into the EISCAT beams, and we therefore have no direct information about the patch seg-mentation. There is no indication of large Ti enhancements
in the low density volumes between the patches in Fig. 2, and if the plasma depletion was due to fast flow channels / Joule heating, it must have occurred outside EISCAT is field-of-view. One key characteristic feature about the sub-auroral patch sequence is the coincidence in time with pulsed return flow, and this will be considered in more detail.
In the sub-auroral dusk, ionosphere storm enhanced den-sity events (SEDs) move sunward towards noon (e.g. Fos-ter, 1993; Foster et al., 2002, 2004a, 2005). The motion is driven by a sub-auroral poleward electric field associ-ated with the low-latitude edge of the sub-auroral polariza-tion stream (SAPS) (Foster and Burke, 2002; Foster and Vo, 2002). The SEDs form in a latitudinally narrow region near the equatorward edge of the ionospheric trough, where the sunward dusk cell convection encounters fresh co-rotating plasma (Foster, 1993). As the SED moves closer to noon, the plasma stream is exposed to a convection electric field that may be dominated by magnetopause reconnection, and which in our case is pulsed. Moen et al. (1995) documented return flow in the morning and convection cells in the after-noon that was pulsed at the same rate as optical transients, en-tirely consistent with the Cowley and Lockwood (1992) con-ceptual model for generating large-scale flow by pulsed mag-netopause reconnection. The possible implication of pulsed return flow on patch formation at sub-auroral cusp latitudes is illustrated in Fig. 6 for two convection bursts. In the up-per frame we assume an elongated channel of high density plasma near the co-rotating boundary. A transient flow en-hancement is then generated by magnetopause reconnection. In the region of particular interest, the flow burst is equiva-lent to a poleward electric field ER between an upward
cur-rent sheet and a downward curcur-rent sheet. Low density and high density plasma is exposed to the same electric field ER.
The downward current sheet represents the equatorward bor-der of the flow disturbance and is the principal component of the patch cutting mechanism. The flow decays to zero after the first patch has fully detached. In this drawing the move-ments of the open closed boundary have been deliberately neglected. The boundary movement represents a balance be-tween opening of the flux at the dayside magnetopause and closure of the flux in the magnetic tail (Cowley and Lock-wood, 1992; Lockwood et al., 2005a). Assuming no tail re-connection the tongue of ionization will not be pushed fur-ther toward the cusp by tail dynamics. The creation of the second patch in Fig. 6 will then require an electric field that penetrates deeper equatorward relative to the OCB than the first one. The two patches are now convecting in the same flow field.
4 Summary and concluding remarks
This paper has presented the first direct observation of sub-auroral patches. These were formed well equatorward of the ionospheric cusp and appeared like structures in the tongue of ionization. The horizontal spatial scale size of the patches was of the order of 300 km×700 km, and their density was of the order of 1012m−3. Had these been observed only within the polar cap, or near the cusp entry region to the polar cap, all prior work in the literature would have led inexorably to one conclusion: that their patch character (island of density at least twice that surrounding it) was derived from processes associated with the passage through the cusp into the polar cap. To the contrary here, the patch character that would have been observed later within the polar cap would have been dominated by a sub-auroral phenomenon, with the patches having segmented from a stream of high-density plasma well equatorward of the cusp precipitation region.
Milan et al. (2002) observed signatures of plasma struc-turing at subauroral cusp latitudes using the CUTLASS Fin-land Radar. At the same time they observed the formation of polar cap patches further north. They found that plasma structuring at sub-auroral latitudes, as well as in the polar cap, was controlled by IMF BY/BZ changes in the
convec-tion flow pattern and an alternating intake of high and low density plasma. This mechanism was not found to be ap-plicable on the sequence of patches presented in this current paper.
The auroral cusp activity has a transient nature, and pulsed reconnection is regarded as the dominant mode of momen-tum transfer (Cowley and Lockwood, 1992; Moen et al., 1995). The association between a sequence of convection bursts and a sequence of patches led us to consider the po-tential role of transient flow at subauroral latitudes. In the case of a pulsed two-cell convection pattern, the dusk cell return flow is bounded by a downward current sheet on the equatorward side of the flow disturbance. Given that an elon-gated tongue of ionization is present, a patch will form when
12 MLT
ER
J||
J||
12 MLT
Fig. 6. Sketch of how an elongated channel of high plasma density enters the subauroral cusp region and is segmented into patches by transient changes in the sub-auroral electric field associated with a downward Birkeland current sheet.
the convection electric field maps over and hence accelerates a portion of the high density tongue. The downward Birke-land current sheet represents the physical cutting mechanism. This is similar to the idea of Anderson et al. (1988), who sug-gested that a discrete increase in the polar cap potential and expansion of the size of the convection pattern will bring in sunlit higher-density plasma from lower latitudes. Here we add the point that penetration of a shielding current sheet and
the sudden increase in penetration latitude will actually seg-ment the plasma north of the shilding current from that south of this boundary. Although related to transient reconnec-tion, our explanation for sub-auroral patches is principally different from the Lockwood and Carlson (1992) model for polar cap patches. In their model the OCB represents the critical boundary. The sub-auroral patches will be subject to the Lockwood and Carlson (1992) model later when they are pulled across the OCB.
The tongue of ionization is normally thought of as a spatial continuous, large-scale feature of higher density plasma that stagnates in the post-noon region of strong solar production, before heading poleward into the polar cap (Foster, 1984, 1993). This may not be true because there are a few reports suggesting great variability in the SAPS electric field (e.g. Foster et al., 2004b; Oksavik et al., 2006b). Using DMSP satellite crossings of the SAPS, Mishin et al. (2003) have also found strong fluctuations in electromagnetic fields and plasma density, suggesting the presence of small-scale, field-aligned currents that ultimately could contribute to initial segmentation of the SED. It should be pointed out that our present knowledge about structuring of sub-auroral plasma is rather limited, and that this is a phenomenon calling for more research.
Acknowledgements. EISCAT is an international association
sup-ported by Finland (SA), France (CNRS), the Federal Republic of Germany (MPG), Japan (NIPR), Norway (NFR), Sweden (NFR), and the United Kingdom (PPARC). CUTLASS is supported by the UK PPARC, the Swedish Institute for Space Physics, and the Finnish Meteorological Institute in Helsinki. The assistance of the University of Tromsø and the Norwegian Polar Research Institute in the tomographic measurements is gratefully acknowledged. We thank the ACE Science Center and the ACE MAG and SWEPAM instrument teams for providing solar wind data from the ACE space-craft. Financial support has been provided by the Norwegian Re-search Council, AFOSR task 2311AS, UK Particle Physics and As-tronomy Research Council under grant PPA/G/O/2003/00017, and NSF grant ATM-0418101.
Topical Editor M. Pinnock thanks S. Milan and an anonymous referee for their help in evaluating this paper.
References
Anderson, D. N., Buchau, J., and Heelis, R. A.: Origin of density enhancements in the winter polar cap ionosphere, Radio Sci., 23, 513–519, 1988.
Buchau, J., Reinisch, B. W., Weber, E. J., and Moore, J. G.: Struc-ture and dynamics of the winter polar cap F-region, Radio Sci., 18, 995–1010, 1983.
Carlson, H. C., Oksavik, K., Moen, J., van Eyken, A. P., and Guio, P.: ESR mapping of polar-cap patches in the dark cusp, Geophys. Res. Lett., 29(10), 1386, doi:10.1029/2001GL014087, 2002. Carlson, H. C., Oksavik, K., Moen, J., and Pedersen, T.:
Iono-spheric patch formation: Direct measurements of the origin of a polar cap patch, Geophys. Res. Lett., 31(8), L08806, doi:10.1029/2003GL018166, 2004.
Carlson, H. C., Moen, J., Oksavik, K., Nielsen, C. P., McCrea, I. W., Pedersen, T. R., and Gallop, P.: Direct observations of injection events of subauroral plasma into the polar cap, Geophys. Res. Lett., 33, L05103, doi:10.1029/2005GL025230, 2006.
Chaturvedi, P. K. and Ossakow, S. L.: The current convective insta-bility as applied to the auroral ionosphere, J. Geophys. Res., 86, 4811–4814, 1981.
Cowley, S. W. H. and Lockwood, M.: Excitation and decay of so-lar wind-driven flows in the magnetosphere-ionosphere system, Ann. Geophys., 10, 103–115, 1992,
http://www.ann-geophys.net/10/103/1992/.
Crowley, G.: Critical review of ionospheric patches and blobs, in: Review of Radio Science 1992–1996, edited by: Stone, W. R., Oxford University Press, UK, 619–648, 1996.
Dandekar, B. S.: Solar cycle dependence of polar cap patch activity, Radio Sci., 37(1), 1013, doi:10.1029/2000RS002562, 2002. Dandekar, B. S. and Bullett, T. W.: Morphology of polar cap patch
activity, Radio Sci., 34(5), 1187–1206, 1999.
Denig, W. F., Burke, W. J., Maynard, N. C., Rich, F. J., Jacobsen, B., Sandholt, P. E., Egeland, A., Leontjev, S., and Vorobjev, V. G.: Ionospheric signatures of dayside magnetopause transients: A case study using satellite and ground measurements, J. Geophys. Res., 98, 5969–5980, 1993.
Foster, J. C.: Ionospheric signatures of magnetospheric convection, J. Geophys. Res., 89, 855–865, 1984.
Foster, J. C.: Storm time plasma transport at middle and high-latitudes, J. Geophys. Res., 98, 1675–1689, 1993.
Foster, J. C. and Doupnik, J. R.: Plasma convection in the vicinity of the dayside cleft, J. Geophys. Res., 89, 9107–9113, 1984. Foster, J. C. and Burke, W. J.: SAPS: A new characterization for
sub-auroral electric fields, EOS, 83, 393–394, 2002.
Foster, J. C. and Vo, H. B.: Average characteristics and activity dependence of the subauroral polarization stream, J. Geophys. Res., 107 (A12), 1475, doi:10.1029/2002JA009409, 2002. Foster, J. C., Erickson, P. J., Coster, A. J., Goldstein, J., and Rich, F.
J.: Ionospheric signatures of plasmaspheric tails, Geophys. Res. Lett., 29(13), 1623, doi:10.1029/2002GL015067, 2002. Foster, J. C., Coster, A. J., Erickson, P. J., Rich, F. J., and Sandel,
B. R.: Stormtime observations of the flux of plasmaspheric ions to the dayside cusp/magnetopause, Geophys. Res. Lett., 31, L08809, doi:10.1029/2004GL020082, 2004a.
Foster, J. C., Erickson, P. J., Lind, F. D., and Rideout, W.: Millstone Hill coherent-scatter radar observations of electric field variabil-ity in the sub-auroral polarization stream, Geophys. Res. Lett., 31, L21803, doi:10.1029/2004GL021271, 2004b.
Foster, J. C., Coster, A. J., Erickson, P. J., Holt, J. M., Lind, F. D., Rideout, W., McCready, M., van Eyken, A., Barnes, R. J., Greenwald, R. A., and Rich, F.: Multiradar observations of the polar tongue of ionization, J. Geophys. Res., 110, A09S31, doi:10.1029/2004JA010928, 2005.
Heppner, J. P. and Maynard, N. C.: Empirical high-latitude electric field models, J. Geophys. Res., 92, 4467–4490, 1987.
Lockwood, M. and Carlson, H. C.: Production of polar cap electron density patches by transient magnetopause reconnection, Geo-phys. Res. Lett., 19, 1731–1734, 1992.
Lockwood, M., Moen, J., Cowley, S. W. H., Farmer, A. D., Løvhaug, U. P., L¨uhr, H., and Davda, V. N.: Variability of day-side convection and motions of the cusp/cleft aurora, Geophys. Res. Lett., 20, 1011–1014, 1993.
Lockwood., M.: Identifying the open-closed field line boundary, in: Polar Cap Boundary Phenomena, edited by: Moen, J., Egeland, A., and Lockwood, M., NATO Advanced Study Institute Series, Kluwer Academic Press, Dordrect, Vol. 509, 415–432, 1998. Lockwood, M., Moen, J., van Eyken, A. P., Davies, J. A.,
Ok-savik, K., and McCrea, I. W.: Motion of the dayside polar cap boundary during substorm cycles: I. Observations of pulses in the magnetopause reconnection rate, Ann. Geophys., 23, 3495– 3511, 2005a.
Lockwood, M., Davies, J. A., Moen, J., van Eyken, A. P., Ok-savik, K., McCrea, I. W., and Lester, M.: Motion of the day-side polar cap boundary during substorm cycles: II., Generation of poleward-moving events and polar cap patches by pulses in the magnetopause reconnection rate, Ann. Geophys., 23, 3513– 3532, 2005b.
Lorentzen, D. A., Shumilov, N., and Moen, J.: Drifting airglow patches in relation to tail reconnection, Geophys. Res. Lett., 31, L02806, doi:10.1029/2003GL017785, 2004.
McEwen, D. J. and Harris, D. P.: Observations of F-layer patches and their convection over the north magnetic-pole, Adv. Space. Res., 16 (1), 69–72, 1995.
McEwen, D. J. and Harris, D. P.: Occurrence patterns of F layer patches over the north magnetic pole, Radio Sci., 31, 619–628, 1996.
McEwen, D. J., Harris, D. P., MacDougall, J. W., and Grant, I. F.: Drifting F-layer patches over the magnetic pole, J. Geomagn. Geoelectr., 47, 527–537, 1995.
McEwen, D. J., Guo, W., MacDougall, J. W., and Jayachandran, P. T.: The polar ionosphere, Adv. Space Res., 34 (9), 2080–2084, 2004.
Milan, S. E., Lester, M., Cowley, S. W. H., Moen, J., Sandholt, P. E., and Owen, C. J.: Meridian-scanning photometer observations of the cusp: a case study, Ann. Geophys., 17, 159–172, 1999, http://www.ann-geophys.net/17/159/1999/.
Milan, S. E., Lester, M., and Yeoman, T. K.: HF radar polar patch formation revisited: summer and winter variations in dayside plasma structuring, Ann. Geophys., 20, 487–499, 2002, http://www.ann-geophys.net/20/487/2002/.
Milan, S. E., Lester, M., Cowley, S. W. H., Oksavik, K., Brittnacher, M., Greenwald, R. A., Sofko, G., and Villain, J.-P.: Variations in the polar cap area during two substorm cycles, Ann. Geophys., 21, 1121–1140, 2003,
http://www.ann-geophys.net/21/1121/2003/.
Milan, S. E., Basu, S., Yeoman, T. K., Sheehan, R. E.: A com-parison of satellite scintillation measurements with HF radar backscatter characteristics, Ann. Geophys., 23, 3451–3455, 2005,
http://www.ann-geophys.net/23/3451/2005/.
Mishin, E. V., Burke, W. J., Huang, C. Y., and Rich, F. J.: Electro-magnetic wave structures within subauroral polarization streams, J. Geophys. Res., 108(A8), 1309, doi:10.1029/2002JA009793, 2003.
Moen, J., Sandholt, P. E., Lockwood, M., Denig, W. F., Løvhaug, U. P., Lybekk, B., Egeland, A., Opsvik, D., and Friis-Christensen, E.: Events of enhanced convection and related dayside auroral activity, J. Geophys. Res., 100, 23 917–23 934, 1995.
Moen, J., Lorentzen, D. A., and Sigernes, F.: Dayside moving au-roral forms and bursty proton auau-roral events in relation to par-ticle boundaries observed by NOAA-12, J. Geophys. Res., 103,
14 855–14 863, 1998.
Moen, J., van Eyken, A. P., and Carlson, H. C.: EISCAT Svalbard Radar observations of ionospheric plasma dynamics in relation to dayside auroral transients, J. Geophys. Res., 106, 21 453–21 461, 2001.
Moen, J., Lockwood, M., Oksavik, K., Carlson, H. C., Denig, W. F., van Eyken, A. P., and McCrea, I. W.: The dynamics and relation-ships of precipitation, temperature and convection boundaries in the dayside auroral ionosphere, Ann. Geophys., 22 (6), 1973– 1987, 2004.
Ogawa, T., Nishitani, N., Pinnock, M., Sato, N., Yamagishi, H., and Yukimatu, A. S.: Antarctic HF radar observations of irregu-larities associated with polar patches and auroral blobs: A case study, J. Geophys. Res., 103, 26 547–26 558, 1998.
Oksavik, K., Moen, J., and Carlson, H. C.: High-resolution obser-vations of the small-scale flow pattern associated with a pole-ward moving auroral form in the cusp, Geophys. Res. Lett., 31, L11807, doi:10.1029/2004GL019838, 2004.
Oksavik, K., Moen, J., Carlson, H. C., Greenwald, R. A., Milan, S. E., Lester, M., Denig, W. F., and Barnes, R. J.: Multi-instrument mapping of the small-scale flow dynamics related to a cusp au-roral transient, Ann. Geophys., 23, 2657–2670, 2005,
http://www.ann-geophys.net/23/2657/2005/.
Oksavik, K., Ruohoniemi, J. M., Greenwald, R. A., Baker, J. B. H., Moen, J., Carlson, H. C., Yeoman, T. K., and Lester, M.: Obser-vations of isolated polar cap patches by the European Incoher-ent Scatter (EISCAT) Svalbard and Super Dual Auroral Radar Network (SuperDARN) Finland radars, J. Geophys. Res., 111, A05310, doi:10.1029/2005JA011400, 2006a.
Oksavik, K., Greenwald, R. A., Ruohoniemi, J. M., Hairston, M. R., Paxton, L. J., Baker, J. B. H., Gjerloev, J. W., and Barnes, R. J.: First observations of the temporal/spatial vari-ation of the sub-auroral polarizvari-ation stream from the Super-DARN Wallops HF radar, Geophys. Res. Lett., 33, L12104, doi:10.1029/2006GL026256, 2006b.
Pitout, F. and Blelly, P.: Electron density in the cusp iono-sphere: increase or depletion?, Geophys. Res. Lett., 30(14), 1726, doi:10.1029/2003GL017151, 2003.
Pitout, F., Escoubet, C. P., and Lucek, E. A.: Ionospheric plasma density structures associated with magnetopause motion: a case study using the Cluster spacecraft and the EISCAT Svalbard Radar, Ann. Geophys., 22, 2369–2379, 2004,
http://www.ann-geophys.net/22/2369/2004/.
Pryse, S. E., Sims, R. W., Moen, J., Kersley, L., Lorentzen, D., and Denig, W. F.: Evidence for solar-production as a source of polar-cap plasma, Ann. Geophys., 22, 1093–1102, 2004,
http://www.ann-geophys.net/22/1093/2004/.
Rodger, A. S. and Graham, A. C.: Diurnal and seasonal occurrence of polar cap patches, Ann. Geophys., 14, 533–537, 1996, http://www.ann-geophys.net/14/533/1996/.
Rodger, A. S., Pinnock, M., Dudeney, J. R., Baker, K. B., and Greenwald, R. A.: A new mechanism for polar patch formation, J. Geophys. Res., 99, 6425–6436, 1994.
Sandholt, P. E., Lockwood, M., Oguti, T., Cowley, S. W. H., Free-man, K. S. C., Lybekk, B., Egeland, A., and Willis, D. M.: Mid-day auroral breakup events and related energy and momentum transfer from the magnetosheath, J. Geophys. Res., 95, 1039– 1060, 1990.
and Hansen, T.: Auroral event sequences at the dayside polar cap boundary for positive and negative IMF BY, J. Geophys. Res., 98, 7737–7756, 1993.
Sandholt, P. E., Farrugia, C. J., Moen, J., Cowley, S. W. H., and Lybekk, B.: Dynamics of the aurora and associated convection currents during a cusp bifurcation event, Geophys. Res. Lett., 25, 4313–4316, 1998.
Sojka, J. J., Bowline, M. D., Schunk, R. W., Decker, D. T., Val-ladares, C. E., Sheehan, R., Anderson, D. N., and Heelis, R. A.: Modeling polar cap F-region patches using time varying convec-tion, Geophys. Res. Lett., 20, 1783–1786, 1993.
Tsunoda, R. T.: High-latitude F region irregularities: A review and synthesis, Rev. Geophys., 26, 719–760, 1988.
Valladares, C. E., Basu, S., Buchau, J., and Friis-Christensen, E.: Experimental evidence for the formation and entry of patches into the polar cap, Radio Sci., 29(1), 167–194, 1994.
Valladares, C. E., Decker, D. T., Sheehan, R., and Anderson, D. N.: Modeling the formation of polar cap patches using large plasma flows, Radio Sci., 31(3), 573–594, 1996.
Valladares, C. E., Decker, D. T., Sheehan, R., Anderson, D. N., Bullett, T., and Reinisch, B. W.: Formation of polar cap patches associated with north-to-south transitions of the interplanetary magnetic field, J. Geophys. Res., 103(A7), 14 657–14 670, 1998. Walker, I. K., Moen, J., Kersley, L., and Lorentzen, D. A.: On the possible role of cusp/cleft precipitation in the formation of polar-cap patches, Ann. Geophys., 17, 1298–1305, 1999,
http://www.ann-geophys.net/17/1298/1999/.
Weber, E., Buchau, J., Moore, J. G., Sharber, J. R., Livingstone, R. C., Winningham, J. C., and Reinisch, B. W.: F-layer ionisation patches in the polar cap, J. Geophys. Res., 89, 1683–1694, 1984.