HAL Id: hal-00940965
https://hal.archives-ouvertes.fr/hal-00940965
Submitted on 11 May 2021
HAL is a multi-disciplinary open access
archive for the deposit and dissemination of sci-entific research documents, whether they are pub-lished or not. The documents may come from teaching and research institutions in France or abroad, or from public or private research centers.
L’archive ouverte pluridisciplinaire HAL, est destinée au dépôt et à la diffusion de documents scientifiques de niveau recherche, publiés ou non, émanant des établissements d’enseignement et de recherche français ou étrangers, des laboratoires publics ou privés.
Measuring water accumulation rates using GRACE data
in areas experiencing glacial isostatic adjustment: The
Nelson River basin
Adrien Lambert, J. Huang, G. van Derkamp, J. Henton, Stephane Mazzotti,
T. S. James, N. Courtier, A. G. Barr
To cite this version:
Adrien Lambert, J. Huang, G. van Derkamp, J. Henton, Stephane Mazzotti, et al.. Measuring water accumulation rates using GRACE data in areas experiencing glacial isostatic adjustment: The Nelson River basin. Geophysical Research Letters, American Geophysical Union, 2013, 40 (23), pp.6118-6122. �10.1002/2013GL057973�. �hal-00940965�
Measuring water accumulation rates using GRACE data in areas
experiencing glacial isostatic adjustment: The Nelson River basin
A. Lambert,1J. Huang,2G. van der Kamp,3J. Henton,2S. Mazzotti,4,5T. S. James,1,5 N. Courtier,1and A. G. Barr3
Received 11 September 2013; revised 13 November 2013; accepted 17 November 2013; published 6 December 2013.
[1] Gravity Recovery and Climate Experiment (GRACE)
satellite-derived total water storage can be obscured by glacial isostatic adjustment. In order to solve this problem for the Nelson River drainage basin in Canada, a gravity rate map from 110 months (June 2002 to October 2011) of GRACE gravity data was corrected for glacial isostatic adjustment using an independent gravity rate map derived from updated GPS vertical velocities. The GPS-based map was converted to equivalent gravity rate using a transfer function developed from GPS and absolute-g data at colocated sites. The corrected GRACE gravity rate map revealed a major positive anomaly within the drainage basin, which was independently shown by hydrological data to be due to changes in water storage. The anomaly represents a cumulative increase at its center of about 340 mm of water, reflecting a progression from extreme drought to extremely wet conditions.Citation: Lambert, A., J. Huang, G. van der Kamp, J. Henton, S. Mazzotti, T. S. James, N. Courtier, and A. G. Barr (2013), Measuring water accumulation rates using GRACE data in areas experiencing glacial isostatic adjustment: The Nelson River basin, Geophys. Res. Lett., 40, 6118–6122, doi:10.1002/2013GL057973.
1. Introduction
[2] From its inception the Gravity Recovery and Climate
Experiment (GRACE) satellite mission [Tapley et al., 2004] was proposed to be a means of measuring the surface mass re-distributions associated with hydrology [Dickey et al., 1997]. Satellite gravimetry has now become well established as a tool for tracking seasonal and interannual variations in total water storage (TWS) [e.g., Wahr et al., 2004; Rodell et al., 2009].
[3] A major challenge in North America, particularly
for tracking interannual variations in TWS, is to correct
GRACE observations for the effects of glacial isostatic adjustment (GIA). Attempts have been made, with limited success, to make the corrections using GIA models, such as 5G (VM2) [e.g., Morrow et al., 2011]. However, ICE-5G (VM2) has been shown to be deficient in our study area [Mazzotti et al., 2011]. Our approach and that of Wang et al. [2013] is to use GPS vertical velocities to empirically correct GRACE gravity data for GIA in North America.
[4] We use the corrected GRACE gravity data to
investi-gate in detail the significant increase in total water storage in the Nelson River drainage basin in central North America from record drought peaking in 2002–2003 [Hanesiak et al., 2011] to seriousflooding in the spring of 2011 [Manitoba 2011 Flood Review Task Force, 2013]. We confirm the gravity results using quantitative measure-ments of total water storage. With the exception of Swenson et al. [2006] who compared GRACE results to in situ hydrological observations from a network of sites in Illinois, most comparisons involve model estimates of TWS [e.g., Rangelova et al., 2007].
[5] We have made a careful reevaluation of the mean rate
and spatial extent of the North American TWS anomaly [Wang et al., 2013] from June 2002 to October 2011, taking advantage of a number of recent observational and computa-tional improvements: (1) The contribution of GIA mass redistribution to the time-dependent gravityfield is evaluated using an updated GPS analysis aligned to International Terrestrial Reference Frame 2005 (ITRF2005) and converted to equivalent gravity based on colocated gravity observations [Mazzotti et al., 2011]. (2) GRACE data are processed using a two-step method [Huang et al., 2012] designed to preserve signal amplitude. (3) The hydrological source of the space-based residual gravity anomaly is quantitatively confirmed by means of level records from deep observation wells used as geological weighing lysimeters and water balance data from an experimental watershed instrumented with several flux towers. (4) The TWS accumulation is further confirmed by a long series of absolute gravity observations corrected for GIA and the elastic subsidence induced by the water load.
2. GRACE Gravity Rates
[6] A total of 110 global, monthly, spherical harmonic,
Release 4, GRACE models from the Center for Space Research for the period of 2002–2011 have been used to create a gravity rate contour map for the study area (Figure 1). All the monthly models are complete to spherical harmonic degree and order 60, which is approximately equivalent to a spatial resolution of 350 km in the region of study. In standard GRACE data processing [Bettadpur, 2007; Flechtner, 2007], gravity effects of secular variations
Additional supporting information may be found in the online version of this article.
1Geological Survey of Canada, Natural Resources Canada, Sidney,
British Columbia, Canada.
2Geodetic Survey Division, Natural Resources Canada, Ottawa, Ontario,
Canada.
3National Hydrology Research Centre, Environment Canada, Saskatoon,
Saskatchewan, Canada.
4Géosciences Montpellier, Université Montpellier 2, Montpellier, France. 5
School of Earth and Ocean Sciences, University of Victoria, Victoria, British Columbia, Canada.
Corresponding author: A. Lambert, Geological Survey of Canada, Natural Resources Canada, 9860 W. Saanich Rd., Sidney, BC V8L 4B2, Canada. ([email protected])
©2013 Her Majesty the Queen in Right of Canada.
Geophysical Research Letters ©2013 American Geophysical Union. 0094-8276/13/10.1002/2013GL057973
of the low-degree harmonics, solid Earth, ocean and pole tides, and atmospheric and nontidal oceanic variations are combined and removed before release of the gravity field information.
[7] A two-step method has been used to extract the gravity
change signal from the GRACE models [Huang et al., 2012]. First, a destriping step by Swenson and Wahr [2006] is used to correct the GRACE model coefficients. An additional destriping criterion is applied on the RMS ratio between the original and destriped coefficients to minimize the loss of signal. Second, a statistical test step similar to that of Davis et al. [2008] is used to identify signal-dominant coefficients that do not require filtering and to apply nonisotropic Gaussianfiltering [Han et al., 2005] solely to the remaining coefficients. This two-step method minimizes the resulting signal loss from the three methods while retaining their efficiency and effectiveness in extracting the signal. The mean rate of each coefficient over the GRACE observation period is estimated on a 0.5° × 0.5° grid to synthesize the gravity rate map (Figure 1). The map shows a gravity rate pattern with the peak rate around Hudson Bay reflecting the effect of glacial isostatic adjustment. However, the gravity rate contours and the zero rate line are shifted significantly toward the southwest, suggesting a possible influence other than glacial isostatic adjustment.
3. GPS Vertical Velocities and Derived Gravity Rates
[8] GPS vertical velocity measurements provide an
inde-pendent method of mapping GIA over the study area and can be used to correct the GRACE gravity rate map to reveal other mass redistributions such as water. We define the vertical velocity field in the North America midcontinent region using 27 continuous GPS stations from Hudson Bay to central U.S. and from the Rocky Mountains to the Great Lakes [Mazzotti et al., 2011] combined with velocities from over 50 more densely spaced Canadian Base Network (CBN) monuments [Henton et al., 2006]. Continuous network velocities were aligned to the ITRF2005 realization of the International Terrestrial Reference Frame [Altamimi
et al., 2007], and CBN velocity solutions from a number of monument occupations from 1995 to 2011 were oriented and scaled to fit the continuous GPS network solutions [Lambert et al., 2013]. Vertical velocities at individual sites have been interpolated to a grid with 2° × 2° spacing and smooth contours were estimated to produce a vertical velocity map for the Nelson River drainage basin (Figure 2). We consider this velocity map to be dominated by the GIA process with a small influence from water loading (section 4). [9] A gravity rate map associated with GIA mass
redistri-bution was derived from the vertical velocity map and applied as a correction to the GRACE gravity rate map. We first converted the vertical velocity map into a gravity rate map as would be measured on the Earth’s surface and then removed the“free-air” effect of vertical surface movement. In this study we used annual absolute gravity measurements collocated with continuous GPS at eight sites in central North America to derive the actual ratio between vertical velocity and rate of change of gravity on the surface. The GPS velocities and absolute gravity rates for all sites except one are shown to fit a linear relationship with a slope of 0.165 ± 0.012μGal/mm [Lambert et al., 2013], a rate slightly more negative than the theoretical rate of 0.15μGal/mm [Wahr et al., 1995] and 0.16 [James and Ivins, 1998]. The rejected site (Saskatoon) showed an anomalously high gravity rate due to the water storage accumulation begin-ning soon after its inception in 2001, as described in this paper. Gravity rates at other sites were less affected by TWS variations due to a combination of favorable site geology and record length spanning previous periods of relatively high water storage. The gravity rate to velocity relationship when corrected for the effect of vertical surface movement ( 0.3086μGal/mm) yielded a ratio of gravity rate to vertical velocity of +0.144 ± 0.012μGal/mm. This ratio was used to convert the velocity map (Figure 2) into an equivalent gravity rate map (Figure S1 in the supporting information) for correcting the GRACE gravity data.
4. GIA-Free Gravity Rates
[10] We compute a gravity rate difference map (Figure 3a)
(GRACE minus derived gravity) by applying the GPS-derived gravity rate map, after spherical harmonic truncation to degree 60 (Figures S1a and S1b) as a GIA correction to the monthly GRACE data before the two-step processing. To avoid possible edge effects associated with spherical harmonic “ringing,” the GPS-derived gravity rate corrections are com-puted over a significantly larger area (35°N, 235°E; 68°N, 290°E) than the study area shown in thefigures. Beyond this larger area the corrections are blended into the ICE3G model (Figure S2).
[11] The corrected GRACE gravity map (Figure 3a) shows
a significant gravity rate anomaly centered just west of the Manitoba-Saskatchewan border at the headwaters of the Assiniboine River. Based on hydrological data from Saskatchewan described in the next section, we infer that the gravity rate anomaly revealed in the“corrected” GRACE map results from water accumulation over the GRACE observation period from 2002 to 2011. The water thickness equivalent rates corresponding to an anomaly of this scale are slightly larger (~2%), when elastic deformation beneath the load is taken into account, than for the case of a rigid Earth [Simon et al., 2010]. At maximum they peak at around Figure 1. Gravity rate from 110 monthly GRACE models
(2002–2011) (1 μGal = 10 nm/s2).
34 mm/yr (Figure 3b). The expected, mean, load-induced, elastic, vertical subsidence rate over the same period is calculated to reach 1.2 mm/yr (Figure S3). Fortunately, the combined GPS data began several years before the period of drought followed by rapid water storage accumulation, which reduces the subsidence effect on the GPS vertical velocity map to a few tenths of a millimeter per year. With reference to Figure 4a, showing water loading history for typical sites, we see that loading from 2003 onward tends to be offset by unloading in earlier years. Thus, the load displacement rate of ~1 mm/yr after 2002 is reduced to <0.25 mm/yr for the longer (1995–2011) GPS time series [Lambert et al., 2013, Appendix B].
5. Comparison With Hydrological and Absolute Gravity Data
[12] Observation wells in deep confined aquifers can be
used as geological weighing lysimeters because the water-level records reflect changes of total mass above the aquifer in the vicinity of the well [Marin et al., 2010], thus providing a direct measure of the changes in the total water storage. The effective sensing area of“geolysimeter” wells for transients with durations of months to years is tens to hundreds of square kilometers, judging by the response of such aquifers
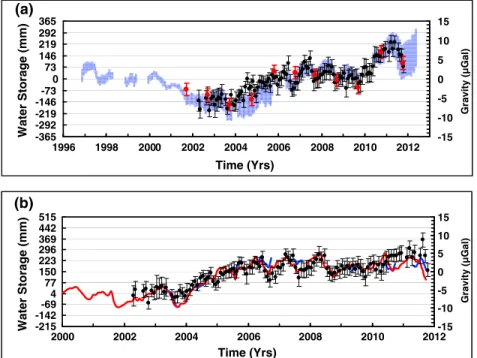
to long-term pumping withdrawals. The loading efficiency is about 0.8 for short-term variations of barometric pressure and likely near 1.0 for multiyear transients [Marin et al., 2010]. As suggested by Bardsley and Campbell [2000], “geolysimeters” can provide an independent verification of GRACE results. There is good agreement between the mean of four geolysimeters in southwest Saskatchewan (locations, Figure 3b), GRACE data centered on Saskatoon, and surface absolute gravity observed at Saskatoon (Figure 4a). All clearly show the accumulation of total water storage from 2002 to 2011. Note that both the GRACE and the absolute-g data have been corrected for the GIA absolute-gravity rates estimated from GPS. Further corrections have been made to the absolute-g data for the vertical subsidence caused by the anomalous water load and for the gravitational attraction of soil moisture variations on the roof of the measurement vault (Table S1). These are in addition to the standard corrections made to typical FG5 absolute gravity data [Niebauer et al., 1995; Mazzotti et al., 2011]. The trend of the GRACE data from 2002 to 2011 divided by the trend of the geolysimeter mean (converted to equivalent gravity change) yields a ratio of 1.02 ± 0.08, whereas the trend ratio for absolute gravity is 0.85 ± 0.25 over the same period. Considering the< 1.0 loading efficiency of the geolysimeters these ratios are upper limits.
[13] The White Gull Creek watershed in central
Saskatchewan (603 km2, not including hydrologically iso-lated White Gull Lake) is instrumented with three long-term continuously operating eddy flux towers plus up to four supplementary towers [Barr et al., 2012] and provides another quantitative measure of changes in total water storage for comparison with GRACE. We compare the GRACE gravity values corrected for GIA and centered on the watershed with the cumulative monthly mean water storage estimated by two different methods (Figure 4b): (1) measured storage change estimated directly from soil moisture and water table measurements at representative sites averaged over the watershed and (2) measured precipitation (P) minus evapotranspiration (E) averaged over the watershed minus outflow at the watershed outlet (P E outflow). Note that evapotranspiration has been measured directly withflux towers and corrected for energy balance [Barr et al., 2012]. There is good agreement between variations in GRACE gravity and the two measurements of water storage until Figure 2. GPS-observed vertical velocities.
Figure 3. (a) Residual gravity rates and (b) corresponding water thickness equivalent rates. Locations of comparison sites are shown for deep wells (yellow diamonds), absolute-g site (red star), and White Gull Creek watershed (yellow triangle).
the high levels of 2010–2011 when the surface values tend to be lower. This could reflect the efficient drainage of the White Gull watershed compared with adjacent watersheds which contain small lakes. The limited water storage changes in these lakes, which cover<5% of the area, might make a small additional contribution to the GRACE signal. On the other hand, the overall GRACE trend (2002–2011) matches the water storage trend well. The ratio of GRACE-derived water storage to measured water storage trend is 1.07 ± 0.12
6. Discussion and Conclusions
[14] A map of the mean gravity rate derived from GRACE
data over the period 2002–2011 and corrected for GIA using independent GPS and absolute-g observations reveals a large-scale anomaly of 1.4μGal/yr or 34 mm/yr, peaking in the upper Assiniboine River watershed east of Saskatoon. Wefind good agreement between corrected GRACE gravity rates and hydrological measures of total water storage variations in two areas of southern Saskatchewan, confirming the origin of the GRACE anomaly as water storage. The anomalously high trend in absolute-g observations at Saskatoon is also explained by water storage accumulation. Vertical deflection of 1.1 mm/yr caused by water loading affects the absolute-g trend significantly, particularly as the observations began close to the time of storage minimum. In contrast, the vertical deflection is estimated to have an insignificant effect on GPS velocities as a result of longer observation periods, which include a predrought period of higher water storage. The rise of TWS from 2004 to 2007 appears to be largely a recovery from the decline of water storage during the unusual drought on the Canadian prairies from 1999 to 2005 [Hanesiak et al., 2011]. The
GRACE-GPS data show that the hydrological conditions leading to thefloods of the spring of 2011 started to develop in 2010 due to heavy summer rainfall, in agreement with hydrologi-cal analysis [Manitoba 2011 Flood Review Task Force, 2013]. Computations that extend beyond our study area (Figure S2) show a smaller TWS accumulation in the adjacent upper Missouri River basin to the south, identified by Famiglietti and Rodell [2013].
[15] The comparison with water storage results from our
small number of sites does not constitute validation of the GRACE data. The agreement with our point surface measurements is surprising, considering that simulations for our study area assuming uniform TWS change show that the GRACE signal amplitude is damped to 55% of the input amplitude. However, this GRACE omission error is very much dependent on the spectral content of the water mass. If the TWS change varies smoothly, resembling the GRACE anomaly itself, the damping factor can be as high as 90% in the areas where our sites are located. Thus, over large watersheds where water storage rates fall off gradually from a central maximum, GRACE can provide an accurate integrated measurement that is complementary to traditional hydrological point measurements of total water content, precipitation, evapotranspiration, and runoff. Based on the total water storage rate map for our study area, we have com-puted a map of total water storage for the period 2002–2011 (Figure S4) and from that have estimated a total water accumulation of 455 ± 74 Gt or 48 ± 8 Gt/yr (supporting information). We conclude that combining GRACE gravity rates and GPS vertical velocities is an effective method of measuring water storage changes over large continental areas, especially in formerly ice-covered regions where adjustment is ongoing. -215 -142 -69 4 77 150 223 296 369 442 515 Time (Yrs) Water Storage (mm) -15 -10 -5 0 5 10 15 Gravity (µGal) (b) -365 -292 -219 -146 -73 0 73 146 219 292 365 2000 2002 2004 2006 2008 2010 2012 1996 1998 2000 2002 2004 2006 2008 2010 2012 Time (Yrs) Water Storage (mm) -15 -10 -5 0 5 10 15 Gravity (µGal) (a)
Figure 4. (a) Comparison of average pressures (in equivalent water depth) from four deep wells near Saskatoon (vertical blue bars, mean ± standard error) with GRACE data centered on Saskatoon (black dots) and surface absolute gravity observed at Saskatoon (red dots), and (b) comparison of measured water storage variation by two different methods (details in text) in the White Gull Creek watershed in central Saskatchewan with GRACE data centered on the watershed. Red curve denotes P - E - outflow. Vertical bars are standard errors. Relative scales for gravity (right) and equivalent water (left) are for surface loading of an elastic Earth. Note that Figures 4a and 4b have different timescales.
[16] Acknowledgments. We thank two anonymous reviewers and the editor, M. Bayani Cardenas, for helpful improvements to the manuscript. Surface geodetic data acquisition and processing was supported by Manitoba Hydro, Natural Resources Canada, and (U.S.) National Oceanic and Atmospheric Administration. Raw GRACE data and monthly geopotential models were provided by the German Aerospace Center (DLR) and the Center for Space Research, U. of Texas. Observation well data were provided by the Saskatchewan Water Security Agency. We thank Karen Simon for calculating surface loading displacements, Mike Craymer for Canadian Base Network analyses and Calvin Klatt for internal review. This work was carried out under the Groundwater Geoscience and Climate Change Geoscience Programs, Natural Resources Canada. This is Geological Survey of Canada contribution 20130292.
[17] The Editor thanks Erik Ivins and an anonymous reviewer for assistance in evaluating this manuscript.
References
Altamimi, Z., X. Collilieux, J. Legrand, B. Garayt, and C. Boucher (2007), ITRF2005: A new release of the international terrestrial reference frame based on time series of station positions and earth orientation parameters, J. Geophys. Res., 112, B09401, doi:10.1029/2007JB004949.
Bardsley, W. G., and D. I. Campbell (2000), Natural geological weighing lysimeters: Calibration tools for satellite and ground surface gravity monitoring of subsurface water-mass change, Nat. Resour. Res., 9, 147–156.
Barr, A. G., G. van der Kamp, T. A. Black, J. H. McCaughey, and Z. Nesic (2012), Energy balance closure at the BERMSflux towers in relation to the water balance of the White Gull Creek watershed 1999–2009, Agric. For. Meteorol., 153, 3–13.
Bettadpur, S. (2007), Level-2 gravityfield product user handbook, GRACE 327-734, CSR-GR-01-01.
Davis, J. L., M. E. Tamisiea, P. Elosegui, J. X. Mitrovica, and E. M. Hill (2008), A statisticalfiltering approach for Gravity Recovery and Climate Experiment (GRACE) gravity data, J. Geophys. Res., 113, B04410, doi:10.1029/2007JB005043.
Dickey, J. O., et al. (1997), Satellite gravity and the geosphere, in National Research Council Report, pp. 112, Natl. Accad. Press, Washington, D. C. Famiglietti, J. S., and M. Rodell (2013), Water in the balance, Science, 340,
1300, doi:10.1126/science.1236460.
Flechtner, F. (2007), GFZ Level-2 processing standards document, GRACE 327-743, GR-GFZ-STD-001.
Han, S. C., C. K. Shum, C. Jekeli, C. Y. Kuo, C. Wilson, and K. W. Seo (2005), Non-isotropicfiltering of GRACE temporal gravity for geophysi-cal signal enhancement, Geophys. J. Int., 163(1), 18–25.
Hanesiak, J. M., et al. (2011), Characterization and summary of the 1999–2005 Canadian Prairie drought, Atmos. Ocean, 49(4), 421–452. Henton, J. A., M. R. Craymer, R. Ferland, H. Dragert, S. Mazzotti, and
D. L. Forbes (2006), Crustal motion and deformation monitoring of the Canadian landmass, Geomatica, 60(2), 173–191.
Huang, J., J. Halpenny, W. van der Wal, C. Klatt, T. S. James, and A. Rivera (2012), Detectability of groundwater storage change within the Great Lakes Water Basin using GRACE, J. Geophys. Res., 117, B08401, doi:10.1029/2011JB008876.
James, T. S., and E. Ivins (1998), Predictions of Antarctic crustal motions driven by present-day ice sheet evolution and by isostatic memory of the
Last Glacial Maximum, J. Geophys. Res., 103, 4993–5017, doi:10.1029/ 97JB03539.
Lambert, A., J. Henton, S. Mazzotti, J. Huang, T. S. James, N. Courtier, and G. van der Kamp (2013), Postglacial rebound and total water storage variations in the Nelson River drainage basin: A gravity-GPS study; Geological Survey of Canada, Open File 7317, 21 p., doi:10.4095/ 292189.
Manitoba 2011 Flood Review Task Force (2013), Report to the minister of Manitoba infrastructure and transportation-appendices, pp. 184, http:// www.gov.mb.ca/asset_library/en/2011flood_review_task_force_appendices. pdf, Winnipeg, Manitoba.
Marin, S., G. van der Kamp, A. Pietroniro, B. Davison, and B. Toth (2010), Use of geological weighing lysimeters to calibrate a distributed hydrolog-ical model for the simulation of land-atmosphere moisture exchange, J. Hydrology, 383, 179–185.
Mazzotti, S., A. Lambert, J. Henton, T. S. James, and N. Courtier (2011), Absolute gravity calibration of GPS velocities and glacial isostatic adjustment in mid-continent North America, Geophys. Res. Lett., 38, L24311, doi:10.1029/2011GL049846.
Morrow, E., J. X. Mitrovica, and G. Fotopoulis (2011), Water storage, net precipitation, and evapotranspiration in the Mackenzie River basin from October 2002 to September 2009 inferred from GRACE satellite gravity data, J. Hydrometeorology, 12, 467–473, doi:10.1175/2010JHM1278.1. Niebauer, T. M., G. S. Sasagawa, J. E. Faller, R. Hilt, and F. Klopping
(1995), A new generation of absolute gravimeters, Metrologia, 32, 159–180.
Rangelova, E., W. van der Wal, A. Braun, M. G. Sideris, and P. Wu (2007), Analysis of Gravity Recovery and Climate Experiment time-variable mass redistribution signals over North America by means of principal component analysis, J. Geophys. Res., 112, F03002, doi:10.1029/ 2006JF000615.
Rodell, M., I. Velicogna, and J. S. Famiglietti (2009), Satellite-based estimates of groundwater depletion in India, Nature, 460, 999–1002, doi:10.1038/nature08238.
Simon, K. M., T. S. James, and E. R. Ivins (2010), Ocean loading effects on the prediction of Antarctic glacial isostatic uplift and gravity rates, J. Geod., 84, 305–317, doi:10.1007/s00190-010-0368-4.
Swenson, S., and J. Wahr (2006), Post-processing removal of correlated errors in GRACE data, Geophys. Res. Lett., 33, L08402, doi:10.1029/ 2005GL025285.
Swenson, S., P. J.-F. Yeh, J. Wahr, and J. Famiglietti (2006), A comparison of terrestrial water storage variations from GRACE with in situ measure-ments from Illinois, Geophys. Res. Lett., 33, L16401, doi:10.1029/ 2006GL026962.
Tapley, B., S. Bettadpur, J. Ries, P. Thompson, and M. Watkins (2004), GRACE measurements of mass variability in the Earth system, Science, 305, 503–505, doi:10.1126/science.1099192.
Wahr, J., D. Han, and A. Trupin (1995), Predictions of vertical uplift caused by changing polar ice volumes on a viscoelastic earth, Geophys. Res. Lett., 22, 977–980.
Wahr, J., S. Swenson, V. Zlotnicki, and I. Velicogna (2004), Time variable gravity from GRACE: First results, Geophys. Res. Lett., 31, L11501, doi:10.1029/2004GL019779.
Wang, H., J. Lulu, H. Steffen, P. Wu, L. Jiang, H. Hsu, L. Xiang, Z. Wang, and B. Hu (2013), Increased water storage in North America and Scandinavia from GRACE gravity data, Nat. Geosci., 6, 38–42, doi:10.1038/ngeo1652.