HAL Id: hal-00330926
https://hal.archives-ouvertes.fr/hal-00330926
Submitted on 25 Oct 2007
HAL is a multi-disciplinary open access
archive for the deposit and dissemination of
sci-entific research documents, whether they are
pub-lished or not. The documents may come from
teaching and research institutions in France or
abroad, or from public or private research centers.
L’archive ouverte pluridisciplinaire HAL, est
destinée au dépôt et à la diffusion de documents
scientifiques de niveau recherche, publiés ou non,
émanant des établissements d’enseignement et de
recherche français ou étrangers, des laboratoires
publics ou privés.
Possible seismo-ionosphere perturbations revealed by
VLF signals collected on ground and on a satellite
A. Rozhnoi, O. Molchanov, M. Solovieva, V. Gladyshev, O. Akentieva,
Jean-Jacques Berthelier, Michel Parrot, François Lefeuvre, M. Hayakawa, L.
Castellana, et al.
To cite this version:
A. Rozhnoi, O. Molchanov, M. Solovieva, V. Gladyshev, O. Akentieva, et al.. Possible
seismo-ionosphere perturbations revealed by VLF signals collected on ground and on a satellite. Natural
Hazards and Earth System Science, Copernicus Publications on behalf of the European Geosciences
Union, 2007, 7 (5), pp.617-624. �hal-00330926�
Nat. Hazards Earth Syst. Sci., 7, 617–624, 2007 www.nat-hazards-earth-syst-sci.net/7/617/2007/ © Author(s) 2007. This work is licensed under a Creative Commons License.
Natural Hazards
and Earth
System Sciences
Possible seismo-ionosphere perturbations revealed by VLF signals
collected on ground and on a satellite
A. Rozhnoi1, O. Molchanov1, M. Solovieva1, V. Gladyshev1, O. Akentieva2, J. J. Berthelier3, M. Parrot4, F. Lefeuvre4, M. Hayakawa5, L. Castellana6, and P. F. Biagi6
1Institute of the Earth Physics, RAS, Moscow, Russia 2Institute of Space Research, RAS, Moscow, Russia 3Institute CETP, Paris, France
4LPCE/CNRS, Orleans, France
5University of Electro-Communications, Chofu, Tokyo, Japan 6Department of Physics, University of Bari, Bari, Italy
Received: 23 May 2007 – Revised: 28 September 2007 – Accepted: 1 October 2007 – Published: 25 October 2007
Abstract. The results of the monitoring of three VLF/LF signals collected in Petropavlovsk station (Kamchatka, Rus-sia) and one VLF signal collected on board of the DEME-TER French satellite are presented. Two periods of the seis-mic activity occurred in the Japan-Kamchatka area during November–December 2004 and July–September 2005 were investigated and the earthquakes with M≥6.0 in the Japan-Kamchatka area, located inside one or more of the third Fresnel zones of the three radio paths were considered. The ground data were analysed using residual signal of phase dP or of amplitude dA, defined as the difference between the signal and the average of few quiet days (±5 days) immedi-ately preceding or following the current day. Also the satel-lite data were processed by a method based on the difference between the real signal and the reference one, but in order to obtain this last signal it was necessary to construct previously a model of the signal distribution over the selected area. The method consists: (a) in averaging all the data available in the considered region over a period characterized by low level seismicity, regardless of the global disturbances, in particu-lar, of the magnetic activity; (b) in computing a polynomial expression for the surface as a function of the longitude and the latitude. The model well describes the real data in condi-tion of their completeness and in absence of magnetic storms or seismic forcing. In the quoted periods of seismic activity clear anomalies both in the ground and in satellite data were revealed. The influence of the geomagnetic activity cannot to be excluded, but the seismic forcing seems more probable.
Correspondence to: P. F. Biagi (biagi@fisica.uniba.it)
1 Introduction
The effects of the seismic activity on the ionosphere, which occur over periods from several hours to several days ei-ther during the preparatory phase or during the post-seismic relaxation phase, can be investigated using the VLF (3– 30 kHz)-LF (30-300 kHz) radio signals.
The main results were obtained for frequencies from 20 kHz to 50 kHz using receivers located on the ground. Us-ing the TT (terminator time) method, that is related to the position of a minimum of the radio signal amplitude/phase during sunset and sunrise, anomalies from 3 days to 10 days before large (M>6.0) earthquakes and continuing few days after their occurrence were revealed (Hayakawa et al., 1996; Molchanov and Hayakawa, 1998; Yamauchi et al., 2005). A different method of analysis is based on the study of the night time fluctuations in the radio signals phase and/or ampli-tude. Using this method, anomalies before earthquakes with M≥5.5 have been reported (Gufeld et al., 1992; Rozhnoi et al., 2004; Shvets et al., 2004). Recently, results obtained in the high LF band (180–300 kHz) were also presented (Biagi and Hayakawa, 2002; Biagi et al., 2004).
VLF-LF (low band) radio signals radiated by powerful transmitters located on the ground can be received not only by ground receivers but also on board of satellites. Re-cently, some possible seismic disturbances were presented by Molchanov et al. (2006). Particularly, some precursory effect on the occasion of the big Sumatra earthquake (26 De-cember 2004; M=9.0) were pointed out. Besides, the quoted study indicates that from the satellite data seismic effects can be revealed for earthquakes with M≥5.5 and a sensitive area ranging from 1000 km for M=5.5 to 5000 km for M=9.0 can be considered.
618 A. Rozhnoi et al.: Seismic disturbances in ground and satellite VLF signals
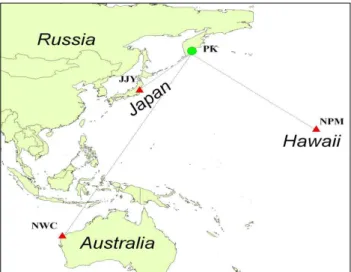
Fig. 1. Map showing the location of the VLF/LF receiver (PK, Kamchatka-Russia) and of the three transmitters [JJY (Japan), NWC (Australia) and NPM (Hawaii)].
All the quoted anomalies are related to disturbances in the upper atmosphere and lower ionosphere which are different from the variations caused by the global perturbations con-nected with the planetary waves, the solar activity and the magnetic storms (Liperovsky et al., 1992; Rozhnoi et al., 2006).
In this paper the preliminary results of the analysis of the VLF/LF signals radiated by high power transmitters and col-lected both at a ground receiver and on board a satellite are presented.
2 Instrumental technique and data collection
The ground receiver is located in Petropavlovsk-Kamchatsky (Kamchatka, Russia), is indicated as PK and it is described in Rozhnoi et al. (2004). The equipment measures, with a sampling rate of 20 s, the phase and the amplitude of the ra-dio signals from the three transmitters labelled: JJY (40 kHz, Japan), NWC (19.8 kHz, Australia) and NPM (21.4 kHz, Hawaii islands). The location of the receiver and of the three transmitters is indicated in the Fig. 1.
The satellite is the DEMETER micro-satellite built by the French CNES (Centre National d’Etudies Spatiales) that was launched on 29 June 2004 on a nearly circular ∼710 km al-titude quasi-heliosynchronous orbit at 98◦inclination.
Mea-surements of the electric and magnetic components of the electromagnetic waves are performed respectively by the ICE (Instrument Champ Electrique) equipment (Berthelier et al., 2006) and by the IMSC (Instrument Magnetic Search Coil) equipment (Parrot et al., 2006). These instruments provide the power spectra of one electric and one magnetic compo-nent averaged over 2 s in the ELF and VLF ranges between 20 Hz and 20 kHz with a frequency resolution of 19.5 Hz.
Fig. 2. (a) On the left, the model of the signal distribution for VLF transmitter NWC (19.8 kHz) during January–March 2005 is presented. The right panel shows the distribution of the real data. (b) The same as in Fig. 2a, but in a relief presentation and at dif-ferent projections. On the left: the real data (above) and the model (below) under 45◦to equator and 45◦elevation angle. On the right: the real data (top), the model (bottom) and their difference (middle) under 10◦to equator and 10◦elevation angle.
In this study, only the electric field measurements were considered. It must be noted that due to the frequency up-per limit of the satellite reception, only the NWC radio sig-nal, among the ground collected ones, is comparable with the satellite data.
Then, it must be taken into account that, in the VLF fre-quency range up to 20 kHz, the NWC transmitter represents the most powerful and stable signal with respect to the other ones received on the satellite.
3 Data processing
At first, let us consider the ground measurements. At day time, the VLF/LF signals are strongly affected by sudden ionospheric disturbances; so, in our analysis only the night data have been considered. Moreover, the amplitude and the phase of such signals present seasonal and monthly varia-tions. In order to reduce this effect, we used a residual signal of phase dP or amplitude dA, defined as the difference be-tween the signal and the average of few quiet days (±5 days)
A. Rozhnoi et al.: Seismic disturbances in ground and satellite VLF signals 619
a
b
Fig. 3. (a) The red line represents the SNR values along the evening orbit 5311 of 2 July 2005 in dependence of the longitude (top panel) and latitude (bottom panel). The position of the orbit is shown on the red square in the map. The blue line represents the model values and the blue dash lines represent the ±2σ , where σ is the standard deviation. The 2 July 2005 can be considered a normal day. (b) The same representations of the Fig. 3a but for the disturbed day 30 August 2005 (orbit 6170).
immediately preceding or following the current day:
d A = A − hAi d P = P − hP i
where A and P are the mean amplitude and the mean phase for the current day (night), while hAi and hP i are the aver-ages of the mean values on the quiet days (nights). A day is considered quiet in absence of ionosphere or magnetosphere activity, of magnetic storms, of atmosphere cyclones and so on (Rozhnoi et al., 2004).
As it concerns the satellite data, the first step was to obtain the intensity of the VLF transmitter signal. At this purpose it is necessary to correct the data collected from the parasitic effects that can superimpose on the signal, such as the instru-ment background noise and the natural emissions (mainly hiss or whistlers). Besides, it is necessary to take into ac-count the influence of the scattering which is the major effect on some parts of the orbits. This data processing is detailed in Molchanov et al. (2006) and it provides the signal to noise
620 A. Rozhnoi et al.: Seismic disturbances in ground and satellite VLF signals
a
b
Fig. 4. (a) Map showing the locations of the earthquakes with M≥6.0 in the period November–December 2004. The sensitivity zone of the PK-JJY radio signal is represented by a continue red line; parts of the sensitivity zones of the PK-NWC and PK-NPM signals are shown by black dash lines. The earthquakes in the sensitivity zone of the PK-JJY signal are reported in the Table 1. (b) The circles indicate the location of the large (M≥6.0) earthquakes in the same period located in the reception zone of the NWC radio signal by the DEMETER satellite. The earthquakes of the Table 1 are represented by circles filled in red. The rectangle on the right represents the zone of analysis and the rectangle on the left (free from earthquakes) is the reference zone.
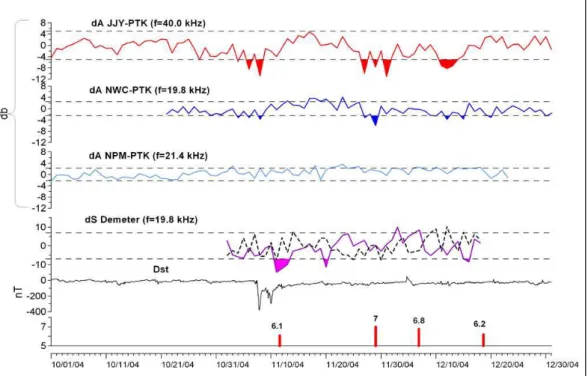
Fig. 5. The panel at the top represents the dA trend for the PK-JJY (Japan) radio signal. The next two panels show the dA trends related to the PK-NWC (Australia) and to the PK-NPM (Hawaii) radio signals. dA is the difference between the signal amplitude and the average of few quiet days. The successive panel represents the dS trend of the NWC radio signal observed on a board of DEMETER satellite; the solid line is related to the right rectangle of the Fig. 4b and the dash-dot line to the reference rectangle of the same figure. At the bottom the Dst
(geomagnetic activity) variations and the time occurrence and magnitude of the earthquakes listed in Table 1, are shown.
A. Rozhnoi et al.: Seismic disturbances in ground and satellite VLF signals 621
a
b
Fig. 6. (a) Map showing the locations of the earthquakes with M≥6.0 in the period July–September 2005. The sensitivity zone of the PK-JJY radio signal is represented by a continue red line; parts of the sensitivity zones of the PK-NWC and PK-NPM signals are shown by black dash lines. The earthquakes in the sensitivity zone of the PK-JJY signal are reported in the Table 2. (b) The circles indicate the location of the large (M≥6.0) earthquakes in the same period located in the reception zone of the NWC radio signal by the DEMETER satellite. The earthquakes of the Table 2 are represented by circles filled in red. The rectangle on the right represents the zone of analysis and the rectangle on the left (free from earthquakes) is the reference zone.
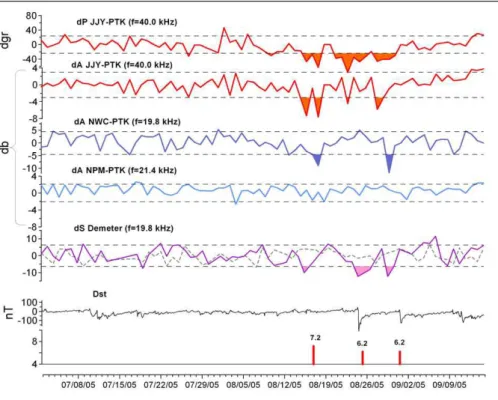
Fig. 7. The two panels at the top represent the dP and dA trends for the PK-JJY (Japan) radio signal related to the period from 1 July to 15 September 2005. dP and dA represent the difference between the signal phase/amplitude and the relative average of few quiet days. The meaning of the other panels is the same of the panels in Fig. 5.
622 A. Rozhnoi et al.: Seismic disturbances in ground and satellite VLF signals
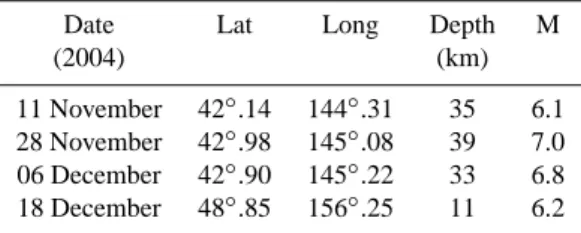
Table 1. Some characteristics of the large earthquakes (Japan-Kamchatka) occurred in the sensitivity zone for the wave paths in the period November–December 2004.
Date Lat Long Depth M
(2004) (km)
11 November 42◦.14 144◦.31 35 6.1 28 November 42◦.98 145◦.08 39 7.0 06 December 42◦.90 145◦.22 33 6.8 18 December 48◦.85 156◦.25 11 6.2
ratio, here named S. In analogy to the ground based data analysis, only the data for evening orbits were used. Then, the second step was to determine the anomalous variations of the signal as differences between the instantaneous value and some representative “reference level”. It must be taken into account that the satellite measurements are obtained in a 2D space; so, it is necessary to determine a reference sur-face over the region of interest which provides the “reference level” of the VLF signal intensity as a function of the longi-tude and the latilongi-tude. In this study, a simplified approach to compute this surface was used. The method consists: (a) in averaging all the data available in the considered region over a period characterized by low level seismicity, regardless of the global disturbances, in particular, of the magnetic activ-ity; (b) in computing a polynomial expression for the surface as a function of the longitude and the latitude. As it concerns the item (a), the length of the period was selected equal to 2 months in order to be not affected by the seasonal variations, providing 353 orbits with about 500 measurements on each orbit. As it concerns the item (b), the method of the local polynomial interpolation (Gandian, 1963) was used; this fit-ting procedure, which erases the large peaks and deep valleys observed in the data set, provides a longitude and latitude res-olution of 0.32◦. In conclusion, choosing a 2 months period during January–March 2005, the result is shown in the Fig. 2. The deviation of the real data from the model is rather small and inside the model dispersion in the normal days; differ-ent is the situation in the disturbed days. Two examples are shown in the Fig. 3. The first one (Fig. 3a) is for the normal day 2 July 2005; the second example (Fig. 3b) is for the dis-turbed day 30 August 2005. In this last case, it must be noted the evident drop of the real signal amplitude.
Using the reference surface, at any time and for any lon-gitude and latitude in an active region, it is possible to define the anomalous variations of the VLF signal as the difference between the measured amplitude S (t, longitude, latitude) and the reference value Sm(longitude, latitude).
Table 2. Some characteristics of the large earthquakes (Japan-Kamchatka) occurred in the sensitivity zone for the wave paths in the period July–September 2005.
Date Lat Long Depth M
(2005) (km)
16 August 38◦.25 142◦.08 36 7.2 24 August 38◦.54 142◦.86 55 6.2 30 August 38◦.49 143◦.15 23 6.2
4 Results
In order to reveal a possible influence of the earthquakes on the radio signals, the periods November–December 2004 and July–September 2005, in which several large earthquakes oc-curred in the Japan-Kamchatka area, were considered.
For the ground measurements, the third Fresnel zone re-lated to a radio path is considered the most sensitive to the large seismicity (Molchanov and Hayakawa, 1998; Rozhnoi et al., 2004). So, in this analysis we selected the earthquakes with M≥6.0 in the Japan-Kamchatka area, located inside one or more of the third Fresnel zones of the PK-JJY, PK-NWC and PK-NPM radio paths.
As it concerns the November–December 2004 period, these earthquakes are listed in Table 1 and the epicenters are indicated in the Fig. 4a, with the complete indication of the third Fresnel zone for the JJY transmitter and a part of the same zone for the NWC and NPM transmitters.
For the satellite measurements the NWC reception zone by the satellite is divided into 9 rectangles, 2 from them are shown in the Fig. 4b. The longitude width of each rectan-gle is determined in 25◦ which corresponds to 1 orbit in a day above the selected area. The quoted earthquakes, indi-cated in the Fig. 4b with red points, are related to the right rectangle. For checking the satellite reception, the left rect-angle is selected that is also inside the reception zone but it is not involved by seismic activity. In order to reduce both the dependence by the regular change of the signal distribu-tion inside the recepdistribu-tion zone and the spurious variadistribu-tions, the averaged difference dS=<S−Sm> is calculated, where the
averaging is produced over orbit in each rectangle.
Figure 5 shows the results of the ground measurements in the period from 1 October to 31 December 2004 and of the satellite measurements in the period from 1 November to 17 December 2004. Unfortunately the satellite data were missed in October 2004 and during the second half of De-cember 2004. The dashed horizontal lines in the dA and dS trends represent the 2σ level, where σ is the standard devi-ation of the relative data. The drops of the data out these levels are filled. At the bottom of the Fig. 5, the trend of the
Dstindex representing the geomagnetic activity and the time
occurrences of the earthquakes of the Table 1 are shown, too.
A. Rozhnoi et al.: Seismic disturbances in ground and satellite VLF signals 623 As it concerns the July–September 2005 period, the
se-lected earthquakes are listed in Table 2 and the epicenters are indicated in the Fig. 6a, with the complete indication of the third Fresnel zone for the JJY transmitter and a part of the same zone for the NWC and the NPM transmitters. The po-sitions of the same earthquakes for the satellite recordings are indicated by the red points in the Fig. 6b and are related to the right rectangle; the left rectangle, again, is for checking.
Figure 7 shows the results of the ground and the satellite measurements in the period from 1 July to 15 September 2005. The dashed horizontal lines in the dP , dA and dS trends have the same meaning mentioned for the Fig. 5 and the drops of the data out of the 2σ levels are filled. Again the geomagnetic activity (Dst index) and the occurrence of the
earthquakes (Table 2) are represented at the bottom of the Fig. 7.
5 Discussion
The filled drops of dA, dP and dS data, indicated in the Figs. 5 and 7, can be assumed as anomalies.
Figure 5, related to November–December 2004, shows that anomalies probably appear before all the four earth-quakes of Table 1 in the JJY registration and before three of the four earthquakes in the satellite recordings. Note that such anomalies are absent for the satellite recordings in the control rectangle.
Figure 7, related to July–September 2005, shows that anomalies appear before all the three earthquakes of Table 2 in the satellite recording and in the ground data of the PK-JJP path.
In both the previous figures none anomaly appears in the NPM registrations; on the contrary some anomaly appears in the NWC ground registrations. Taking into account that the NWC frequency is the same of the satellite recording here ex-amined, we note a good agreement in two cases of the Fig. 7 and none agreement in the Fig. 5.
In principle, the previous anomalies could be related to the seismicity or to the geomagnetic activity. According to our opinion, the seismic forcing is more probable due to: (a) the absence of the effect in the NPM data for the ground ob-servation; (b) the absence of significant perturbations in the control rectangle for the satellite recordings; (c) the appear-ance of the effect before earthquakes, when the geomagnetic activity was regular, as in the case of the large (M=7.2) 16 August 2005 earthquake.
The mechanism of the VLF signal interaction with seismo-related ionosphere turbulence is detailed in Molchanov et al. (2002). It is suggested that resonant scattering of the VLF waves can be produced by perturbations on the ionosphere plasma density and it leads to significant drops of the signal amplitude.
6 Conclusions
It seems that the method of satellite monitoring by seismo-induced perturbations of the ionosphere using VLF signals is efficient as the ground monitoring of VLF subionospheric signals, in condition of a proper quality of the satellite data. This study is only a preliminary analysis; more data must be collected and further analyses must be performed. In any case, the preliminary results here presented encourage the intensification of the satellite monitoring.
Acknowledgements. This research is performed under ISTC grant 2290.
Edited by: M. Contadakis
Reviewed by: C.-V. Meister and two other anonymous referees
References
Berthelier, J. J., Godefroy, M., Leblanc, F., Malingre, M., Men-vielle, M., Lagoutte, D., Brochot, J. Y., Colin, F., Elie, F., Legen-dre, C., et al.: ICE, the electric field experiment on DEMETER, Planet. Space Sci., 54, 456–471, 2006.
Biagi, P. F. and Hayakawa, M.: Possible premonitory behaviour of LF radiowaves on the occasion of the Slovenia earthquakes (M=5.2-6.0-5.1) occurred on March–May 1998, in: Seismo-Electromagnetics, edited by: Hayakawa, M. and Molchanov, O., TERRAPUB, Tokyo, 2002.
Biagi, P. F., Piccolo, R., Castellana, L., Ermini, A., Martellucci, S., Bellecci, C., Capozzi, V., Perna, G., Molchanov, O., and Hayakawa, M.: Variations in a LF radio signal on the occasion of the recent seismic and volcanic activity in Southern Italy, Phys. Chem. Earth, 29, 551–557, 2004.
Gandian, L. S.: Objective Analysis of Meteorological Fields (in Russian), Gidrometizdat, Leningrad, 1963.
Gufeld, I. L., Rozhnoi, A. A., Tyumensev, S. N., Sherstuk, S. V., and Yampolsky, V. S.: Radiowave disturbances in period to Rudber and Rachinsk earthquakes, Phys. Solid Earth, 28(3), 267–270, 1992.
Hayakawa, M., Molchanov, O. A., Ondoh, T., and Kawai, E.: The precursory signature effect of the Kobe earthquake on subiono-spheric VLF signals, J. Commun. Res. Lab., 43, 169–180, 1996. Liperovsky, V. A., Pokhotelov, O. A., and Shalimov, S. L.,
Iono-spheric precursors of earthquakes, Nauka, 1992.
Molchanov, O. A. and Hayakawa, M.: Subionospheric VLF signal perturbation possibly related to earthquakes, J. Geophys. Res., 103, 17 489–17 504, 1998.
Molchanov, O. A., Hayakawa, M., Afonin, V. V., Akentieva, O. A., and Mareev, E. A.: Possible influence of seismicity by grav-ity waves on ionospheric equatorial anomaly from data of IK-24 satellite 1. Search for idea of seismo-ionosphere coupling, in: Seismo-Electromagnetics (Lithosphere-Atmosphere-Ionosphere Coupling), edited by: Hayakawa, M. and Molchanov, O., Ter-rapub, 275–285, 2002.
Molchanov O., Rozhnoi, A., Solovieva, M., Akentieva, O., Berthe-lier, J.-J., Parrot, M., Lefeuvre, F., Biagi, P. F., and Hayakawa, M.: Global diagnostics of ionospheric perturbations associ-ated with seismicity using VLF transmitter signals received on
624 A. Rozhnoi et al.: Seismic disturbances in ground and satellite VLF signals
DEMETER satellite, Nat. Hazards Earth Syst. Sci., 6, 745–753, 2006,
http://www.nat-hazards-earth-syst-sci.net/6/745/2006/.
Parrot, M., Benoist, D., Berthelier, J. J., Błe¸cki, J., Chapuis, Y., Colin, F., Elie, F., Fergeau, P., D. Lagoutte, F. Lefeuvre, et al.: The magnetic field experiment IMSC and its data processing on-board DEMETER: Scientific objectives, description and first re-sults, Planet. Space Sci., 54, 441–455, 2006.
Rozhnoi, A., Solovieva, M. S., Molchanov, O. A., and Hayakawa, M.: Middle latitude LF (40 kHz) phase variations associated with earthquakes for quiet and disturbed geomagnetic conditions, Phys. Chem. Earth, 29, 589–598, 2004.
Rozhnoi, A. A., Solovieva, M. S., Molchanov, O. A., Hayakawa, M., Maekawa, S., and Biagi, P. F.: Sensitivity of LF signal to global ionosphere and atmosphere perturbations in the network of stations, Phys. Chem. Earth, 31, 409–415, 2006.
Shvets, A. V., Hayakawa, M., Molchanov, O. A., and Ando, Y.: A study of ionospheric response to regional seismic activity by VLF radio sounding, Phys. Chem. Earth, 29, 627–637, 2004. Yamauchi, T., Maekawa, S., and Hayakawa, M.: Some results of
subionospheric LF radio monitoring on the ionospheric pertur-bations for the 2004 OFF Kii-Peninsula and Niigata prefecture Chuetsu earthquakes, IWSE-2005, 15–17 March programme and extended abstracts, 487–490, 2005.