HAL Id: hal-00153171
https://hal.archives-ouvertes.fr/hal-00153171
Submitted on 1 Jan 2016
HAL is a multi-disciplinary open access
archive for the deposit and dissemination of
sci-entific research documents, whether they are
pub-lished or not. The documents may come from
teaching and research institutions in France or
abroad, or from public or private research centers.
L’archive ouverte pluridisciplinaire HAL, est
destinée au dépôt et à la diffusion de documents
scientifiques de niveau recherche, publiés ou non,
émanant des établissements d’enseignement et de
recherche français ou étrangers, des laboratoires
publics ou privés.
Identification of broad-band waves above the auroral
acceleration region: Cluster observations
M. Backrud, M. André, A. Balogh, S. Buchert, N. Cornilleau-Wehrlin, A.
Vaivads
To cite this version:
M. Backrud, M. André, A. Balogh, S. Buchert, N. Cornilleau-Wehrlin, et al.. Identification of
broad-band waves above the auroral acceleration region: Cluster observations. Annales Geophysicae,
Euro-pean Geosciences Union, 2004, 22 (12), pp.4203-4216. �10.5194/angeo-22-4203-2004�. �hal-00153171�
Annales Geophysicae (2004) 22: 4203–4216 SRef-ID: 1432-0576/ag/2004-22-4203 © European Geosciences Union 2004
Annales
Geophysicae
Identification of broad-band waves above the auroral acceleration
region: Cluster observations
M. Backrud1,2, M. Andr´e1,2, A. Balogh3, S. Buchert1, N. Cornilleau-Wehrlin4, and A. Vaivads1
1Swedish Institute of Space Physics, Box 537, SE-751 21 Uppsala, Sweden
2Dept. of Astronomy and Space Physics, Uppsala University, Box 515, SE-751 20 Uppsala, Sweden 3The Blacket Laboratory, Imperial College, Prince Consort Road, London SW7 2BW, London, UK 4CETP/CNRS, University of Versailles Saint Quentin, 10–12 Av. De l’Europe, 78140 V´elizy, France
Received: 1 March 2004 – Revised: 13 September 2004 – Accepted: 15 September 2004 – Published: 22 December 2004
Abstract. We investigate broad-band emissions at
frequen-cies above the ion gyrofrequency on auroral field lines at geocentric distances of about 4.5 Earth radii. Observations by the Cluster satellites are used to study the wave character-istics and to determine the wave modes involved. All events include some bursts of broad-band emissions with a substan-tial component of the electric field parallel to the geomag-netic field. Studying the polarization of the emissions we find that linear waves in a homogeneous plasma can be used to theoretically describe the observations.
The broad-band emissions include short bursts of ion acoustic waves, and longer periods of ion Bernstein and Elec-trostatic Ion Cyclotron (EIC) waves. All waves occur during the same event within a few seconds, with EIC waves as the most common. Theoretically, there is no sharp limit between these wave modes and they can be described by the same dis-persion surface. These emissions are closely associated with low-frequency Alfv´en waves, indicating a possible genera-tion mechanism.
Key words. Magnetospheric physics (auroral phenomena;
electric fields; plasma waves and instabilities)
1 Introduction
Broad-band extremely low-frequency (ELF) wave emissions below the ion plasma frequency have been observed by a number of spacecraft and rockets on auroral field lines (e.g. Gurnett et al., 1977; Wahlund et al., 1998; Kintner et al., 2000). The importance of these broad-band emissions for transverse ion heating and electron acceleration in the auro-ral regions is now rather well established (e.g. Boehm et al., 1995; Knudsen et al., 1998; Hamrin et al., 2002, and refer-ences therein). However, the exact mechanism(s) for medi-ating this energy transfer and the wave mode(s) involved are not well known. In this paper we investigate the nature of the
Correspondence to: M. Backrud
broad-band emissions, using data from the Cluster satellites at altitudes of about 4.5 Earth radii (RE)on field-lines above
the auroral acceleration region.
Previous studies of broad-band emissions observed by sounding rockets and the Freja satellite at altitudes up to 1700 km suggest that the emissions are sometimes electro-static ion cyclotron (EIC), ion acoustic (IA) or slow ion acoustic waves (Bonnell et al., 1996; Kintner et al., 1996; Wahlund et al., 1998). Suggested generation mechanisms in-clude field-aligned currents and low-frequency Alfv´en waves (Wahlund et al., 2003, and references therein).
One important clue to the nature (e.g. the wave mode) of the broad-band emissions is their polarization. One field component that is complicated to determine from observa-tions is the electric field component parallel to the geomag-netic field. Cattell et al. (1998) presented observations of substantial parallel electric fields at altitudes of a few RE
of uni- and bipolar wave packets and solitary waves. Other previous studies have concentrated on essentially static elec-tric fields in solitary Alfv´en waves (e.g. Chust et al., 1998). We show that wave bursts with large and dominating parallel electric fields are common in broad-band emissions at fre-quencies above the ion gyrofrequency, at least in the region we study.
We investigate the perpendicular and parallel electric and magnetic waveforms of broad-band emissions at frequencies above the proton gyrofrequency to determine the wave po-larization and to test if the emissions can be well described as linear waves. We find that the observations are consistent with a mixture of various wave modes including IA, EIC and ion Bernstein waves, theoretically described by the same dis-persion surface. The observed emissions are closely associ-ated with low-frequency Alfv´en waves, indicating a possible generation mechanism.
4204 M. Backrud et al.: Broad-band waves above the auroral acceleration region
2 Instrumentation and observations
Cluster is a four-satellite mission designed for detailed stud-ies of the terrestrial magnetosphere (Escoubet et al., 1997). The orbits are approximately polar, and the satellites spin at 15 rpm in a plane essentially coinciding with the GSE x-y plane. In this study we consider in detail data from the EFW double-probe electric field and wave instrument with two pairs of probes in the spin plane of each satellite (Gustafsson et al., 1997), together with observations from the FGM fluxgate (Balogh et al., 1997) and the STAFF search coil (Cornilleau-Wehrlin et al., 1997) tri-axial magnetome-ters. The sampling rates (filters) used during the events we consider here are for EFW 450 Hz (low-pass 180 Hz), for FGM 67 Hz and for STAFF 450 Hz (band-pass between 10 and 180 Hz), unless otherwise stated. Since we want to study wave polarization in detail, and since the spacecraft spin-axis component of the electric field is not measured by EFW, we have selected events where the angle between the magnetic field and the spin-plane is small. This allows an estimate of the wave components both perpendicular and parallel to the geomagnetic field.
On 6 February 2002, around 01:20 UT, the Cluster fleet passed over the nightside northern auroral oval at a geocen-tric distance of 4.5 RE. The spacecraft were configured as
pearls on a string and flew almost perpendicularly to the am-bient magnetic field. The inter-spacecraft distance was rel-atively small. Spacecraft 2 and 3 were separated by only 80 km, with satellite 2 leading satellite 3, and with satel-lite velocity vectors nearly perpendicular to the geomagnetic field. The separation in the direction perpendicular to the ve-locity and to the magnetic field was about 45 km. Figure 1 shows an overview of two minutes of data from spacecraft 2. Here the gyrofrequencies were 7.2 Hz (H+) and 0.45 Hz
(O+), respectively, and the density was calculated to about
4 cm−3, based on measurements from the Whisper
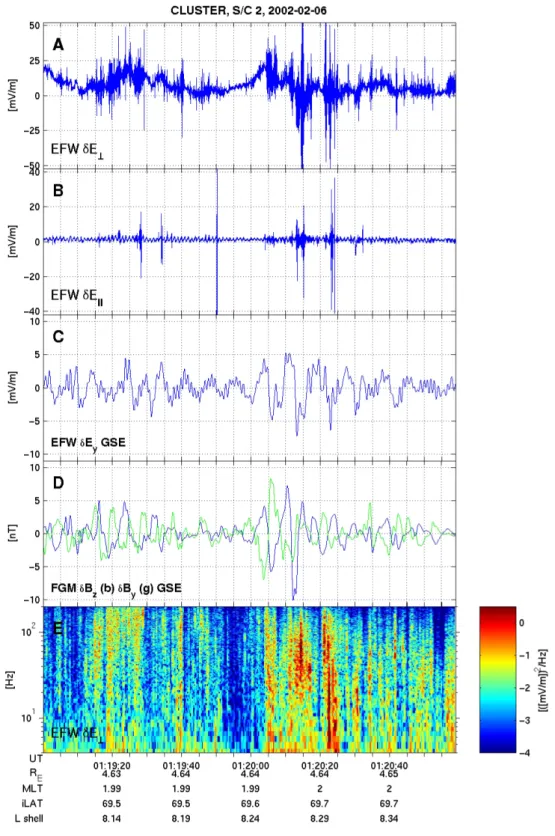
instru-ment. Assuming that H+ is the dominating ion species, this gives an ion plasma and lower hybrid frequency of 420 and 280 Hz, respectively, and an Alfv´en speed of about 5·106m/s. The time period in Fig. 1 has been selected since it includes broad-band waves and since the angle between the ambient magnetic field and the spin-plane is always below 3◦. The parallel electric field component can then be estimated by assuming that the observed, nearly field-aligned component is due to a parallel wave field. (We have tested the alternative hypothesis that the observed, nearly parallel electric field is due to a large wave field that is perpendicular to both the am-bient magnetic field and to the observed perpendicular wave component. This hypothesis essentially always gives such an assumed perpendicular field at least ten times larger than the observed perpendicular wave component, i.e. the error of the estimated parallel electric field is likely to be less than 10%.) Panels (A) and (B) of Fig. 1 show the time series of the perpendicular (δE⊥) and parallel (δE||) electric fields,
re-spectively. The time series are high-pass filtered at 0.1 Hz. Most of the time only the perpendicular field has high ampli-tude, but the parallel component shows some high-amplitude
bursts. The δE|| oscillations at about 0.25 Hz are due to the
satellite spin. The most intense parallel electric field burst has a peak-to-peak amplitude of more than 100 mV/m (see also Fig. 5). The wave spectrogram of the perpendicular electric field, created using a standard FFT, is displayed in panel (E) to show the broad-band character of the emissions. This example of broad-band emissions is typical in the sense that the perpendicular electric field component often domi-nates, but occasionally the parallel component may be com-parable or larger.
The broad-band emissions occur in small regions, lasting up to 2–3 s each, as can be seen in panel (E) of Fig. 1. It is interesting to compare the occurrence of these small regions with the wave activity at low frequencies. Panel (C) displays the observed perpendicular electric field component (essen-tially in the GSE y-direction since the geomagnetic field is almost in the x-direction). The displayed electric field is de-trended and band-pass filtered between 0.1 and 1 Hz to clearly show the fluctuations at lower frequencies. At times, for example, between 01:20:00 UT and 01:20:20 UT, there is a large enhancement of the electric field fluctuations at frequencies around 0.1–0.4 Hz. For comparison, the y- and z-components of the FGM magnetic field (de-trended and band-pass filtered between 0.1 and 1 Hz) are displayed in panel (D). It is clear that the y-component of the electric field is related to the z-component of the fluctuating magnetic field, especially when the field amplitudes are high. The ra-tio E/B is about 106m/s, slightly lower than the estimated Alfv´en speed. This is consistent with wave fields observed in a region of mixed down- and upgoing (reflected) Alfv´en waves (e.g. Aikio et al., 1996), as discussed later. The low-frequency fluctuations have periods of about 4–6 s. A simi-lar periodicity can be seen in panel (E), showing the power spectral density of the perpendicular electric field. Broad-band emissions reaching above 100 Hz are found, usually in the same regions as low-frequency waves in panel (D). There is not a one-to-one correlation between the low-frequency wave peaks and the broad-band waves. However, the sim-ilar periodicity of the low-frequency electromagnetic waves below one Hz and of the broad-band emissions reaching fre-quencies above 100 Hz, suggests that the waves at different frequencies are related.
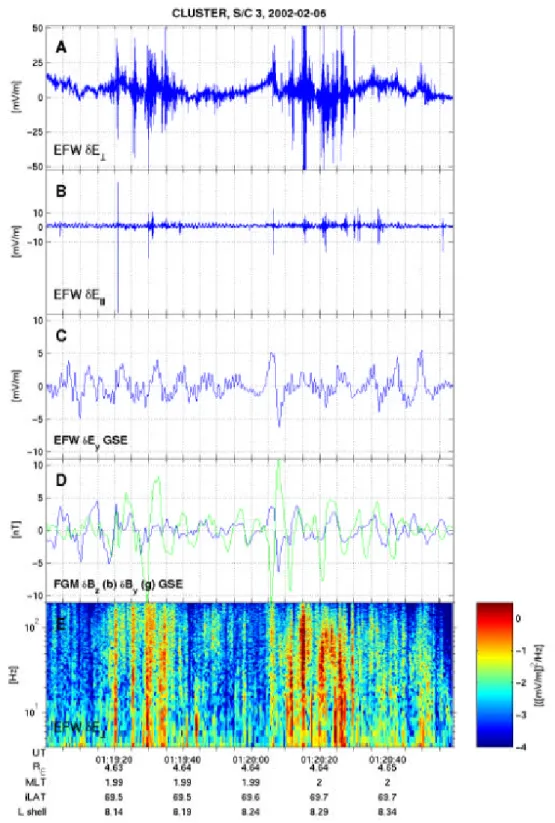
Figure 2 displays the same 2-min period as Fig. 1, but for satellite 3. The perpendicular electric field in panel (A), dom-inates the event, but some bursts of parallel electric fields can be found in panel (B) (note the somewhat lower parallel electric field amplitude as compared to spacecraft 2). Here it is even clearer than in Fig. 1 that the band-pass filtered y-component of the electric field (panel C) is related to the z-component of the magnetic fluctuations (D), again indicating an Alfv´en wave. Overall, the observations on each individual satellite are similar.
Comparing satellite 2 and 3, we investigate if both space-craft observe the same features. Comparing panel (E) in Figs. 1 and 2, we find regions of quasi-periodic broad-band emissions, centred around 01:19:30 and 01:20:25 UT, re-spectively. These regions are observed during about 20–25 s
M. Backrud et al.: Broad-band waves above the auroral acceleration region 4205
Fig. 1. Data from Cluster spacecraft 2 obtained during a crossing of the Northern Hemisphere auroral oval: electric field (0.1–180 Hz)
perpendicular (panel A) and parallel (B) to the geomagnetic field; perpendicular electric field (0.1–1 Hz) approximately in the GSE y-direction (C); magnetic field (0.1–1 Hz) in GSE y- (green) and z-y-directions (blue) (D); spectra of the perpendicular electric field (E). Several bursts of broad-band waves are observed, often but not always with a dominating perpendicular electric field, and often occurring in the same regions as low frequency emissions.
4206 M. Backrud et al.: Broad-band waves above the auroral acceleration region
15
Figure 2
Fig. 2. Similar to Fig. 1, but for Cluster spacecraft 3.
each, and will be referred to as “larger regions”. The sec-ond of the larger regions has the clearest onset, around 01:20:05 UT (e.g. panel A), but with satellite 2 observing the broad-band waves about two seconds earlier than satel-lite 3. This is consistent with the independently estimated E×B drift of about 20–50 km/s (the satellite velocities are
about 4 km/s). Thus, the larger regions are likely to be spa-tial regions, drifting from one spacecraft to the other.
The larger regions (lasting about 25 s) include smaller re-gions filled with broad-band emissions, lasting from a frac-tion of a second up to 2–3 s. Details of some smaller re-gions are presented in Figs. 3 to 6. Also within these smaller
M. Backrud et al.: Broad-band waves above the auroral acceleration region 4207
16
Figure 3
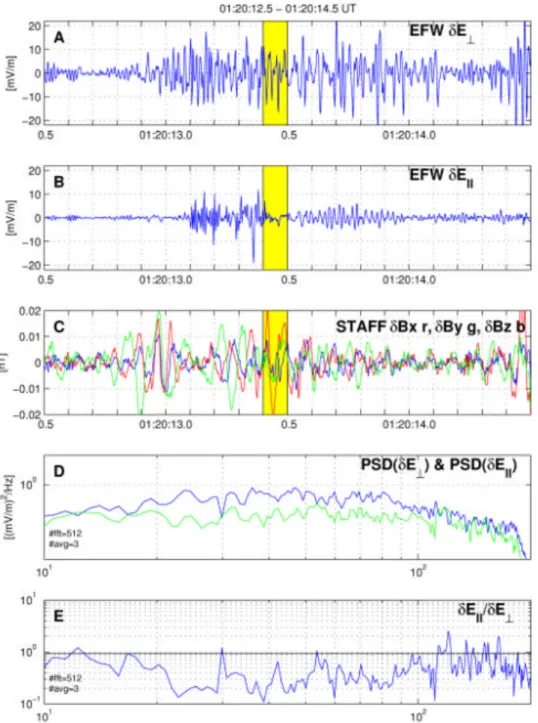
Fig. 3. Data from Cluster spacecraft 2 during part of the interval in Fig. 1: electric field (10–180 Hz) perpendicular (panel A) and parallel (B)
to the geomagnetic field; magnetic field (10–180 Hz) in the GSE x, y and z-directions (red, green and blue, respectively) (C), power spectrum of the perpendicular and parallel electric field (D), and the ratio of the parallel and perpendicular electric field (E). The perpendicular component often dominates, which is typical. The interval indicated in yellow is studied in detail in Fig. 7.
regions the emissions can be described as short bursts (lasting around 0.1–1 s.) with different characteristics, for example, different frequency and different δE||/δE⊥.
Figure 3 is a 2-s snapshot from Fig. 1 and shows examples of the most common bursts where δE|| is smaller than δE⊥
but still a significant fraction thereof. Panels (A) and (B) show δE⊥and δE||, while panel (C) shows STAFF magnetic
wave data. All three STAFF field components are band-pass filtered between 10 and 180 Hz. A visual inspection of pan-els (A), and (B) shows that δE⊥ usually is larger than δE||
4208 M. Backrud et al.: Broad-band waves above the auroral acceleration region but also reveals that the two components may have the
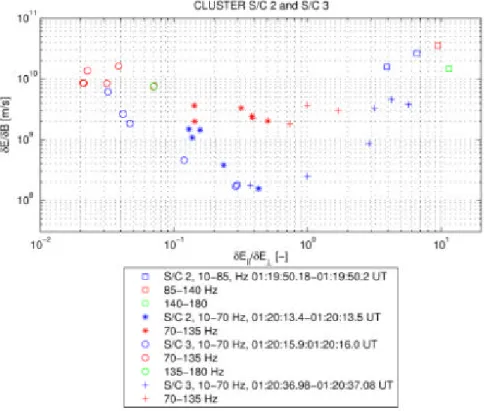
high-est amplitude at somewhat different frequencies. An even more detailed investigation of a part of Fig. 3, including a study of different frequencies, is given in Fig. 7, where an analysis of a 0.1-s snapshot of Fig. 3 (asterisks) is included (01:20:13.4–13.5 UT, highlighted in yellow). For the interval of interest, the spectral densities of both the observed electric field components, and the total magnetic field B (panels A–C of Fig. 3) are calculated with a frequency resolution of about 10 Hz. To exclude noise and low amplitude emissions, only frequency bins with both δE⊥and δE|| larger than 1 mV/m,
and (B) above the noise level of the instrument (Cornilleau-Wehrlin et al., 1997, private communication) are investigated further. For each remaining 10-Hz frequency bin in the range 10–180 Hz, the ratio of the total electric field E and B is plot-ted vs. δE||/δE⊥in Fig. 7. The symbols from this 0.1-s
snap-shot have different colours, representing different frequency intervals. It is clear that E/B is above the speed of light for most data points, and that the waves in this sense are elec-trostatic. For electrostatic waves the k-vector is essentially parallel to E. Hence, Fig. 7 can be interpreted as E/B, as a function of the direction of k, from nearly perpendicular to the geomagnetic field, to nearly parallel.
To identify the emissions in the 0.1-s snapshot of Fig. 3 we note that k||/k⊥is in the range 0.1–0.5. This is typical for
Electrostatic Ion Cyclotron (EIC) waves. Such waves have previously been identified as a part of broad-band emissions using sounding rocket data (Bonnell, 1996). The theoretical description of these waves clearly shows a banded structure related to multiples of the ion gyrofrequency. However, the large frequency bins used here, because of the short duration of the wave bursts, together with Doppler broadening as dis-cussed later, would probably mask any harmonic structure in the emissions. We conclude that the observed emissions are consistent with EIC waves.
Again, considering the whole time interval in Fig. 3, pan-els (D) and (E) show average spectra of δE⊥ and δE||, and
the ratio of the two components, respectively. While the de-tails of the wave characteristics may vary rapidly during the plotted 2 s in Fig. 3, wave-particle interaction depends sig-nificantly on the average fields, since the particles typically spend at least seconds (electrons) to minutes (ions) on fields lines with similar wave properties. It is clear that on aver-age δE⊥ dominates at most frequencies, which is the most
common situation.
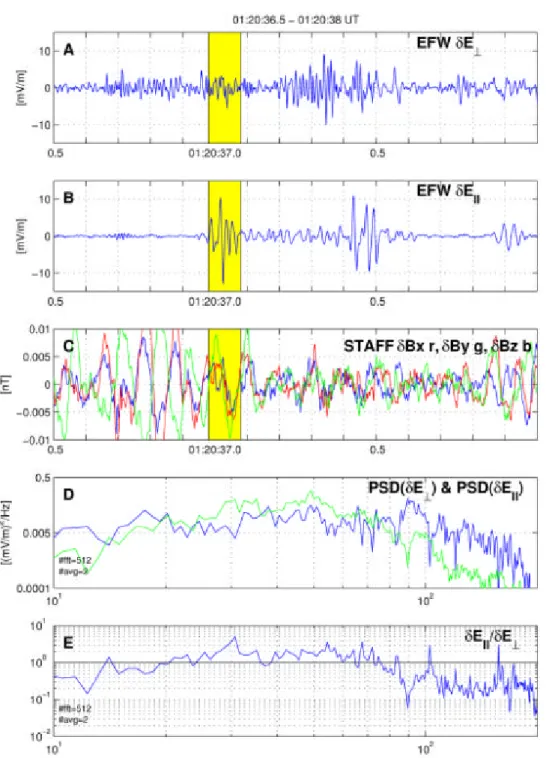
Figure 4 is a 1.5-s snapshot from satellite 3 (Fig. 2), with panels in the same format as Fig. 3. Here fluctuations in δE⊥
are detected during most of the interval, together with mag-netic fluctuations just above the noise-level of the search-coil instrument (panels A and C). Two bursts of large δE||,
last-ing about 0.1 s each, are also observed (panel B). One of these bursts (01:20:36.98–37.08 UT, highlighted in yellow) is analysed in detail in Fig. 7 (crosses). With δE||/δE⊥
ra-tios between ∼0.4 and 6, emissions with low rara-tios might be classified as EIC waves, while waves with a larger ratio are likely to be ion acoustic waves which have been previously identified as parts of broad-band emissions in Freja satellite
data (Wahlund et al., 1998), and in EISCAT incoherent scat-ter spectra (Rietveld et al., 1991; Fosscat-ter et al., 1988). Con-sidering electric field spectra averaged over the whole time interval in Fig. 4, panels (D) and (E), we find that δE||
domi-nates between 20 and 75 Hz, even though most of the parallel electric field occurs in two short bursts. In summary, we find short emissions that are consistent with ion acoustic waves.
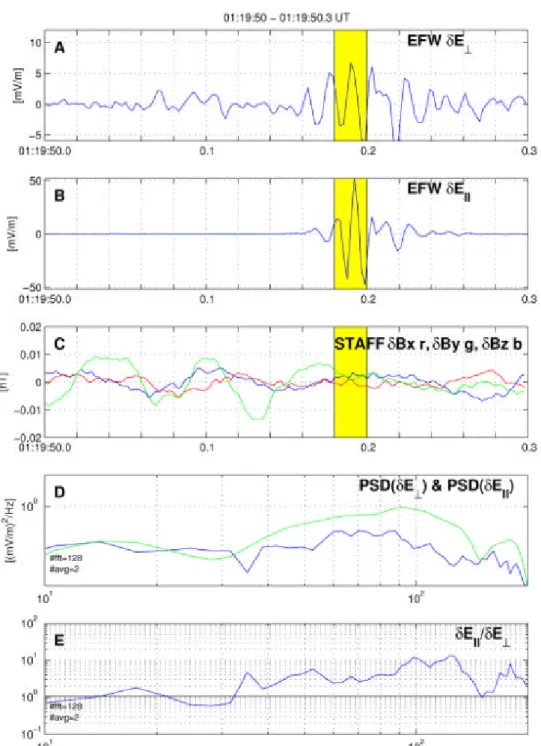
Figure 5 is a 0.3-s snapshot from satellite 2 (Fig. 1), with panels in the same format as Fig. 3. This short interval has been selected to show the largest δE|| amplitude wave-burst
observed during this event, about 100 mV/m peak-to-peak (panel B). The 0.02 s burst (01:19:50.18–01:19:50.20 UT, highlighted in yellow) is further analysed in Fig. 7 (squares). Since the selected time period is short, the frequency resolu-tion is 45 Hz. The ratio δE||/δE⊥is between 4 and 10
(pan-els D and E). As for Fig. 4, this wave burst is consistent with an ion acoustic emission.
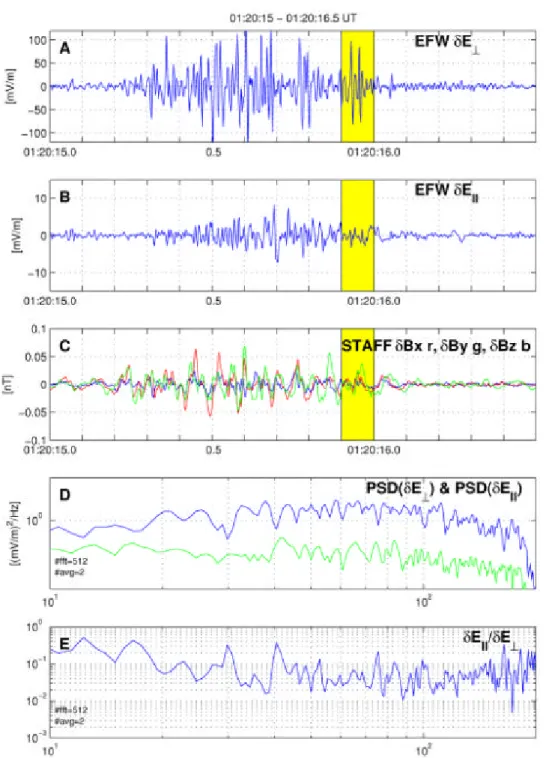
Figure 6 shows a 1.5-s snapshot from satellite 3 (Fig. 2), with panels in the same format as Fig. 3. This interval has been selected to show a region of large δE⊥, up to 250 mV/m
peak-to-peak (panel A). One part of the interval, 0.1 s of data (01:20:15.9–01:20:16.0 UT, highlighted in yellow) is anal-ysed in Fig. 7 (circles), with a frequency resolution of 10 Hz. With δE||/δE⊥ratios between 0.02 and 0.3 (panels D and E),
possibly the large ratios may correspond to EIC waves. In principle, in plasma where the electron temperature is sig-nificantly smaller than the ion temperature, some emission corresponding to small ratios could be so-called slow ion-acoustic waves (Seyler et al., 1996). In our event, as dis-cussed in the theory section, it is more likely that the emis-sions with a small δE||/δE⊥ratio correspond to ion Bernstein
waves.
As described above, four short (∼0.02–1.0 s) broad-band wave-bursts are analysed in Fig. 7. However, within any 2-min event, the δE||/δE⊥ratio can vary about three orders of
magnitude, from 0.02 to 10. For these electrostatic emis-sions, the interpretation is that the k||/k⊥ratio varies in the
same way.
Also, the E/B ratio varies in a systematic way as a func-tion of the direcfunc-tion of the k-vector, as is further analysed in Sect. 3. Since Fig. 7 only includes four selected wave-bursts, we have also studied all data from satellites 2 and 3 during the 2-min event in Fig. 1 and 2 in the same way (i.e. divided the interval into 0.1-s sub-intervals and analysed all 10-Hz bins between 10 and 180 Hz which have high enough field amplitudes). The result in Fig. 8 is similar to Fig. 7, but as expected, there are more data points at small δE||/δE⊥, i.e.
at more perpendicular k-vectors. The absence of observed δE/δB ratios above a few times 1010m/s is due to instrumen-tal limitations (for typical electric fields, the magnetic field is approaching the instrument noise level). Thus, both Figs. 7 and 8 show that a large range of k-directions can occur dur-ing one broad-band wave event, that more perpendicular k-vectors are more common, and that the theoretical interpre-tation should include more than one wave mode.
Concerning multi-spacecraft observations, we have al-ready concluded that the two large 20–25-s regions during
M. Backrud et al.: Broad-band waves above the auroral acceleration region 4209
17
Figure 4
Fig. 4. Data from Cluster spacecraft 3 during part of the interval in Fig. 2; the panels are similar to Fig. 3. Wave bursts with large parallel
electric fields are observed. The interval indicated in yellow is studied in detail in Fig. 7.
this event (centred around 01:19:30 and 01:20:25 UT, Figs. 1 and 2) are mainly spatial, are E×B-drifting, and first reach satellite 2 and then satellite 3. The larger regions include smaller regions filled with broad-band emissions, lasting from a fraction of 1 s up to 2–3 s. The number of such smaller regions is about the same on both spacecraft, but the small regions are not identical. During the period 01:20:05–
01:20:45 UT there are 5–7 intense broad-band emissions on both satellite 2 and 3, the exact number depending on the se-lection criteria used. However, the small regions are not close to being identical, not even when allowing for a realistic ExB drift. Considering individual wave bursts (see, Figs. 3–6) it again becomes clear that the fields observed by two individ-ual satellites are different. Unique features, such as the large
4210 M. Backrud et al.: Broad-band waves above the auroral acceleration region
18
Figure 5
Fig. 5. Data from Cluster spacecraft 2 during part of the interval in Fig. 1; the panels are similar to Fig. 3. A wave burst with large parallel
electric fields is observed. The interval indicated in yellow is studied in detail in Fig. 7.
δE|| in Figs. 4 and 5, are easy to identify and are seen only
on one spacecraft. This puts strict limits on the small regions (2–3 s) with broad-band waves. Since the satellite separation perpendicular to the geomagnetic field and perpendicular to the satellite velocity is about 45 km, the perpendicular scale length of the wave bursts in these small regions could be less than this separation. Also, the duration of the bursts could
be less than 2–3 s. The scale length systematically being less than several times the ion gyroradius (about 1 km for a few eV H+)cannot be excluded. However, the individual time series in Figs. 1–6, as well as the comparison of two satellites passing nearly the same region 2–3 s apart, strongly indicate that wave growth and damping on a time scale of 2–3 s is important for these broad-band waves.
M. Backrud et al.: Broad-band waves above the auroral acceleration region 4211
19
Figure 6
Fig. 6. Data from Cluster spacecraft 3 during part of the interval in Fig. 2; the panels are similar to Fig. 3. Here the perpendicular electric
field is clearly dominating. The interval indicated in yellow is studied in detail in Fig. 7.
3 Theory
The observations in Figs. 7 and 8 reveal a clear dependence of δE/δB on δE||/δE⊥and thus on k||/k⊥. It is of interest to
investigate if this behaviour is consistent with a simple theo-retical model. As a first approximation, we assume that the emissions can be described by linear waves in homogeneous
plasma. To model the expected wave polarization we solve the wave dispersion relation using the numerical package WHAMP (R¨onnmark, 1982). As input to WHAMP we need a plasma model. Particle data are not available for this event, and for several other auroral events during the first part of the mission, since the particle detectors were often switched off in this region due to possible damage in the neighbouring
4212 M. Backrud et al.: Broad-band waves above the auroral acceleration region
20
Figure 7
Fig. 7. Detailed analysis of the time intervals indicated in yellow in Figs. 3–6, see the text for details. Different symbols correspond to
different intervals, while different colours correspond to different frequency ranges.
radiation belts. However, the wave properties are changing within a fraction of a second and the available particle detec-tors are not normally operated to obtain complete distribution functions on this time scale anyway. Rather, we use observed model parameters when available, and for others we investi-gate a range of reasonable plasma parameters to see if waves within our assumptions can explain our observations.
The magnetic field during this event is rather constant at 490 nT (f+H=7.2 Hz). The plasma frequency estimated from Whisper electric field observations indicates a density of 4 cm−3. At this altitude it is reasonable to assume the ions to be H+. Further assuming the particle distributions to be Maxwellians, we need to estimate the temperatures. The lowest reasonable temperature is around 1 eV, indicat-ing a majority of particles to be of ionospheric origin. How-ever, it is not the absolute temperature, but rather the ratio of the electron and ion temperatures, that mainly determines the wave dispersion here. Since our observations sometimes show that δE||/δE⊥>1, our plasma model must support such
emissions. A major candidate for emissions with a large δE||
are ion acoustic (IA) waves. However, in a homogeneous plasma, these waves require that the ratio of the electron and ion temperatures Te/Ti is significantly above unity, which is
not typical of large regions on auroral field lines but might be applicable for small regions. We choose to investigate models with Te/Ti>1, since IA emissions are the most likely
waves to explain some of our emissions, and since these emissions occur in bursts lasting only a fraction of a second.
In summary, our models have a geomagnetic field of 490 nT, a density of 4 cm−3, and H+and electron distributions with T+H=1 eV and Te/T+H >1.
To investigate a plasma with a large temperature ratio, we choose Te/T+H=100. We emphasise again that this is not a
model of the overall auroral region, but may illustrate what happens in small regions. We then choose a frequency be-tween 1.5 and 13.5 f+H (about 10 or 100 Hz) and search for wave modes. In practise, with WHAMP, we prescribe a di-rection of the k-vector and search for a wave that is not heav-ily damped, at the given frequency. Since the waves are elec-trostatic (δE/δB>c) we exclude the whistler/magnetosonic mode at small wave vectors. For the case of parallel prop-agation (k⊥=0), IA waves are the only available mode (see
the dispersion surface in Fig. 1a of Andr´e, 1985). Other the-oretically possible waves can then be found by changing the direction of k. The polarization, including δE/δB, can the-oretically be determined for each direction. By gradually changing the direction of k from parallel to perpendicular, we can find the polarization for ion acoustic, EIC and ion Bern-stein waves. To find solutions for the k||/k⊥ ratio between
∼0.05–0.1, we allowed the frequency to gradually increase with approximately 2 Hz and then gradually decrease to the original frequency when stepping in the perpendicular direc-tion in k. The ion acoustic, EIC and ion Bernstein waves have k||/k⊥ approximately larger than unity, 0.1–1, and smaller
than 0.1, respectively. There is no theoretical sharp limit between the modes assigned different names. Rather, they
M. Backrud et al.: Broad-band waves above the auroral acceleration region 4213
21 Figure 8
Fig. 8. An analysis of all 0.1-s sub-intervals from the 2-min of Cluster spacecraft 2 data in Fig. 1 is shown in the upper panel, see the text
for details. A similar analysis for the two minutes of spacecraft 3 data in Fig. 2 is shown in the lower panel. Different colours correspond to different frequency ranges. Also shown are theoretically obtained δE/δB ratios for different frequencies, see the text for details (1.5 f+His about 10 Hz). The observed emissions are consistent with a mixture of linear wave modes.
can all be described by the same dispersion surface (Andr´e, 1985). Since the waves we consider are electrostatic, k||/k⊥
is approximately equal to δE||/δE⊥.
The theoretically obtained δE/δB ratio as a function of wave vector direction, for four selected frequencies between 1.5 and 13.5 f+H, is in Fig. 8 shown together with two minutes of observations from Cluster satellites 2 and 3 (Figs. 1 and 2). Considering low frequency observations (green points) there is an intermediate interval of δE||/δE⊥, about 0.3–1,
with minimum δE/δB. The “V” shape of the lower boundary of the observed δE/δB ratio agrees well with the
theoreti-cally obtained ratio for the lowest frequency (1.5 f+H, about 10 Hz). The examples of theoretically obtained δE/δB ratios for higher frequencies indicate that all δE/δB ratios above the lower limit can be expected. We again note that the absence of observed δE/δB ratios above a few times 1010m/s is due to instrumental limitations. Overall, Fig. 8 shows that the ob-served emissions are consistent with a mixture of linear wave modes.
Doppler broadening due to plasma motion relative to the satellite can change the observed wave frequency and hence be important for our theoretical interpretation. For
4214 M. Backrud et al.: Broad-band waves above the auroral acceleration region
22
Figure 9
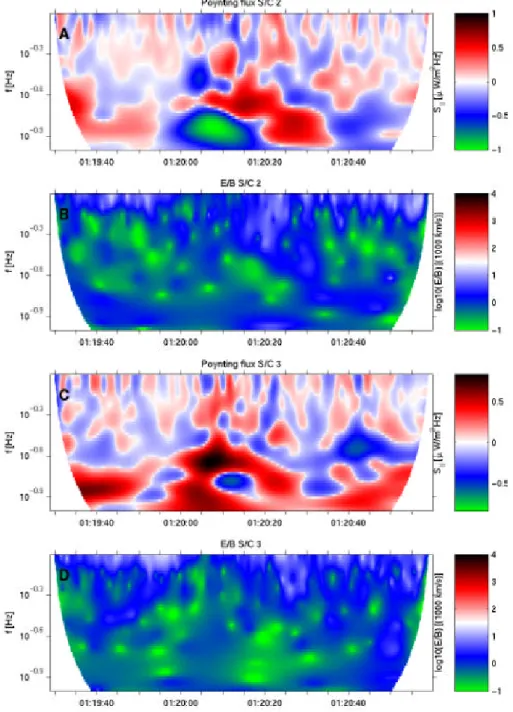
Fig. 9. Morelet wavelet analyses of the Poynting flux from Cluster satellites 2 and 3 (panels 1 and 3), where red (green) indicates downward
(upward) flux, and the corresponding ratio of the electric and magnetic fields (panels 2 and 4). These results are obtained from data in panels (C) and (D) in Figs. 1 and 2. The observations indicate a mixture of downgoing and upgoing Alfv´en waves.
k-vectors perpendicular to the geomagnetic field (ion Bern-stein waves), the wavelength can be somewhat smaller than the ion gyroradius (about 1 km for a few eV H+). For par-allel k, and frequencies close to the ion plasma frequency (420 Hz), the wavelength for IA waves can be a few times the Debye length of about 30 m (100 eV) and at 100 Hz be of the order of 100 m. The major observed plasma motion is 20–50 km/s in the perpendicular direction. Using 1 km as the minimum wavelength, the maximum Doppler broadening becomes 20–50 Hz, which is the same order as the
frequen-cies we investigate. Since the direction of the k-vectors is likely to be independent of the perpendicular drift, our com-parisons of theory and observations should show significant spread but should give good agreement in a statistical sense.
4 Alfv´en waves
As noted in the discussion concerning Figs. 1 and 2, there are Alfv´en waves below 1 Hz occurring at the same time as the broad-band emissions. Figure 9 shows the
M. Backrud et al.: Broad-band waves above the auroral acceleration region 4215 geomagnetic field-aligned Poynting flux of these waves, 0.1–
1 Hz, for satellites 2 and 3 (panels A and C) using a Mor-let waveMor-let. Intense downward and upward Poynting flux, up to 1 µW/m2, is indicated in red and green, respectively. For spacecraft 2, the most intense broad-band emissions oc-cur at 01:20:04–01:20:32 UT (Fig. 1). During the first half of this interval, up to about 01:20:15 UT, there is much up-ward Poynting flux, while later all Poynting flux is downup-ward (Fig. 9, panel A). The upward Poynting flux can be inter-preted as a reflected wave. The upward flux is not observed on satellite 3, also indicating significant differences for low-frequency waves at a perpendicular separation of 45 km. The regions of the most intense broad-band waves (01:20:04– 01:20:32 UT, satellite 2, Fig. 1, 01:20:06–01:20:28 UT, satel-lite 3, Fig. 2) agree well with the regions of most intense Poynting flux at frequencies between 0.1–0.6 Hz. We note that an energy flux of 1 µW/m2corresponds to an outflow en-ergy of H+ions of about 30 eV, indicating that the observed
Poynting flux can be important for ion outflow if the field en-ergy can be dissipated to particles. Considering the polariza-tion, Fig. 9 shows the δE/δB ratio, 0.1–1 Hz, for satellites 2 and 3 (panels B and D). The ratio is of the order of 106m/s and sometimes smaller, which is slightly below the Alfv´en speed. This can be due to an underestimation of the electric field, since only one perpendicular component is available, and can also be due to a mixture of downgoing and reflected upgoing waves (e.g. Aikio et al., 1996). Again, our observa-tions are consistent with the simultaneous occurrence of low-frequency Alfv´en waves, and broad-band waves at higher fre-quencies.
5 Discussion and conclusions
We study broad-band ELF emissions (a few to 180 Hz) above the auroral acceleration region at geocentric distances of about 4.5 RE. One event is presented in detail. This event
is consistent with observations during eight other events (see Table 1). One new result is that all events include some bursts of broad-band ELF waves, with a substantial component of the electric field parallel to the geomagnetic field.
We find that broad-band emissions above the proton gy-rofrequency (about 7 Hz) include waves with a wide range of δE||/δE⊥ ratios. The corresponding δE/δB ratios are above
the speed of light, in this sense indicating electrostatic waves. Waves with an δE||/δE⊥ratio above unity can have an δE||
up to 10–100 mV/m (peak-to-peak). These emissions exist in bursts of only a fraction of a second, and are interpreted as ion acoustic (IA) waves. STAFF electric field data (not shown) indicate that these emissions reach up to around the H+ plasma frequency (420 Hz), again consistent with ion acoustic waves. Such waves have, to our knowledge, not previously been reported from the auroral region at altitudes above 1700 km.
Our observations of δE||/δE⊥ and hence of the direction
of the k-vector for electrostatic waves, show that all di-rections from nearly parallel to nearly perpendicular occurs
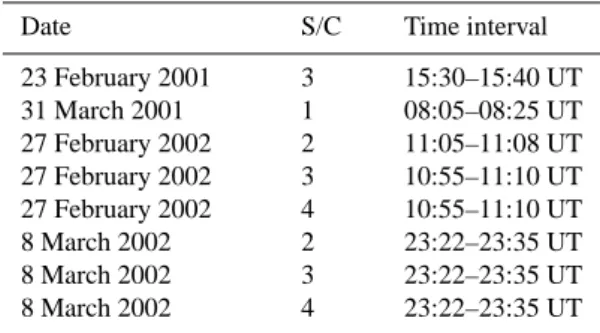
Table 1. Events on auroral field lines at altitudes of about 4.5 RE
geocentric distance with broad-band emissions similar to those we study in detail. During all events the electric field parallel to the ge-omagnetic field can be reliably estimated. Note that the duration of several events overlap since they are observed by different Cluster satellites. Almost all events include bursts where δE||is larger than δE⊥, with the majority of the intervals having δE⊥larger than δE||.
Date S/C Time interval
23 February 2001 3 15:30–15:40 UT 31 March 2001 1 08:05–08:25 UT 27 February 2002 2 11:05–11:08 UT 27 February 2002 3 10:55–11:10 UT 27 February 2002 4 10:55–11:10 UT 8 March 2002 2 23:22–23:35 UT 8 March 2002 3 23:22–23:35 UT 8 March 2002 4 23:22–23:35 UT
during one broad-band wave event. By comparing the ob-served polarization (δE/δB ratio) with theory, we find that the broad-band emissions are reasonably well described by linear waves in a homogenous plasma. The most common waves have k||/k⊥=0.1 to 0.5, and are called EIC waves.
Emissions with smaller ratios are ion Bernstein waves, emis-sions with a larger ratio are labelled IA waves. In a homo-geneous plasma, the existence of these latter waves requires that the electron temperature is a few times larger than the ion temperature. This may explain why emissions with k||>k⊥
occur only in short bursts, and why waves with k||<k⊥may
exist in longer bursts and are more common. We note that in an inhomogeneous plasma, including, for example, a vary-ing particle drift along the geomagnetic field, IA waves may also exist for other temperature ratios (Ganguli et al., 2002 and Gavrishchaka et al., 1999). Different directions of the k-vector correspond to different wave modes, assigned dif-ferent names, but there is no sharp theoretical limit between the different modes. We find that the broad-band wave bursts which we investigate are reasonably well described by lin-ear waves in homogeneous plasma, theoretically described by the same dispersion surface.
The broad-band waves are found in large regions, observed during at least several seconds. These regions include several smaller regions (2–3 s) filled with broad-band waves. The larger regions also include Alfv´en waves with frequencies below the ion gyrofrequency. These Alfv´en waves have a substantial Poynting flux, and can perhaps generate broad-band emissions, as suggested by Wahlund et al. (1994) based on lower altitude observations by the Freja spacecraft.
In conclusion, broad-band ELF waves above the ion gy-rofrequency observed on auroral field lines at geocentric dis-tances of a few RE, are consistent with various wave modes
theoretically described by the same dispersion surface. These emissions are closely associated with low-frequency Alfv´en waves, indicating a possible generation mechanism.
4216 M. Backrud et al.: Broad-band waves above the auroral acceleration region Acknowledgements. CIS ion data was provided by B. Lavraud.
Thanks to A. Fazakerley for useful discussions. The Swedish National Space Board (SNSB) supports the EFW instruments on board CLUSTER. The Advanced Instrumentation & Measurements (AIM) graduate school supports M. Backrud.
Topical Editor T. Pulkkinen thanks J. S. Pickett and another referee for their help in evaluating this paper.
References
Aikio, A. T., Blomberg, L. G., Marklund, G. T., et al.: On the origin of the high-altitude electric field fluctuations in the auroral zone, J. Geophys. Res., 101, 27 157–27 170, 1996.
Andr´e, M.: Dispersion surfaces, Plasma Phys., 33, 1–19, 1985. Boehm, M. H., Clemmons, J., Wahlund, J.-E., et al.: Observation
of an upward-directed electron beam with the perpendicular tem-perature of the cold ionosphere, Geophys. Res. Lett., 22, 2103– 2106, 1995.
Balogh, A., Dunlop, M. W., Cowley, S. W. H., et al.: The Cluster Magnetic Field Investigation, Space Sci. Rev., 79, 65–91, 1997. Bonnell, J., Kintner, P. M., Wahlund, J.-E., et al.:
Interferomet-ric determination of broadband ELF wave phase velocity within a region of transverse auroral ion acceleration, Geophys. Res. Lett., 23, 3297–3300, 1996.
Cattell, C., Wygant, J., Dombeck, J., et al.: Observations of large amplitude parallel electric field wave packets at the plasma sheet boundary, Geophys. Res. Lett., 25, 857–860, 1998.
Chust, T., Louarn, P., Volwerk, M., et al.: Electric field with a large parallel component observed by the Freja spacecraft: Artifacts or real signals?, J. Geophys. Res., 103, 215–224, 1998.
Cornilleau-Wehrlin, N., Chauveau, P., Louis, S., et al.: The Clus-ter Spatial-Temporal Analysis on Field Fluctations Experiment, Space Sci. Rev., 79, 107–136, 1997.
Escoubet, C. P., Schmidt, R., and Goldstein, M. L.: Cluster – Sci-ence and mission overview, Space Sci. Rev., 79, 11–32, 1997. Foster, J. C., del Pozo, C., Groves, K., et al.: Radar observations of
the onset of current driven instabilities in the topside ionosphere, Geophys. Res. Lett., 15, 160–163, 1988.
Ganguli, G., Slinker, S., Gavrishchaka, V., et al.: Low frequency oscillations in a plasma with spatially variable field-aligned flow, Plasma Phys., 9, 2321–2340, 2002.
Gavrishchaka, V., Ganguli, S. B, and Ganguli, G. I.: Electrostatic oscillations due to filamentary structures in the magnetic-field-aligned flow, J. Geophys. Res., 104, 12 683–12 693, 1999.
Gurnett, D. A. and Frank, L. A.: A region of intense plasma wave turbulence on auroral field lines, J. Geophys. Res., 82, 1031, 1977.
Gustafsson, G., Bostr¨om, R., Holback, B., et al.: The electric field and wave experiment for the Cluster mission, Space Sci. Rev., 79, 137–156, 1997.
Hamrin, M., Nordqvist, P., Andr´e, M., et al.: A statistical study of wave properties and electron density at 1700 km in the auroral region, J. Geophys. Res., 107 (A8), 1205, doi:10.1029/2001JA900144, 2002.
Kintner, P. M., Franz, J., Schuck, P., et al.: Interferometric co-herency determination of wavelength or what are broadband ELF waves?, J. Geophys. Res., 105, 21 237–21 250, 2000.
Kintner, P. M., Bonnell, J., Arnoldy, R., et al.: SCIFER-Transverse ion acceleration and plasma waves, Geophys. Res. Lett., 23, 1873–1876, 1996.
Knudsen, D. J., Clemmons, J. H., and Wahlund, J.-E.: Correla-tion between core ion energizaCorrela-tion, suprathermal electron bursts, and broadband ELF plasma waves, J. Geophys. Res., 103, 4171– 4186, 1998.
Lysak, R. L. and W. Lotko: On the kinetic dispersion relation for shear Alfv´en waves, J. Geophys. Res., 101, 5085–5094, 1996. Rietveld, M. T., Collis, P. N., and St-Maurice, J.-P.: Naturally
en-hanced ionacoustic waves in the auroral ionosphere observed with EISCAT 933 MHz radar, J. Geophys. Res., 96, 19 291, 1991.
R¨onnmark, K.: WHAMP – Waves in Homogeneous Anisotropic, Multicomponent Plasmas, KGI Report 179, Kiruna Geophysical Institute, 1982.
Seyler, C. E. and Wahlund, J.-E.: Theory of nearly perpendicular electrostatic plasma waves and comparison to Freja satellite ob-servations, J. Geophys. Res., 101, 21 795–21 813, 1996. Wahlund, J.-E., Yilamaz, A., Backrud, M., et al.: Observations of
auroral broadband emissions by CLUSTER, Geophys. Res. Lett., 30, 1563, doi:10.1029/2002GL016335, 2003.
Wahlund, J.-E., Eriksson, A. I., Holback, B., et al.: Broadband ELF plasma emission during auroral energization 1. Slow ion acoustic waves, J. Geophys. Res., 103, 4343–4375, 1998.
Wahlund, J.-E., Louarn, P., Chust, T., et al.: On ion acoustic tur-bulence and the nonlinear evolution of kinetic Alfv´en waves in aurora, Geophys. Res. Lett., 21, 1831–1834, 1994.