HAL Id: tel-01126889
https://tel.archives-ouvertes.fr/tel-01126889
Submitted on 6 Mar 2015
HAL is a multi-disciplinary open access
archive for the deposit and dissemination of sci-entific research documents, whether they are pub-lished or not. The documents may come from
L’archive ouverte pluridisciplinaire HAL, est destinée au dépôt et à la diffusion de documents scientifiques de niveau recherche, publiés ou non, émanant des établissements d’enseignement et de
Regulation of YAP by mTOR and autophagy reveals a
therapeutic target of Tuberous Sclerosis Complex
Ning Liang
To cite this version:
Ning Liang. Regulation of YAP by mTOR and autophagy reveals a therapeutic target of Tuberous Sclerosis Complex. Cellular Biology. Université René Descartes - Paris V, 2014. English. �NNT : 2014PA05T055�. �tel-01126889�
UNIVERSITE PARIS DESCARTES
FACULTE DE MEDECINE PARIS DESCARTES
THESE
Pour obtenir le grade de
DOCTEUR DE L’UNIVERSITE PARIS DESCARTES
Spécialité
Biologie cellulaire
Regulation of YAP by mTOR and autophagy reveals
a therapeutic target of Tuberous Sclerosis Complex
Présentée par
Ning LIANG
Directeur de thèse
Dr. Mario PENDE
Soutenue le 29 Septembre 2014
Membres du jury :
Le Dr. Bertrand Knebelmann
Président
Le Dr. Richard Lamb
Rapporteur
Le Dr. Hugo Stocker
Rapporteur
Summary
The Tuberous Sclerosis Complex (TSC) is a genetic disease characterized by growth of hamartomas in different organs including brain, kidney, lung, skin, and heart. These lesions are sources of morbidity and mortality in patients with TSC, as they may cause intractable epilepsy, autism, developmental delay, renal and pulmonary failure. Known causes of TSC are loss of function mutations in TSC1 and TSC2 genes. The majority of TSC lesions contain multiple cell types of the mesenchymal lineage, as in the case of angiomyolipomas, lymphangioleiomyomatosis and angiofibromas. A unique cell type named perivascular epithelioid cell (PEC) is constantly present in mesenchymal TSC lesions, such as angiomyolipomas and lymphangioleiomyomatosis, basing on morphological features and the common expression of melanocytic and myogenic markers. Therefore, these lesions are officially classified, along with other tumors, as PEComas. Their cell of origin and the molecular mechanisms underlying their pathogenesis remain poorly defined.
Here we generated a novel mosaic Tsc1 knockout mouse model which develops renal mesenchymal lesions recapitulating human Perivascular Epithelioid Cell tumor (PEComa) observed in TSC patients. We identified YAP, the transcriptional coactivator of Hippo pathway, was upregulated in both renal lesions of TSC mouse model and human angiomyolipoma samples in a mTOR-dependent manner. Inhibition of YAP with genetic or pharmacological tools greatly attenuates the proliferation and survival of Tsc1 null cells in vivo and in vitro. Futhermore, we found YAP accumulation in TSC1/TSC2 deficient cells is due to impaired degradation of the protein through the autophagosome/lysosome system.
Thus the regulation of YAP by mTOR and autophagy is a novel mechanism of growth control, matching YAP activity with nutrient availability under growth permissive conditions. It may serve as a potential therapeutical target for TSC and other diseases with dysregulated mTOR activity.
Abbreviation
AML Angiomyolipoma
AMP Adenosine monophosphate
Areg Amphiregulin
ATP Adenosine triphosphate
ATG7 Autophagy-related protein 7
BrdU 5-Bromo-2-deoxyuridine
CQ Chloroquine
CTGF Connective tissue growth factor
4E-BP1 Eukaryotic initiation factor 4E binding protein 1
GAP GTPase activating protein
GEF Guanine nucleotide exchange factor
GTP Guanosine triphosphate
GTPase Guanosine triphosphatase
HEK293 Human embryonic kidney cell 293
LAM Lyphmangioleiomyomatosis
Lats1/2 large tumor suppressor, homolog 1/2
MEF Mouse embryonic fibroblast
MST1/2 mammalian Sterile20-like 1/2
mTOR mammalian (mechanistic) target of rapamycin
mTORC1 mammalian (mechanistic) target of rapamycin complex1
mTORC2 mammalian (mechanistic) target of rapamycin complex2
PEComa Perivascular epithelioid cell tumor
PI3K Phosphatidylinositol-3 Kinase
PTEN Phosphatase and tensin homolog on chromosome 10
Raptor Regulatory associated protein of mTOR Rheb Ras homolog enriched in brain
Rictor Rapamycin-insensitive companion of mTOR
rpS6 Ribosomal protein S6
SEGA Subepedymal gaint cell astrocytomas
S6K Ribosomal protein S6 kinase
S6K1 Ribosomal protein S6 kinase 1
S6K2 Ribosomal protein S6 kinase 2
TUNEL Terminal deoxyribonucleotidyl transferase (TDT)-mediated dUTP-
digoxigenin nick end labeling
TSC Tuberous sclerosis complex
TSC1 Tuberous sclerosis complex 1 (hamartine)
TSC2 Tuberous sclerosis complex 2 (tuberine)
TBC1D7 TBC1 domain family, member 7
Vps15 Vacuolar Protein Sorting 15
Contents
Summary ... 2
Abbreviation... 3
Contents ... 5
1 Introduction... 7
1.1 Tuberous Sclerosis Complex ... 7
1.1.1 Clinical features ... 7 1.1.1.1 Brain ... 7 1.1.1.2 Kidney... 7 1.1.1.3 Lung... 9 1.1.1.4 Skin... 9 1.1.1.5 Heart ... 9
1.1.1.6 Perivascular Epthelioid Cell tumors (PEComas) ... 9
1.1.2 Genetics ... 10
1.1.3 Pathophysiology ... 10
1.1.3.1 TSC1 and TSC2, one protein complex ... 10
1.1.3.2 TSC1/TSC2 complex, a tumor suppressor in Insulin signaling pathway ... 11
1.1.3.3 TSC1/TSC2 complex, an inhibitor of mTOR through Rheb... 12
1.1.3.4 TSC1/2-mTORC1 signaling ... 12
1.1.3.5 TSC1 and TSC2 function beyond mTORC1 ... 16
1.1.3.6 TBC1D7, the third partner of TSC1/TSC2 complex ... 16
1.1.4 Animal models of TSC... 17
1.1.4.1 The Eker rat ... 17
1.1.4.2 Tsc1+/- and Tsc2+/- mice ... 17
1.1.4.3 Tissue-specific Tsc1/2 knockout model, brain... 18
1.1.4.4 Tissue-specific Tsc1/2 knockout model, kidney ... 18
1.1.4.5 Tissue-specific Tsc1/2 knockout model, heart ... 19
1.1.4.6 Mouse models for mesenchymal tumors in kidney and lung... 19
1.1.5 Treatment ... 19
1.2 Hippo-YAP signaling ... 20
1.2.1 Hippo signaling network ... 20
1.2.3 Regulation of YAP/TAZ in mammals ... 22
1.2.3.1 Phosphorylation-dependent cytoplasmic sequestration ... 22
1.2.3.2 Phosphorylation-dependent degradation through ubiquitin-proteasome pathway ... 22
1.2.3.3 Phosphorylation-independent regulation... 22
1.2.4 Crosstalk between two master regulators of organ size, mTOR signaling and Hippo-YAP signaling... 23
2 Results... 24
2.1 Generation of mosaic-Tsc1KO mice which develop multisystem lesions showing similarities with human TSC... 24
2.2 Mosaic-Tsc1KO mice develop renal mesenchymal lesions recapitulating PEComas associated with human TSC. ... 26
2.3 YAP is up-regulated by mTOR in renal lesions of mosaic-Tsc1KO mice and human angiomyolipoma. ... 30
2.4 YAP is required for the abnormal proliferation and survival of TSC1/2 null cells in vitro. ... 34
2.5 Inhibition of YAP pharmacologically or genetically attenuates abnormal proliferation and induces apoptosis of Tsc1 null cells in vivo. ... 37
2.6 YAP is accumulated in TSC deficient cells due to blockage of autophagy in a mTOR-dependent manner. ... 41
3 Conclusion and discussion ... 46
3.1 The cell of origin of TSC-associated PEComas ... 46
3.1.1 Pericytes... 46
3.1.2 Smooth muscle cells... 47
3.1.3 Neural crest cells ... 47
3.2 Potential pharmacological strategies against YAP for TSC lesions ... 47
3.2.1 GPCR agonist/antagonist ... 48
3.2.2 Statins ... 48
3.2.3 Peptides inhibiting interaction between YAP and TEAD... 49
3.3 Regulation of YAP degradation by autophagy ... 49
4 Materials and Methods ... 52
1 Introduction
1.1 Tuberous Sclerosis Complex
Tuberous Sclerosis Complex (TSC) is a human genetic disease which is characterized by development of hamartomas in multiple organs including brain, kidney, lung, skin and heart. These benign tumors lead to a combination of symptoms such as seizures, developmental delay, autism, skin abnormality, renal and pulmonary failure. TSC is caused by loss of function mutations in two genes,
TSC1 (9q34) and TSC2 (16p13). The prevalence of TSC is estimated to be 1 in
6,000 individuals (Crino et al., 2006).
1.1.1 Clinical features
1.1.1.1 Brain
TSC patients can be affected by three types of tumors in the brain: cortical tuber, subependymal nodules, subepedymal gaint cell astrocytomas (SEGA). 80% of TSC patients develop cortical tubers, which is a developmental abnormality characterized by neuronal dys-lamination, dysmorphic neurons and enlarged astrocytes in the cortex. Subependymal nodules form along the walls of lateral and third ventricles featured by abnormal gial cells and multinucleated cells. SEGA are composed of proliferative astrocytes and gaint cells which usually arise near foramen of Monro, channels connecting lateral and third ventricles.
1.1.1.2 Kidney
55% to 75% of TSC patients develop renal angiomyolipomas (AML) which are composed of abnormal blood vessels, smooth muscle cells and adipocytes. Their
occurrence are usually bilateral and multiple. Angiomyolipomas may cause spontaneous bleeding and hemorrhages when their size is larger than 3 cm in diameter. Another morbidity associated with angiomyolipomas is the chronic kidney disease and renal failure caused by progressive infiltration of angiomyolipomas in some cases.
Although the classic angiomyolipomas contain three components including abnormal vasculatures, proliferative smooth muscle cells and fat cells, the contribution of each part can be viable from case to case. In some patients, the angiomyolipomas are composed of mainly smooth muscle cells and vasculatures, thus named fat poor angiomyolipomas; while in other cases, adipocytes could be the dominate component. Through genetic studies, similar second-hit mutations were identified in all the three components from the same angiomyolipoma sample indicating they are derived from one progenitor cell (El-Hashemite et al., 2003; Karbowniczek et al., 2003). However, the cell of origin of angiomyolipomas remains elusive.
A distinctive cell type, perivascular epithelioid cell (PEC), is constantly found in angiomyolipomas, because of which angiomyolipomas are classified as PEComas (discussed below). Intriguingly, Perivascular epithelioid cells express both melanocytic (Hmb45 and/or Mart1) and myogenic (aSMA) markers, while its normal tissue counterpart is not yet identified. Since melanocyte is derived from neural crest during vertebrate development, it is postulated that PEComas are originated from neural crest cells (Sarnat and Flores-Sarnat, 2005). Because angiomyolipomas are mesenchymal and the epithelial cells of kidneys are generated from embryonic mesoderm, it is also hypothesized that angiomyolipomas arise from abnormal mesenchymal-epithelial transition during early kidney development or aberrant epithelial-mesenchymal transition occurred in TSC1/2 null renal tubular cells during late kidney developmental stages. These different possibilities still need to be tested to identify the cell of origin of angiomyolipomas.
Epithelial lesions, such as cysts and renal cell carcinomas, are also associated with TSC with relatively low incidences of 20-30% and 2-3% respectively.
1.1.1.3 Lung
Lymphangioleiomyomatosis (LAM) are female-dominant pulmonary tumors associated with TSC which affect 26-39% of female patients. They are composed of proliferative smooth muscle cells which could infiltrate different pulmonary structures, such as airways, alveolar septa and vasculatures. Similar with angiomyolipomas, perivascular epithelioid cells are also identified in lymphangioleiomyomatosis, which express both melanocyitc and myogenic markers. Around 30-60% patients with sporadic LAM were also affected with angiomyolipomas. Interestingly, the same mutated loci were identified both in LAM cells and in angiomyolipomas cells from the same patients indicating they may arise from the same ancestor or LAM may be a result of metastasis of mesenchymal cells from renal angiomyolipomas or vice versa (Carsillo et al., 2000). However, this hypothesis remains to be tested experimentally.
1.1.1.4 Skin
Dermatological symptoms are present in 90% of TSC patients including facial angiofibromas, periungual fibromas and hypomelanic macules. They are among the major diagnostic criteria of TSC and usually cause no problems.
1.1.1.5 Heart
Cardiac rhabdomyomas are associated with 50-70% TSC infants. A few of them may cause significant clinical problems. They usually disappear spontaneously in later adult life of the patients.
1.1.1.6 Perivascular Epthelioid Cell tumors (PEComas)
Most of the tumors associated with TSC are mesenchymal, such as angiomyolipomas, lymphangioleiomyomatosis, angiofibromas and rhabdomyomas. In renal angiomyolipomas and pulmonary lymphangioleiomyomatosis, a unique cell
type, perivascular epithelioid cell (PEC), is constantly present in these tumors, because of which these tumor are classified as PEComas (Martignoni et al., 2008; Pea et al., 1996). Morphologically, PEC has epithelioid appearance characterized by clear to granular cytoplasm and round to oval central-located nuclei. They are usually located near vasculatures. Immunohistochemically, PEC shows expression of both myogenic and melanocytic markers. The cell of orgin of these tumors remains elusive and the molecular mechanism governing their initiation and progression is yet to be fully defined.
1.1.2 Genetics
Two TSC-determining genetic loci, TSC1 and TSC2, were identified by linkage analysis and positional cloning utilizing multigenerational family samples (Kandt et al., 1992; van Slegtenhorst et al., 1997). TSC1 is located on chromosome 9q34 and
TSC2 is located on chromosome 16p13. A wide spectrum of mutations were found in
these two genes of TSC patients including allelic variants, missense mutations and large genomic deletions. In some cases, large genomic deletions in TSC2 also disrupt the adjacent PKD1 causing severe polycystic kidney disease.
The frequency of mutations in these two genes are different. Mutations in TSC1 were mapped in 15% of TSC patients, while TSC2 mutation were identified in 80-90% of TSC patients. Loss of heterozygosity (LOH) in these two genes were found in the majority of TSC associated tumors, indicating TSC1 and TSC2 are tumor suppressor genes according to Knudson’s two-hit model (Knudson, 1971; Sepp et al., 1996).
1.1.3 Pathophysiology
domain in its C-terminal region (Wienecke et al., 1995; Xiao et al., 1997). This domain was found to be responsible for the tumor suppressor activity of TSC2 using cell culture and xenograft experiments (Jin et al., 1996). Both of these two proteins are evolutionally conserved from yeast to human.
A functional link between TSC1 and TSC2 proteins was established in later studies which demonstrated that these two proteins are physically associated with each other (Plank et al., 1998; van Slegtenhorst et al., 1998). TSC1 is essential in stabilizing TSC2 protein and preventing its degradation by ubiquitin-proteasome pathway (Benvenuto et al., 2000). The interdependent property of this heterodimeric protein complex were further validated in fruitfly and yeast (Gao and Pan, 2001; Matsumoto et al., 2002; Potter et al., 2001).
1.1.3.2 TSC1/TSC2 complex, a tumor suppressor in Insulin signaling pathway
Loss of function mutations of Tsc1 or Tsc2 in Drosophila leaded to massive tissue overgrowth which was characterized by increased cell proliferation and enlarged cell size. The phenotype of Tsc1-Tsc2 double mutant was similar to either Tsc1 or Tsc2 single mutant. In addition, overexpression of either Tsc1 or Tsc2 alone had no effect on tissue growth, while overexpression of both of them dramatically attenuated organ size through decreased cell proliferation and cell size. These observations implicated that Tsc1 and Tsc2 function together as a tumor suppressor regulating both cell proliferation and cell size during tissue growth (Gao and Pan, 2001; Tapon et al., 2001).
Insulin signaling was previously identified to be an important regulator of tissue growth during development in Drosophila (Stocker and Hafen, 2000). Tsc1 or Tsc2 mutant fruit flies showed similar phenotypes with Pten (phosphatase and tensin homologue deleted on chromosome 10) mutant, a negative regulator in insulin signaling (Gao et al., 2000; Goberdhan et al., 1999; Huang et al., 1999). Overexpression of insulin receptor lead to lethality in Drosophila and this could be rescued by co-overexpression of Tsc1 and Tsc2 but not by overexpression of either
Tsc1 or Tsc2 alone. Through extensive genetic epistasis studies in Drosophila,
TSC1/TSC2 complex was positioned in insulin signaling pathway downstream of Insulin Receptor/PTEN/AKT (protein kinase B) and upstream of S6K (ribosomal protein S6 kinase) by 2001 (Potter et al., 2001).
1.1.3.3 TSC1/TSC2 complex, an inhibitor of mTOR through Rheb
Subsequent studies in Drosophila showed that the phenotypes of Tsc1 or Tsc2 mutants could be rescued by deletion of an upstream activator of S6K, TOR (target of rapamycin) which was later known to be a core kinase in insulin signaling pathway and master regulator of cell growth and metabolism (Gao et al., 2002). Inhibition of mTOR (mammalian target of rapamycin) by rapamycin induced apoptosis and suppressed proliferation of TSC1 or TSC2 null cells in vitro and in mice (Kenerson et al., 2002).
Furthermore, a small G-protein Rheb (Ras homologue enriched in brain) was identified linking TSC1/TSC2 complex to mTOR. In Drosophila, Rheb was identified to be a positive regulator of tissue growth upstream of TOR and S6K, downstream of TSC1/TSC2 complex (Stocker et al., 2003). Biochemical studies showed that TSC1/TSC2 complex could directly bind and inhibit Rheb GTPase activity through the GAP domain of TSC2 (Inoki et al., 2003). GTP-bound thus activated Rheb could directly bind and activate mTOR kinase activity (Long et al., 2005).
Thus, TSC1/TSC2 complex was identified to be a tumor suppressor through inhibiting mTOR activity.
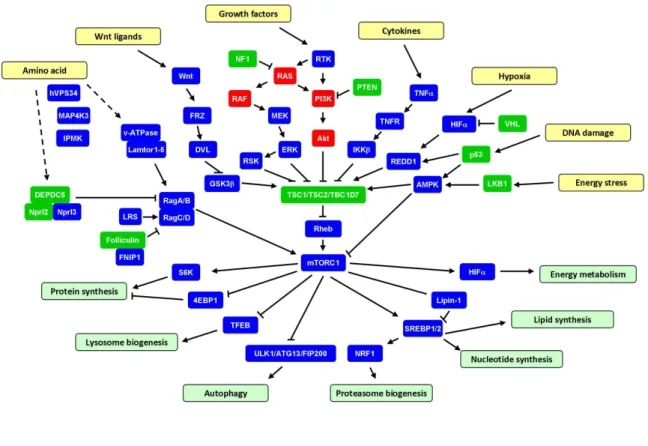
Figure 1. TSC1/TSC2/TBC1D7-mTORC1 signaling pathway.
mTOR kinase functions in two distinct complexs regulating cell proliferation, survival and cell metabolism (Laplante and Sabatini, 2012). mTOR kinase complex 1 (mTORC1) is composed of mTOR, raptor (regulatory associated protein of mTOR), LST8 (lethal with SEC13 protein 8), PRAS40 (proline-rich Akt substrate 40 kDa), DEPTOR (DEP domain containing mTOR-interacting protein) and Tti/Tel2 complex while mTOR kinase complex 2 (mTORC2) consists of mTOR, rictor (rapamycin-insensitive companion of mTOR), SIN1 (stress-activated protein kinase interacting protein 1), LST8, DEPTOR and Tti/Tel2. The primary role of TSC1/TSC2 complex is a negative regulator of mTORC1 through inhibiton of Rheb activity.
TSC1/2-mTORC1 pathway senses and integrates a diversity of upstream signals including growth factors, amino acids, oxygen, energy status and stress to control
Growth factors activates mTORC1 through PI3K/Akt/TSC1-TSC2/Rheb signaling axis. TSC2 is phosphorylated by Akt primarily on Serine939 and Theronine1462 in response to growth factor stimulation (Inoki et al., 2002). Although this phosphorylation event do inhibit the activity of TSC1/TSC2 complex toward Rheb/mTORC1, the GAP activity of TSC2 is not altered upon phosphorylation by Akt. By cellular fractionation studies, it was reported that more TSC2 was detected in the cytosolic fractions rather than membrane fractions following growth factor stimulation (Cai et al., 2006). TSC1/TSC2 complex is later identified to detach from lysosomes and lose contact with Rheb, a portion of which is residing on the surface of lysosomes and activating mTORC1 there, upon phosphorylation by Akt in response to growth factors (Menon et al., 2014). In addition, ERK and RSK are also demonstrated to directly phosphorylate TSC2 and promote mTORC1 activation in response to growth factor treatment (Roux et al., 2004).
Inflammatory cytokine tumor necrosis factor α (TNFα) activates mTORC1 signaling through TSC1. It was uncovered that the downstream kinase of TNFα signaling inhibitory κB kinase β (IKKβ) bind and phosphorylate TSC1 on Serine487 and Serine511, leading to disruption of TSC1/TSC2 complex and degradation of TSC1 (Lee et al., 2007).
Cellular energy stress, such as accumulation of AMP, rapidly inhibit mTORC1 activity through LKB1 (Liver kinase B1)/AMPK (AMP-dependent protein kinase) signaling pathway (Shaw et al., 2004). Activated AMPK phosphorylates and activates TSC2 on Threonine1271 and Serine1387. Low oxygen levels also lead to mTORC1 inactivation through transcriptional activation of REDD1 (regulated in DNA damage and development 1) by HIFα (Brugarolas et al., 2004). REDD1 triggers the dephosphorylation and activation of TSC2 through removal of 14-3-3 proteins associated Serine939 and Theronine1462 and PP2A-dependent dephosphorylation of Akt on Thr308 (but not Ser473) (Dennis et al., 2014). DNA damage inhibits mTORC1 signaling by activating TSC1/TSC2 complex through both AMPK and
activate mTORC1 signaling by glycogen synthesis kinase 3β (GSK3β)-mediated phosphorylation of TSC2 (Inoki et al., 2006; Mak et al., 2005).
Amino acids availability tightly regulates mTORC1 activity. It is mainly through heterodimeric GTPases RagA/B and RagC/D, which were anchored to lysosomes through Ragulator protein complex (Lamtor1-5) and v-ATPase (Sancak et al., 2010; Sancak et al., 2008; Zoncu et al., 2011). With high amino acids levels, RagA/B is charged with GTP and RagC/D is bound to GDP, which facilitate mTORC1 lysosomal localization and activation. Several protein complex, such as GATOR1 (DEPC5, Nprl2, Nprl3), GATOR2 (Mios, Seh1l, WDR24, WDR59, Sec13) and Folliculin complex (Folliculin and FNIP1) which have GAP or GEF activities toward Rag GTPase, are identified to be involved in the activation of mTORC1 by amino acids (Bar-Peled et al., 2013; Bar-Peled et al., 2012). In addition, the class III PI3K vacuolar protein sorting 34 (VPS34), the Ste20 related kinase mitogen-activated protein kinase kinase kinase kinase 3 (MAP4K3) and inositol polyphosphate multikinase (IPMK) are linked to mTORC1 signaling activation by amino acids (Byfield et al., 2005; Findlay et al., 2007; Kim et al., 2011). Whether TSC1/TSC2 complex is involved in the amino acid-induced mTORC1 activation remains to be fully understood. In TSC2 null cells, amino acid withdraw leads to more than 50% decrease of mTORC1 signaling measured by phosphorylation of its downstream targets S6K and 4EBP1 (Smith et al., 2005), indicating that there are amino acids sensing pathways leading to mTORC1 activation independent of TSC1/TSC2 complex. It has been shown recently that upon amino acid withdraw, Rag GTPases release mTORC1 from lysosome surface and recruit TSC1/TSC2 to the lysosome to inhibit Rheb in the mean time. Without TSC2, cells can not fully release mTORC1 from lysosome (Demetriades et al., 2014). This may partially explain the residue mTORC1 activity upon amino acid removal in TSC2 null cells. However, the direct molecular sensor of amino acids remain to be identified.
By phosphorylating specific effector proteins, mTORC1 regulates multiple downstream signaling pathways. mTORC1 promotes protein synthesis by phosphorylating S6 kinase 1 (S6K1) and translational regulators eukaryotic translation initiation factor 4E binding protein 1 (4E-BP1) (Laplante and Sabatini,
sequestration and facilitating sterol regulatory element-bindng protein 1/2 (SREBP1/2) function, to drive nucleotides, lipid synthesis and proteasome biogenesis (Peterson et al., 2011; Zhang et al., 2014b). mTORC1 regulates energy metabolism through activating the transcription and translation of hypoxia inducible factor 1α (HIF1α).
Through phosphorylating and inhibiting TFEB nuclear translocation, mTORC1 suppresses lysosome biogenesis (Settembre et al., 2012). mTORC1 also directly phosphorylates a kinase complex, consisting of ULK1/Atg13/FIP200 (unc-51-like kinase 1/ mammalian autophagy-related gene 13/ focal adhesion kinase family-interacting protein of 200 kDa), to inhibit the initiation of autophagy, which is an eukaryotic catabolic pathway that sequesters cellular organelles and proteins in double-membrane autophagosomes, delivers and degrades the cargos in lysosomes (Xie and Klionsky, 2007).
1.1.3.5 TSC1 and TSC2 function beyond mTORC1
Although TSC1 and TSC2 have been shown to function in one complex inhibiting mTORC1 signaling pathway, it does not rule out the possibility that they may also function separately and independent of mTORC1. TSC1 was identified to interact with actin binding protein ezrin-radixin-moesin. Cells which are deficient of TSC1 showed decreased focal adhesion formation. Overexpression of TSC1 leaded to activation of small GTPase Rho which induced stress fiber assembly and focal adhesion formation (Lamb et al., 2000). Futhermore, overexpression of TSC2 also activated GTPase Rho, but not Rac1 or cdc42, through which regulating cell adhesion and migration (Astrinidis et al., 2002).
TSC1/TSC2 was demonstrated to interact with and promote the activity of mTORC2. In TSC1 or TSC2 null cells, the level of phosphorylated Akt Serine473, a substrate of mTORC2, was decreased. This effect was also uncovered in tumor cells from TSC patients (Huang et al., 2008).
TBC1D7 is identified as the third partner of TSC1/TSC2 complex which is found to associate with TSC1/TSC2 complex ubiquitously (Dibble et al., 2012). Disruption of TBC1D7 decreases the GTPase activating protein activity of TSC complex against Rheb and activates mTORC1 signaling. However, genetic sequencing studies did not find mutations in TBC1D7 locus of TSC patients.
1.1.4 Animal models of TSC
Various animal models have been created for detailed characterization of the cellular and molecular pathogenic process of TSC-associated tumors and for testing of potential therapeutic interventions.
1.1.4.1 The Eker rat
The Eker rat, with a spontaneous Tsc2 mutation, was first discovered and maintained by Dr. Eker. Homozygous pups with Tsc2 mutations died around embryonic day 11 (E11) and E12. Tsc2 heterozygous rats developed renal cystadenomas, uterine leiomyomas, splenic hemangiosarcomas and brain subependymal lesions. The renal tumors in Eker rats showed the activation of mTORC1 pathway and had been used to test the efficacy of mTOR inhibitor in treating TSC1/2-null tumor cells.
1.1.4.2 Tsc1+/- and Tsc2+/- mice
Tsc1 and Tsc2 knockout alleles were generated in 1999-2002 (Kobayashi et al., 1999; Kobayashi et al., 2001; Kwiatkowski et al., 2002; Onda et al., 1999). Tsc1-/- and Tsc2-/- embryos died at mid-gestation stage during development. Tsc1+/- and
Tsc2+/- mice showed similar phenotypes characterized by development of
cystadenomas in the kidney and hemangiomas in the liver. They were also found to have impaired spatial learning capacities. The tumor growth and neurocognitive defects in these model could be reversed by mTOR inhibition.
1.1.4.3 Tissue-specific Tsc1/2 knockout model, brain
An astrocyte specific Tsc1 knockout was generated by crossing a floxed allele of Tsc1 (Tsc1fl/fl) and GFAP-Cre allele (Uhlmann et al., 2002). These mice showed increased number of astrocytes in the brain and developed seizures at around 2 month old with a median survival of 12 weeks.
Meikle et al, reported a neuronal specific Tsc1 knockout mouse model using synapsin I-Cre (Meikle et al., 2007). These mice developed seizures and displayed enlarged neurons in the cerebral cortex and hippocampus. They also displayed defects in neuronal myelination.
Another study targeted Tsc1 specifically in a portion of neuronal progenitor cells using doxycyclin inducible Nestin-Cre (Goto et al., 2011). These mice developed severe seizures and premature death which can be rescued by mTOR inhibitor treatments. Interestingly these mice showed vacuolated enlarged cells similar with gaint cell observed in cortical tubers of TSC patients.
Two mouse models which develop human subependymal nodules (SEN) like lesions were generated using EMX1-Cre to target embryonic telencephalic neural stem cells and tamoxifen-inducible Nestin-Cre to target neuronal progenitor cells respectively (Magri et al., 2011; Zhou et al., 2011). These two studies reported for the first time that human TSC lesions in the lateral vertricle region were reproduced in mice and proved their neural stem cell origin.
Deletion of Tsc1 in Purkinje cells of mouse cerebellum using L7-cre leaded to autism-like behavior of the mutant mice (Tsai et al., 2012). mTOR inhibition by rapamycin reversed the behavioural defects.
Disrupting Tsc1 in a subset of epithelial tubular cells in kidney induced the formation of multiple cysts due to activation of mTORC1 since this phenomenon could be rescued by rapamycin treatment (Zhou et al., 2009).
1.1.4.5 Tissue-specific Tsc1/2 knockout model, heart
Targeting Tsc1 in cardiovascular tissue using smooth muscle protein-22 (SM22) Cre resulted in ventricular hypertrophy as a result of mTOR activation in Tsc1 null cells and a median survival of 24 days (Malhowski et al., 2011). Rapamycin treatment led to longer survival and decreased ventricular hypertrophy of the mutants.
1.1.4.6 Mouse models for mesenchymal tumors in kidney and lung
Mesenchymal tumors in the kidney and lung are major sources of morbidity and mortality of TSC adult patients. However, they have never been reproduced in currently available TSC animal models. Their cell of orgin is unknown and the molecular nature underlying the proliferation and differentiation during their initiation and progression processes remain to be de defined.
1.1.5 Treatment
The safety and efficacy of mTOR inhibitor (Everolimus) in treating TSC patients were tested first in a Phase I/II clinical trail on SEGA, later in two Phase III, randomized, double-blind and placebo-control clinical studies on SEGA, Angiomyolipoma and sporadic Lymphangioleiomysmatosis (Bissler et al., 2013; Franz, 2013). Everolimus has been shown to be effective in reducing the tumor size and approved for the treatment of TSC-associated SEGA and Angiomyolipomas. However, the tumors started regrowth when the treatment was discontinued. Furthermore, long term administration of mTOR inhibitors have undesirable side effects, including dislipidemia, hyperglycaemia, stomatitis, skin rash, lung fibrosis, leucopoenia and anaemia.
1.2 Hippo-YAP signaling
1.2.1 Hippo signaling network
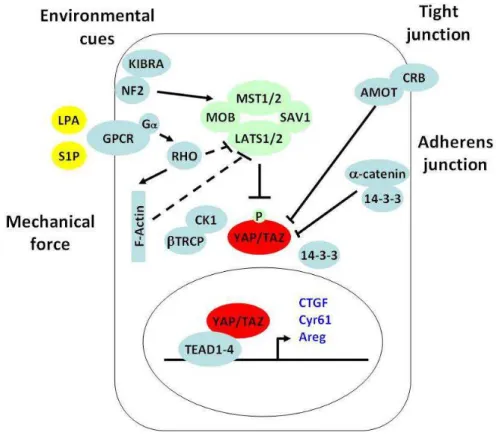
Hippo signaling pathway is another critical regulator of organ size during development in additional to the Insulin pathway, first indentified in Drosophila and conserved in mammals (Halder and Johnson, 2011; Pan, 2010; Tapon and Harvey, 2012; Yu and Guan, 2013). A kinase cascade is in the center of Hippo pathway which consist of the Ste20-like protein kinase Hippo (MST1/2 in mammals) and the NDR family protein kinase Warts (Lats1/2 in mammals), disruption of which lead to tissue overgrowth and tumorigenesis in Drosophila and mice. Warts (Lats1/2 in mammals) kinase in turn phosphorylates and inactivates transcriptional coactivator Yorkie (YAP/TAZ in mammals), the downstream effector of Hippo pathway.
1.2.2 YAP/TAZ transcriptional coactivators
YAP and its homolog TAZ are the major downstream effectors of Hippo pathway which shuttle between cytoplasm and nucleus. In nucleus, they function as transcriptional coactivators interacting with specific transcription factors to regulate the transcription of downstream target genes. YAP has been shown to be a master regulator of tissue growth. YAP null embryos die at embryonic day 8.5 (Morin-Kensicki et al., 2006), while TAZ null mice appear viable (Hossain et al., 2007). YAP and TAZ double mutant embryos cound not even survive the 16-cell morula stage during development. Overexpression of YAP in the mouse liver, intestine and skin lead to massive tissue overgrowth and tumorigenesis (Camargo et al., 2007; Dong et al., 2007; Schlegelmilch et al., 2011). YAP plays a critical role in promoting the anchorage-independent growth and epithelial to mesenchymal transition (EMT) of cancer cells in vitro (Zhao et al., 2007). Nuclear localization of YAP have been observed in about 60% human hepatocelluar carcinomas, 15% human ovarian cancers and 65% human non-small-cell lung cancers (Wang et al., 2010; Xu et al., 2009; Zhang et al., 2011). Thus, YAP is identified to be an oncoprotein.
Several DNA-binding transcription factors have been shown to be associated with YAP, such as the Runt family member Runx2 (Yagi et al., 1999), the p53 family member p73 (Strano et al., 2001) and TEAD/TEF family transcription factors (Vassilev et al., 2001). TAZ has also been found to interact with a panel of transcription factors including Runx2, thyroid transcription factor 1, PPARr, Tbx5, TEAD1, Pax3, and Smad2/3/4. Among these transcription factor, TEAD/TEF family transcription factors 1-4 (TEAD1-4, Sd in Drosophila) were demonstrated to be the critical mediators of the physiological functions of YAP/TAZ in Hippo pathway (Chan et al., 2009; Ota and Sasaki, 2008; Zhang et al., 2009; Zhao et al., 2008). Multiple transcriptional downstream target genes of YAP/TAZ have been identified, such as connective tissue growth factor (CTGF), the EGF family member amphiregulatin (AREG), Cyr61 and IAP family member BIRC5.
1.2.3 Regulation of YAP/TAZ in mammals
1.2.3.1 Phosphorylation-dependent cytoplasmic sequestration
Phosphorylation of YAP on Serine127 by Lats1/2 kinase leads to its binding to 14-3-3 and cytoplasmic sequestration. This mechanism is conserved in TAZ and Yki. A number of upstream signals regulate YAP in this manner. Cell mechanical property changes such as disruption of stress fibres F-actin or actin contractility caused phosphorylation and nuclear export of YAP through RHO GTPase and Lats1/2 kinase (Dupont et al., 2011; Fernandez et al., 2011; Sansores-Garcia et al., 2011; Wada et al., 2011). Extracellular cues such as lysophosphatidic acid (LPA), sphingosine-1-phosphate (S1P) were also found to modulate YAP phosphorylation and cytoplasmic retention through G protein coupled receptors (GPCR)/RHO GTPase/Lats1/2 (Miller et al., 2012; Yu et al., 2012). In skin keratinocytes, YAP was phosphorylated by an unknown kinase and sequestered in the cytosol through binding to 14-3-3 and α–catenin (Schlegelmilch et al., 2011). Extra centrosomes in
tetraploid cells leaded to YAP phosphorylation and inhibition through Lats1/2 activation by modulating small GTPase Rac1 and RhoA (Ganem et al., 2014). Additionally, a diversity of proteins modulate YAP phosphorylation and cytoplasmic retetion through regulating its upstream kinases including Merlin, Kibra, RASSFs, PP2A, TAO, MARK1/PAR1 and SIKs.
1.2.3.2 Phosphorylation-dependent degradation through ubiquitin-proteasome pathway
Lats1/2 kinase could also phosphorylates YAP on Serine381 which primes the subsequent phosphorylation of YAP by CK1delta/epsilon leading to the recruitment of the E3 ubiquitin ligase SCF(β-TRCP). β-TRCP promotes the ubiquitination of YAP and its degradation by the proteasome (Zhao et al., 2010).
Angiomotin has been shown to directly bind to YAP and lead to its association with tight junctions (Zhao et al., 2011). In addition, multiple proteins directly interact with YAP/TAZ to modulate their activities in different contexts including WW domain-binding protein 2 (WBP2) (Chen et al., 1997), multiple ankyrin repeats single KH domain-containing protein (MASK) (Sidor et al., 2013), zona occludens protein 1 (ZO1), ZO2 (Oka et al., 2010), homeodomain-interacting protein kinase 2 (HIPK2) (Poon et al., 2012).
1.2.4 Crosstalk between two master regulators of organ size, mTOR
signaling and Hippo-YAP signaling
Genetic studies have shown that the Tuberous Sclerosis Complex (TSC) 1/TSC2/mammalian Target Of Rapamycin (mTOR) and the Hippo/Yes-associated protein 1 (YAP) pathways are master regulators of organ size, which are often involved in tumorigenesis. The crosstalk between these signal transduction pathways in coordinating environmental cues, such as nutritional status and mechanical constraints, is crucial for tissue growth. YAP has been shown to regulate mTOR activity through modulating PTEN expression level by mir29 (Tumaneng et al., 2012b). EGF/PI3K/PDK1 regulates YAP dephosphorylation and nuclear localization in a Akt/mTOR independent mechanism (Fan et al., 2013; Strassburger et al., 2012). Whether and how mTOR regulate YAP remains elusive.
2 Results
2.1 Generation of mosaic-Tsc1KO mice which develop multisystem
lesions showing similarities with human TSC.
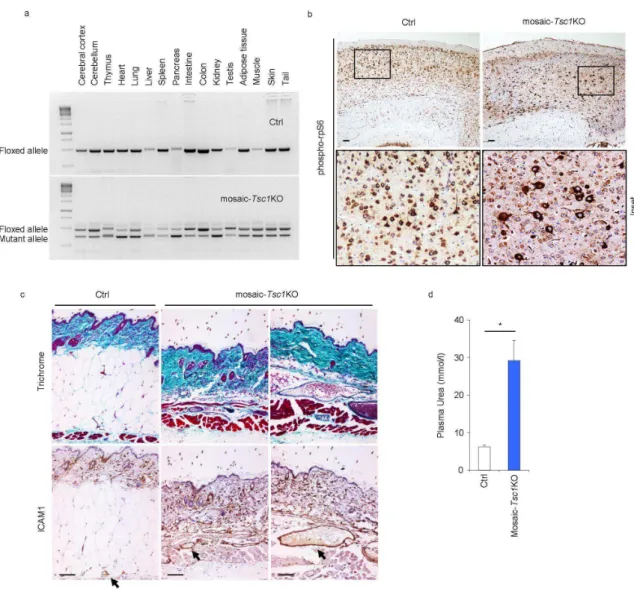
Since TSC is a multiorgan mosaic disease with early manifestations in infancy and childhood, we generated mice that were homozygous for a floxed Tsc1 allele (Tsc1fl/fl), and carried a ubiquitously expressed and temporally regulated Cre transgenic allele (CAGGCre-ERTM) (Hayashi and McMahon, 2002;Meikle et al., 2007). Depending on the dose of Tamoxyfen (TM), Cre-ERTM stochastically causes recombination of floxed alleles in a variable percent of cells in every tissue (Hayashi and McMahon, 2002), thus potentially targeting cells that give rise to the heterogeneous lesions. To circumvent the embryonic lethality of the whole body Tsc1 deletion, we injected a relatively low dose of TM (10 mg/kg) intraperitoneally to pregnant dams at embryonic day 15.5 (E15.5). Cre-ERTM -positive pups were viable at birth and reached young adulthood at the same Mendelian frequency as the control littermates. However the majority of Cre-ERTM -positive mice did not survive over 10 weeks of age. We therefore focused our analysis on 6 week-old mice before the onset of lethality. At this age, recombination of the Tsc1 allele was seen in every organ analysed at 30% - 80% frequency, depending on the organ (Fig. 3a). These data indicate that generalized mosaicism for complete Tsc1 loss was achieved in these mice. Henceforth, these mutant mice are named mosaic-Tsc1KO.
Histological analysis of mosaic-Tsc1KO mice was performed in multiple tissues, with special attention to anatomical locations that are commonly affected in TSC. The cerebral cortex revealed a disorganization of the cortical layers and the presence of enlarged dysplastic neurons immunoreactive with antibodies against phosphorylated ribosomal protein S6 (rpS6), a marker of mTORC1 activity (Fig. 3b), as previously observed upon brain specific deletion of Tsc1 (Meikle et al., 2007;Zhou et al., 2011). Furthermore, the dermal layer of the skin was thickened while the
abnormally enlarged in the dermal and muscular layers of the skin of mosaic-Tsc1KO mice. Macroscopically, the fur of the mutant mice was fairer than in their littermates (data not shown). Kidneys were enlarged and highly susceptible to haemorrhage (Fig. 4a). Kidney failure was underscored by a three fold increase of the plasma urea levels (Fig. 3d). In conclusion, the mosaic-Tsc1KO mice develop a multisystem and early-onset disease resembling different aspects of human TSC.
Figure 3. Mosaic-Tsc1KO mice develop multisystem lesions showing similarities with human TSC. (a) Genomic DNA was prepared from control (ctrl) and mosaic-Tsc1KO mice 1.5 months after
tamoxifen injection, and the floxed/mutant alleles were detected by PCR in the indicated organs. (b) Expression of phospho-rpS6 in cerebral cortex sections from ctrl and mosaic-Tsc1KO mice was analyzed by immunohistochemical staining. (c) Skin samples of ctrl and mosaic-Tsc1KO mice were stained for ICAM-1 expression and using Trichrome. Arrows indicate ICAM-1 positive vessels. (d) Plasma urea concentrations were determined in ctrl and mosaic-Tsc1KO kidneys (Mean ± s.e.m., N=4 mice/group, *p<0.05). Scale bar, 100 µm. Three independent pregnant females were injected with Tamoxifen. For immunohistochemistry analysis, similar stainings were found in four different ctrl/mosaic-Tsc1KO mice (6 weeks of age, two sections per each mouse).
2.2 Mosaic-Tsc1KO mice develop renal mesenchymal lesions
recapitulating PEComas associated with human TSC.
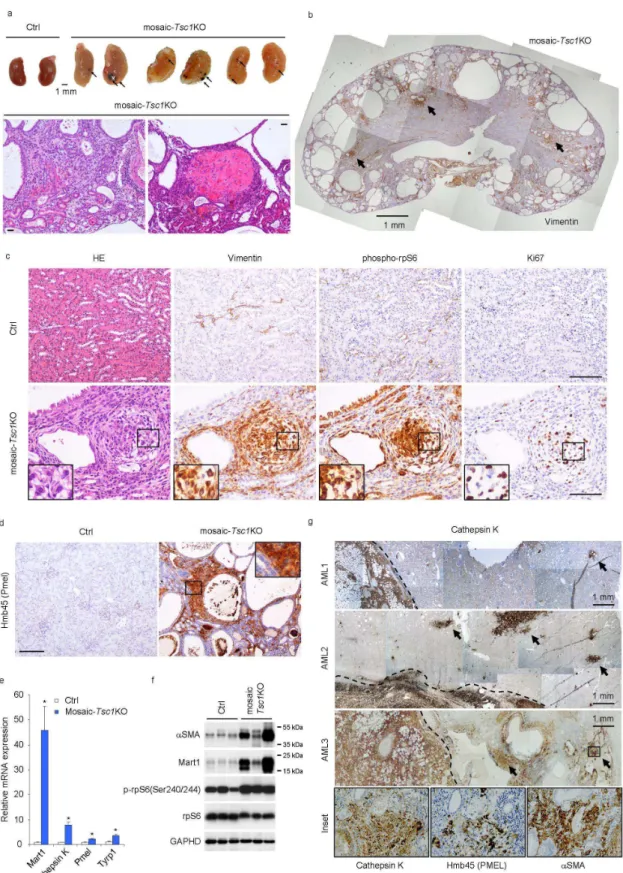
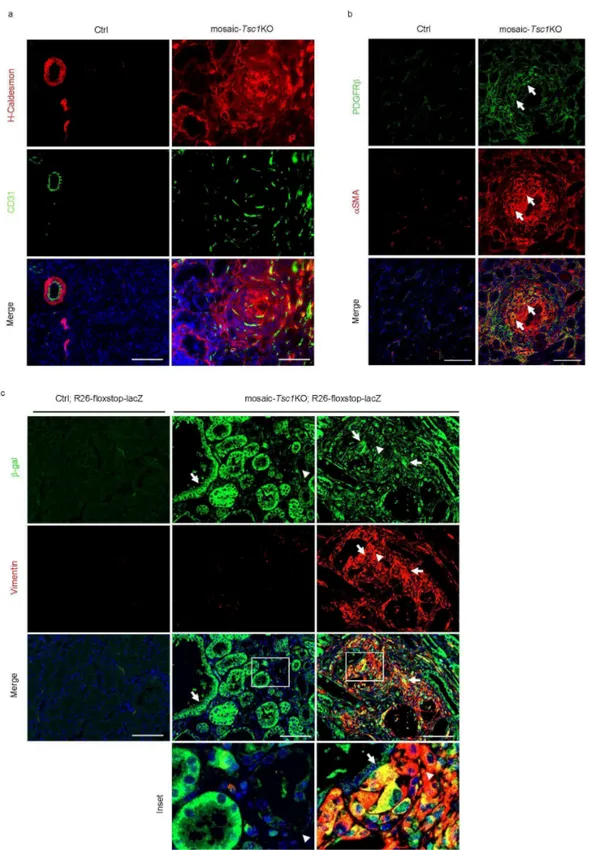
We investigated whether the stochastic Tsc1 deletion at E15.5 of embryogenesis targets cells giving rise to mesenchymal lesions, such as PEComas. We examined the mutant kidneys in detail, as the observed haemorrhages might be due to vascular lesions, and haemorrhage is an important complication of TSC renal angiomyolipoma (Bissler et al., 2013). Consistent with the phenotype in other TSC mutant animal models (Onda et al., 1999; Zhou et al., 2009), the mosaic-Tsc1KO kidneys were polycystic, a sign of abnormal proliferation of tubular epithelial cells (Fig. 4b). However, immunostaining with Vimentin antibody, a marker of mesenchymal cells, revealed several lesions (Fig. 4b), appearing as small, well defined, fasciculated nodules (Fig. 4c). Cells within the lesions expressed additional mesenchymal markers, such as H-Caldesmon and α-smooth muscle actin (αSMA) (Fig. 5a and 5b). These nodules were proliferative, as demonstrated by immunostaining with Ki67 antibodies, and displayed high mTORC1 signalling, as shown by phosphorylation of rpS6 (Fig. 4c). They were frequently observed near vessels (Fig. 4c), and/or contained disorganized vascular components highlighted by CD31-positive endothelial cells and PDGF receptor β-, αSMA- double positive pericytes (Fig. 5a and 5b). Importantly, these mesenchymal lesions also showed immunoreactivity with the HMB45 antibody recognizing the melanocytic marker Pmel (also named gp100), which is a pathognomonic feature of PEComas (Fig. 4d). Moreover the mRNA levels of several melanocytic markers including Mart1, Cathepsin K, Pmel, Tyrp1 were sharply increased in mutant kidneys (Fig. 4e). Finally, immunoblot analysis of protein extracts confirmed the induction of both melanocytic (Mart1) and myogenic markers (αSMA), along with mTORC1 activation in
mosaic-Tsc1KO kidneys (Fig. 4f). To monitor Cre recombinase activity within the lesions, the
mosaic-Tsc1KO mice were crossed with transgenic mice carrying a flox-stop-flox-lacZ reporter at the Rosa26 locus. As shown in Fig. 5c, the epithelial cells lining the
To directly compare the mesenchymal lesions found in mosaic-Tsc1KO kidneys with human specimens, we screened samples of renal angiomyolipomas occurring in TSC patients. As shown in Fig. 4g, the majority of human angiomyolipomas were surrounded by a number of smaller lesions, so called micro-hamartomas (or microscopic angiomyolipomas), which shared the common expression of cathepsin K, αSMA and PmeI. It is likely that the small lesions represent early developmental stage of angiomyolipomas. Importantly, these microhamartomas exhibited a striking similarity with their murine counterparts in terms of morphology and immunophenotype. In conclusion, mosaic-Tsc1KO mouse kidneys develop renal mesenchymal lesions similar with PEComas observed in human TSC patients. However we did not observe any kidney angiomyolipomas in these mice. This may be due to the premature mortality seen in these mice, precluding further lesion development into full blown angiomyolipomas.
Figure 4. Mosaic-Tsc1KO mice develop renal mesenchymal lesions recapitulating PEComas associated with human TSC. Kidneys from ctrl (N=3) and mosaic-Tsc1KO (N=3) mice were analyzed
at 6 weeks of age. (a) Macroscopic photos and representative H&E staining. Arrows indicate hemorrhages. (b-d) Expression of vimentin (b, c), phospho-rpS6 and Ki67 (c) and Hmb45/Pmel (d)
PCR. (Mean ± s.e.m., N=3 mice/group, *p<0.05). (f) Expression of αSMA, Mart1, p-rpS6, and total rpS6 protein was assessed by immunoblot. (g) Expression of the indicated proteins in three distinct human angiomyolipoma (AML) samples was assessed by immunohistochemistry. Arrows indicate the micro-hamartoma. Scale bar, 100 µm unless otherwise indicated. Insets show higher magnification of the lesions indicated with squares.
ctrl and mosaic-Tsc1KO mice at 6 weeks of age and analyzed by immunofluorescence for H-caldesmon and CD31 (a) or PDGFRβ and αSMA (b). Arrows in (b) indicate PDGFRβ and αSMA double positive pericytes. Scale bar, 100 µm. (c) Expression of β-gal and vimentin on kidney sections from Ctrl;R26-floxstop-LacZ and mosaic-Tsc1KO;R26-floxstop-LacZ mice was assessed by immunofluorescence. Arrows indicate β-gal positive cells and arrowheads show β-gal negative cells. Insets show higher magnification of tissue indicated with squares. Scale bar, 100 µm. Similar stainings were found in three different mice/genotype (three sections per each mouse).
2.3 YAP is up-regulated by mTOR in renal lesions of
mosaic-Tsc1KO mice and human angiomyolipoma.
The phenotype of mosaic-Tsc1KO mouse kidneys consisted of enlarged organ size, polycystosis and microscopic PEComas. To gain mechanistic insights, we screened transcriptional outputs of developmental pathways involved in tissue growth, planar cell polarity, and multipotency. These included target genes of Notch, Wnt, Hedgehog and Hippo pathways (data not shown and Fig. 6a). Of note, the
mosaic-Tsc1KO kidneys had a two to eight fold increase in mRNA levels of connective tissue
growth factor (CTGF), amphiregulin (Areg), and Cyr61, all known transcriptional targets of the Hippo pathway (Tumaneng et al., 2012a). This stimulation was blunted by treating the mice every other day for two weeks with the rapamycin derivative Temsirolimus (5 mg/kg), suggesting a tight control of the Hippo pathway by mTOR in
Tsc1 mutant kidneys. Next, we examined the levels of YAP, whose function is
required for the transcriptional regulation of CTGF, Areg and Cyr61 downstream of the Hippo pathway. While YAP mRNA levels were not affected by Tsc1 deletion and mTOR inhibition (Fig. 6a), the protein amount tightly correlated with mTORC1 activity as assessed by phosphorylated rpS6 levels in kidneys (Fig. 6b). The increase in YAP levels was detected both in cytosol and nuclei (Figure 6c). TAZ, the homolog of YAP, was also up-regulated at the protein level in mosaic-Tsc1KO kidneys (Fig. 6b).
To localize the kidney cell compartment expressing YAP, immunostaining was performed (Fig. 6d). In adult floxed control littermates, YAP was found in scattered tubular epithelial cells of the kidney cortex. Strikingly, Tsc1 deletion caused a widespread expression of YAP in both tubular epithelial cells lining the cysts and in
Tsc1KO mouse kidneys a large fraction of YAP was localized in the nuclei, consistent
with an active function as a transcriptional regulator.
Figure 6. YAP is up-regulated by mTOR in renal lesions of mosaic-Tsc1KO mice and human angiomyolipoma. (a, b) Expression of indicated genes was determined by qRT-PCR (a) and
(5 mg/kg) every other day for two weeks before sacrifice. Mice were sacrificed at 6 weeks of age. (Mean ± s.e.m., N=3 mice/group, *p<0.05, **p<0.01). (c) Expression of indicated proteins was analysed by immunoblot in nuclear and cytoplasmic protein extractions from ctrl and mosaic-Tsc1KO mouse kidney samples. Similar results were found in three different mice/genotype. (d) YAP expression was assessed on kidney sections from ctrl and mosaic-Tsc1KO mice by Immunohistochemistry. Arrows indicate cells with YAP nuclear localization. Scale bar, 100 µm. Similar stainings were found in three different mice/genotype (three sections per each mouse). (e) Expression of indicated proteins was analysed by immunoblot in control human kidney and angiomyolipoma samples. (f, g) YAP expression was analysed by immunohistochemistry on human angiomyolipoma samples (N, normal kidney; T, Tumor). Arrows indicate cells with YAP nuclear localization. Scale bar, 100 µm. Insets show higher magnification of the lesions indicated with squares. Similar results were found in 7/7 different human angiomyolipoma samples.
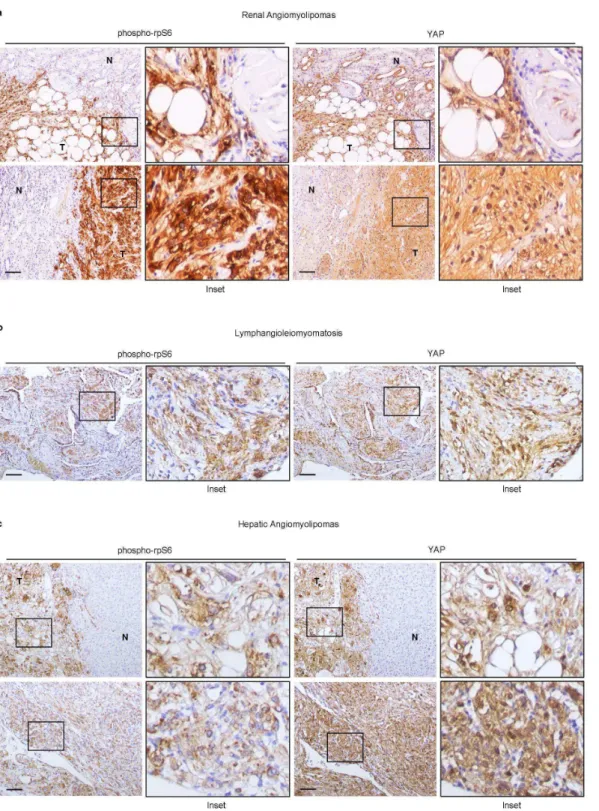
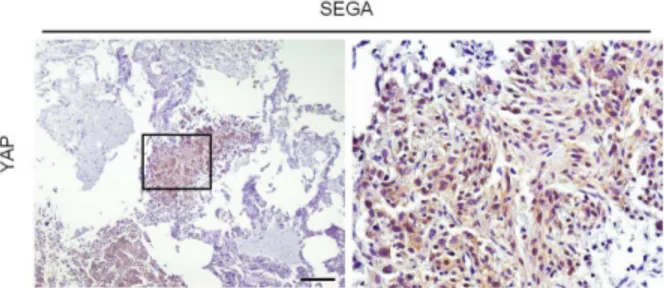
To determine whether the activation of the YAP pathway also occurred in human TSC, first we examined YAP, CTGF, and Areg protein levels in TSC angiomyolipomas by immunoblotting (Fig. 6e). The activation of mTORC1, as assessed by 4EBP1 and rpS6 phosphorylation, and the increased YAP protein were seen in all samples examined. Importantly, the transcriptional targets CTGF and Areg were also expressed at higher levels in angiomyolipomas. Since the levels of TAZ were more variable among the human samples analysed, we decided to focus our analysis on YAP in this study. Next, we analyzed YAP localization in the different cell types of human angiomyolipomas and in the adjacent kidney structures. As shown in Fig. 6f, high levels of YAP immunoreactivity were detected in all cell types that could be found in angiomyolipomas, i.e. adipocytes, smooth muscle cells and blood vessel components. In the adjacent kidney regions, YAP protein was almost undetectable, except for small YAP-positive cysts of epithelial origin lining the lesion. The YAP antibody also stained small human renal micro-hamartomas that closely resembled the mesenchymal lesions observed in mosaic-Tsc1KO mouse kidneys (Fig. 6g). Finally, we examined other human TSC-related PEComas from different organs. In pulmonary lymphangioleiomyomatosis, hepatic angiomyolipomas, as in renal angiomyolipomas, YAP expression invariably correlated with mTORC1 activity in tumor cells (Fig. 7). After screening a total of ten PEComas, YAP was found to be consistently highly expressed in all the specimens, and may be considered as a novel marker. Interestingly, we detect YAP expression already at early stages of human PEComa development, suggesting a putative role in the origin of the lesion. In addition, YAP upregulation and nuclear localization was also observed in
TSC-Figure 7. YAP levels correlates with rpS6 phosphorylation in human TSC-related PEComas.
(a, b, c) Immunohistochemical analysis of rpS6 phosphorylation and YAP expression in human
PEComa samples associated with TSC (a, renal angiomyolipomas; b, pulmonary
lymphangioleiomyomatosis; c, hepatic angiomyolipoma) (N, normal tissue; T, Tumor). Scale bar, 100 µm.
Figure 8. YAP upregulation and nuclear localizaiton in human TSC-related SEGA.
Immunohistochemical analysis of YAP expression in human SEGA samples associated with TSC. Scale bar, 100 µm.
2.4 YAP is required for the abnormal proliferation and survival of
TSC1/2 null cells in vitro.
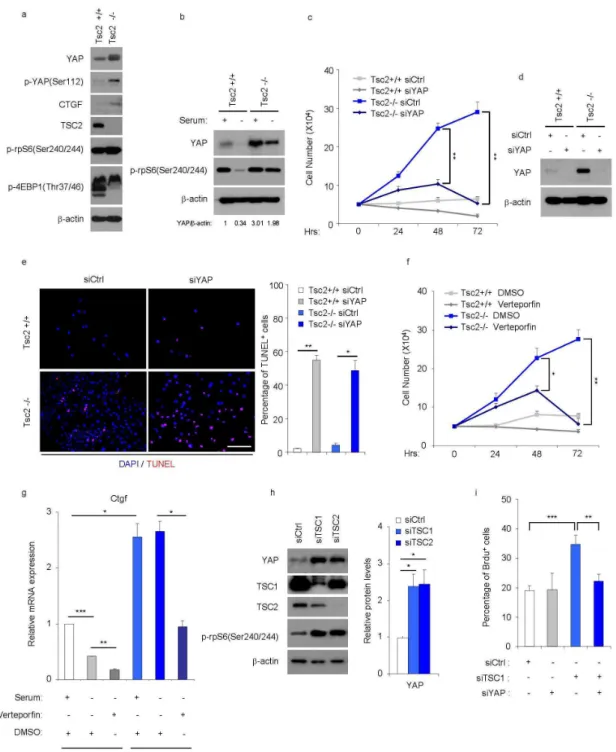
We then examined whether YAP contributed to the growth phenotype of TSC1/TSC2 deficient cells. We cultured mouse embryonic fibroblasts (MEFs) that were Tsc2-/- and Tsc2+/+ MEFs, which were in p53-/- background (Zhang et al., 2003). YAP protein levels were increased by three fold in the Tsc2 null cells (Fig. 9a). This effect was also observed in nuclear fractions (data not shown), and was paralleled by increased expression of the YAP target CTGF (Fig. 9a and 9g). Thus the up-regulation of the YAP pathway can also be observed in a cell autonomous manner upon TSC complex deficiency. This effect could not be ascribed to a relief of Hippo/Lats inhibition of YAP in Tsc2 null cells, because the amount of Ser112-phosphorylated YAP, a site of the Lats1/2 kinases (Zhao et al., 2010), parallelled the increase in total YAP protein in the mutant cells (Fig. 9a). Tsc2 deletion is known to provide a proliferative advantage over wild type controls in serum starvation conditions (Zhang et al., 2003). After 24h of serum starvation, the phosphorylation of the mTORC1 substrate rpS6 and the YAP protein levels were shut off in controls while remaining high in Tsc2-/- cells (Fig. 9b). As expected, cell counting over a three day-period after serum starvation indicated that the number of Tsc2-/- cells steadily increased as opposed to wild type control (Fig. 9c). Importantly the proliferation of
effect of YAP knockdown was mimicked by treatment with verteporfin, a compound that was reported to interfere with YAP binding to the TEAD1-4 transcription factors, and accordingly inhibited CTGF mRNA expression in Tsc2-/- cells (Fig. 9f and 9g) (Liu-Chittenden et al., 2012). YAP levels were also increased after TSC1 and TSC2 knockdown by RNAi in human embryonic kidney 293 (HEK293) cells (Fig. 9h). The concomitant knockdown of YAP impaired the proliferative advantage of TSC1-depleted HEK293 cells in serum starved conditions (Fig. 9i). Taken together, these data demonstrate that YAP activity is, at least partly, required to promote proliferation of TSC complex deficient cells in vitro.
Figure 9. YAP is required for the abnormal proliferation and survival of TSC1/2 null cells in vitro.
(a, b) Expression of indicated proteins was analysed by immunoblot in Tsc2+/+ and Tsc2-/- MEFs (these MEFs were generated in p53-/- background) cultured with or without serum for 24 hours. Similar results were observed in three independent experiments. (c-e) Tsc2+/+ and Tsc2-/- MEFs transfected with siCtrl or siYAP were cultured in serum starvation conditions for a 72-hour period. (c) Cell number was counted in different groups. Three independent experiments were performed and analysed (Mean ± s.e.m., **p<0.01). (d) Expression of YAP protein was analysed by immunoblot at 24-hour time point. Similar results were observed in three independent experiments. (e) Apoptotic cells were identified by TUNEL assay at 48-hour time point. The percentage of TUNEL positive cells was determined by counting TUNEL-positive nuclei among at least 500 cells in distinct fields of each experiment. Three
performed and analysed (Mean ± s.e.m., *p<0.05, **p<0.01). (g) Expression of Ctgf mRNA was assessed by qRT-PCR in different treatments. Three independent experiments were performed and analysed (Mean ± s.e.m., *p<0.05, **p<0.01, ***p<0.001). (h) Expression of indicated proteins was analysed by immunoblot in HEK293 cells transfected with siRNAs against TSC1, TSC2 or siCtrl. YAP protein level was normalized with β-actin. Four independent experiments were performed and analysed (Mean ± s.e.m., *p<0.05). (i) Percentage of BrdU positive HEK293 cells with indicated treatments under serum deprivation conditions for 24 hours was assessed by three-hour BrdU pulse-labeling before harvest. Three independent experiments were performed and analysed (Mean ± s.e.m., **p<0.01, *** p<0.001).
2.5 Inhibition of YAP pharmacologically or genetically attenuates
abnormal proliferation and induces apoptosis of Tsc1 null cells in
vivo.
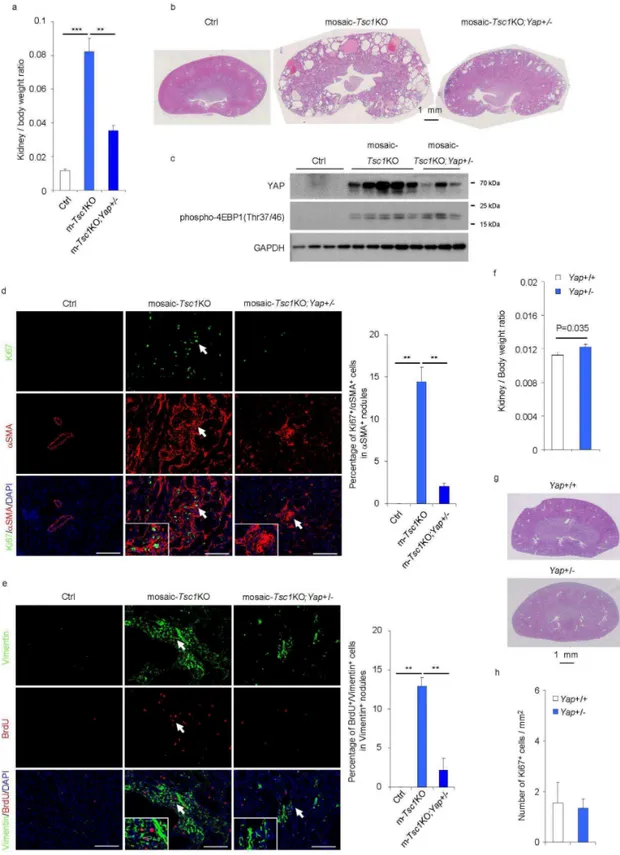
To assess the effects of YAP inhibition in vivo, mosaic-Tsc1KO and control mice were treated intraperitoneally with verteporfin (100 mg/kg) every other day for ten days (Liu-Chittenden et al., 2012). The YAP inhibitor reduced the kidney to body weight ratio by 50% (Fig. 10a), and attenuated overall kidney size and polycystosis in mutant mice without affecting control kidneys (Fig. 10b). These effects were concomitant to a reduction in CTGF expression (Fig. 10c). The proliferation of the mesenchymal lesions was severely affected by verteporfin treatment, as indicated by Ki67 staining of α-SMA positive cells (Fig. 10d). Furthermore, verteporfin treatment led to apoptosis of both epithelial and mesenchymal cells in mosaic-Tsc1KO kidneys (Fig. 10e). To specifically affect YAP expression by genetic means, we crossed
CAGGCre-ERTM; Tsc1fl/fl with Tsc1fl/fl;Yapfl/+ mice. The offspring mice were injected with TM at postnatal day 2 (P2), in order to generate mosaic-Tsc1KO carrying a mutant allele of Yap (mosaic-Tsc1KO;Yap+/-) . The heterozygous deletion of Yap was sufficient to reduce YAP protein levels in mosaic-Tsc1KO mice (Fig. 11c). This was accompanied by a sharp attenuation of the kidney phenotype as compared to mosaic-Tsc1KO mice, as assessed by the kidney to body weight ratio (Fig. 11a), kidney size and polycystosis (Fig. 11b), and mesenchymal cell proliferation (Fig. 10d and 11e). The residual lesions observed in mosaic-Tsc1KO;Yap+/- kidneys displayed rpS6 phosphorylation, suggesting efficient recombination (data not shown). Whole body heterozygous deletion of Yap (Yap+/-) did not inhibit kidney growth and proliferation (Fig. 11f, 11g and 11h), indicating that the reduction of YAP gene
dosage was particularly effective in a background of Tsc1 loss of function. Thus strategies targeting YAP activity might be beneficial in treating TSC related kidney overgrowth and PEComa formation.
independent experiments were performed and mice in different treatments were pooled for analysis. (a) Kidney / Body weight ratio of Ctrl and mosaic-Tsc1KO mice treated with placebo or Verteporfin (N=3 mice/group, Mean ± s.e.m, *p<0.05, ***p<0.001). (b) Representative pictures of Hematoxylin and eosin staining of kidney sections from Ctrl and mosaic-Tsc1KO mice treated with placebo or Verteporfin. Scale bar, 1 mm. (c) Expression of indicated mRNAs was analysed by qRT-PCR in kidney samples from Ctrl and mosaic-Tsc1KO mice treated with placebo or Verteporfin (N=3 mice/group, Mean ± s.e.m, *p<0.05, **p<0.01). (d) Percentage of Ki67 and αSMA double positive cells in αSMA positive mesenchymal lesions in the indicated kidneys. Immunofluoresence staining and counting were performed on three sagittal sections from different kidney regions for each mouse. Representative images are shown (Mean ± s.e.m., N=3 mice/group, ** p<0.01, Scale bar 100 µm). Insets show the lesions indicated with arrows. (e) In situ apoptotic cells was assessed by TUNEL assay on the kidney sections from Ctrl and mosaic-Tsc1KO mice treated with placebo or verteporfin. The number of TUNEL positive cells were counted in ten distinct fields of each section. Three sections were analysed per each mouse. Representative images are shown. Arrows indicate TUNEL positive epithelial cells and arrowheads show TUNEL positive mesenchymal cells. Insets show the lesions indicated with arrows. Mean ± s.e.m., N=3 mice/group, * p<0.05, Scale bar 100 µm.
Figure 11. Heterozygous deletion of Yap compromises the proliferation of renal mesenchymal lesions in mosaic-Tsc1KO mice. Three independent tamoxifen injection experiments were
performed and female mice of indicated genotypes were pooled for analysis. (a) Kidney/Body weight ratio of the indicated mice sacrificed at 6 weeks of age (Ctrl N=4, Tsc1KO N=5,
(Ctrl N=4, mosaic-Tsc1KO N=5, mosaic-Tsc1KO;Yap+/- N=3). Insets show the lesions indicated with arrows. Scale bars, 100 µm. Mean ± s.e.m., **p<0.01. (e) Percentage of BrdU and Vimentin double positive cells in Vimentin positive mesenchymal lesions in the indicated kidneys. BrdU (50 mg/kg) was injected intraperitoneally 24 hours before sacrifice. Immunofluoresence staining and counting were performed on three sagittal sections from different kidney regions for each mouse. Representative images are shown (Ctrl N=4, mosaic-Tsc1KO N=5, mosaic-Tsc1KO;Yap+/- N=3, mean ± s.e.m., ** p<0.01, Scale bar 100 µm). Insets show the lesions indicated with arrows. (f) Kidney / Body weight ratio of Yap+/+ (N=3) and Yap+/- (N=3) mice. (g) Hematoxylin and eosin staining of kidney sections from
Yap+/+ and Yap+/- mice. Scale bar, 1 mm. (h) Percentage of Ki67 positive cells per mm2 in kidney sections from Yap+/+ and Yap+/- mice (N=3). The number of Ki67 positive cells were counted in ten distinct fields per each section. Two sections were analysed per each mouse.
2.6 YAP is accumulated in TSC deficient cells due to blockage of
autophagy in a mTOR-dependent manner.
YAP is under tight control by a variety of upstream regulators (Tumaneng et al., 2012a). To gain mechanistic insights into the novel crosstalk between the TSC1/TSC2/mTORC1 and YAP, we asked which step of YAP expression was affected in Tsc2-/- cells. Consistent with the data in mosaic-Tsc1KO kidneys (Fig. 6a), the comparable YAP mRNA amount in Tsc2-/- and Tsc2+/+ cells ruled out transcriptional effects (data not shown). We did not find evidence for a regulation at the step of translational initiation, as the recruitment of YAP mRNA in the polysomal fraction was also equivalent in the two genotypes (data not shown). A major node in YAP regulation is the phosphorylation on five serine residues by the Lats1/2 kinases that causes cytosolic retention and promotes protein degradation by the proteasome (Huang et al., 2005;Zhao et al., 2010). However no major alteration in Lats1/2 kinase activity was detected in Tsc2-/- cells and kidney tissues, as indicated by the Ser-112 YAP phosphorylation (Fig. 6a and data not shown). Accordingly, 8 hour-treatment with the proteasome inhibitor MG132, while leading to a significant accumulation of polyubiquitinated proteins, did not affect YAP levels in either Tsc2-/- or control cells in growing conditions (data not shown). Intriguingly, the YAP phosphorylation by Lats1/2 kinases has been reported to induce a rapid degradation of YAP in high density, but not in low density culture conditions (Zhao et al., 2010), the latter pertaining to the experimental setup used in this study. Thus, in growing cells with no contact inhibition and with high mTOR activity, YAP levels are controlled by an alternative mechanism.
TSC1/2 mutant cells have impaired autophagic flux (Parkhitko et al., 2011), as
indicated by the reduced conversion of LC3-I to the cleaved and lipidated form LC3-II (Fig. 12c). We wondered whether an alteration in the lysosomal route of degradation might explain the YAP accumulation in Tsc2-/- MEFs. The lysosomotropic drug and autophagy inhibitor chloroquine (CQ) led to the accumulation of LC3-II that normally undergoes lysosomal turnover. This effect was paralleled by the accumulation of YAP protein in control MEFs, while the amount of YAP was not further increased by chloroquine in Tsc2-/- cells (Fig. 12a). In MEFs, YAP protein was localized in cytosol, nucleus and cytosolic vesicles, a fraction of which was also positive for the lysosomal marker Lamp2 (Fig. 12b). Impairment of lysosomal degradation by chloroquine treatment increased the amount of YAP detectable in the lysosomes, indicating that YAP is a cargo for lysosomal degradation. In Tsc2-/- cells, the amount of YAP localized in the lysosomes was reduced as compared to control cells in both untreated and chloroquine-treated conditions (Fig. 12b and 12c). Of note, interactome studies in Drosophila cells revealed a strong association of the Hippo pathway with endocytosis and vesicle trafficking complexes (Kwon et al., 2013).
To analyze the crosstalk between mTOR kinase activity and YAP, we used torin1, a potent ATP competitive inhibitor of mTOR (Thoreen et al., 2009), as assessed by the dephosphorylation of the mTOR substate 4EBP1 (Fig. 12d and 12e). Torin1 treatment of Tsc2-/- MEFs promoted LC3 lipidation, indicating an induction of the autophagic flux, which was accompanied by a reduction of YAP levels (Fig. 12d). The effect of Torin1 was also observed in autophagy competent control MEFs (Fig. 12d and 12e). However, in autophagy deficient Atg7-/- MEFs, mTOR inhibition was largely unable to induce YAP degradation (Fig. 12e). Similar to Torin1 treatment, nutrient starvation also promoted YAP degradation concomitantly with the induction of autophagy, in a chloroquine-sensitive manner (Fig. 12f). Of note, ectopic Flag-YAP co-immunoprecipitated with the autophagy cargo receptor p62 and with the upstream kinase Lats1 in basal conditions (Fig. 12g). Upon autophagy induction by nutrient starvation together with chloroquine treatment to induce a late autophagy block, the interaction with p62 and Lats1 was respectively up- and down-regulated. Finally, the
in vivo deletion of Atg7 in epithelial cells of kidney proximal tubules was sufficient to
Vps15 in Vps15f/f mice carrying an Albumin-Cre transgene (Vps15f/f; Alb-Cre) (Fig. 13). In conclusion, mTOR regulates YAP degradation through autophagy, which is dependent on ATG7. Our data favour a model in which the control of YAP lysosomal degradation by mTOR matches YAP activity with nutrient availability in growth permissive conditions.
Figure 12. YAP is accumulated in TSC deficient cells due to blockage of autophagy. (a)
Expression of indicated proteins was analysed by immunoblot in Tsc2+/+ and Tsc2-/- MEFs treated with or without choloroquine (CQ) for 8 hours. Similar results were observed in three independent
Expression of indicated proteins was analysed by immunoblot in Tsc2+/+, Tsc2-/- and Atg7+/+, Atg7 -/-MEFs culturing with or without Torin1 for 24 hours. Similar results were observed in three independent experiments. (f) Immunoblot analysis of YAP and LC3 in Hela cells with indicated treatments. YAP levels were normalized with β-actin. Similar results were observed in three independent experiments. (g) Immunoprecipitation analysis of interacting proteins of flag-tagged YAP in the indicated culturing conditions for 0.5 hour. Similar results were observed in three independent experiments. (h) Expression of indicated proteins was analysed by immunoblot in ctrl (N=3) and proximal tubules specific Atg7 knockout mouse kidney samples (N=3).
Figure 13. YAP is accumulated in both Atg7 and Vps15 deficient livers. (a) Immunoblot analysis
of Atg7f/f liver extracts two weeks after intravenous injection of Adenoviruses expressing GFP or Cre recombinase. (b) Immunoblot analysis of Vps15f/f liver extracts carrying or not the liver specific expression of Cre recombinase.