READ THESE TERMS AND CONDITIONS CAREFULLY BEFORE USING THIS WEBSITE.
https://nrc-publications.canada.ca/eng/copyright
Vous avez des questions? Nous pouvons vous aider. Pour communiquer directement avec un auteur, consultez la
première page de la revue dans laquelle son article a été publié afin de trouver ses coordonnées. Si vous n’arrivez pas à les repérer, communiquez avec nous à [email protected].
Questions? Contact the NRC Publications Archive team at
[email protected]. If you wish to email the authors directly, please see the first page of the publication for their contact information.
NRC Publications Archive
Archives des publications du CNRC
This publication could be one of several versions: author’s original, accepted manuscript or the publisher’s version. / La version de cette publication peut être l’une des suivantes : la version prépublication de l’auteur, la version acceptée du manuscrit ou la version de l’éditeur.
Access and use of this website and the material on it are subject to the Terms and Conditions set forth at
Model study of ice pressures
Nuttall, J.; Gold, L. W.
https://publications-cnrc.canada.ca/fra/droits
L’accès à ce site Web et l’utilisation de son contenu sont assujettis aux conditions présentées dans le site LISEZ CES CONDITIONS ATTENTIVEMENT AVANT D’UTILISER CE SITE WEB.
NRC Publications Record / Notice d'Archives des publications de CNRC:
https://nrc-publications.canada.ca/eng/view/object/?id=eed359cb-5603-4a42-aa8d-443bfdd97fa2 https://publications-cnrc.canada.ca/fra/voir/objet/?id=eed359cb-5603-4a42-aa8d-443bfdd97fa2
MODEL STUDY OF ICE PRESSURES
by J. NUTTALL
University o f Alberta Edmonton, Alberta L. W. GOLD
Division o f Building Research, hlational Research Council, Ottawa
ABSTRACT
It is often assumed in calculations of maxi- mum ice pressures against structures that the crushing strength of ice is 400 psi. A model study was undertaken to determine if ice could sustain this stress when loaded in a manner si-
t milar to that which would be associated with
piers. Columnar-grained ice blocks about 5 in. thick and 24 in. in diameter, with the long direc- tion of the grain perpendicular to the face of the block, were used in the study. The load si- mulating the pier situation was applied to the edge of the block perpendicular to the long di- rection of the columns. It was observed that, with this geometry of loading, ice could sustain a stress of 400 psi for periods exceeding two days without failing.
It is usually assumed by engineers when cal- culating the force that ice will exert against a structure, that the crushing strength of ice is 400 psi (Brown, 1926). This figure has been ob- tained from observations on the strength of ice when loaded in simple compression. In most field situations, the ice is subjected to biaxial or tri- axial stresses. Little information is available on the deformation behaviour of ice for these stress conditions. The experiment reported in this paper was designed to provide information on the be- haviour of ice composed of columnar crystals, such as occur when still water is frozen from the surface downward, when subjected to biaxial load- ing similar to that which occurs about piles or bridge piers. In particular, it was desired to determine if ice could sustain a stress of 400 psi under this type of loading.
On prend souvent pour acquis, au cours du calcul des pressions maximales des glaces contre un ouvrage, que la glace a une resistance i 1'6- crasement atteignant 400 liv./po.' (28 kgf/ cm2). Les auteurs ont entrepris une etude sur mo- dkles en ,vue de dkterminer si la glace pou- vait rksister i cette pression appliquCe en simulant la prCsence de piles de pont. 11s uti- liskrent pour leurs mesures des blocs de glace 2 structure colonnaire de 5 po. (12,5 cm) d'Cpais- seur et de 24 po. (60 cm) de diamktre, le long axe des colonnes Ctant perpendiculaire aux faces planes du bloc. La charge simulant la prCsence d'une pile Ctait appliquee
i
I'ar&te du bloc per- pendiculaire au long axe des colomes. Les au- teurs ont observC qu'avec cette disposition la glace pouvait resister sans s'icraser i une charge de 400 liv./po.' (28 kgf/cm" pendant plus de deux jours.Brown ( 1926) and Gold ( 1960) have observ- ed in uniaxial compression tests on columnar- grain ice, with the load applied perpendicular to the long direction of the columns, that internal cracks form when the stress exceeds about 80 psi. When the load exceeds about 170 psi, inter- nal crack formation causes a relatively rapid breakdown in structure and associated loss of ability to resist the load. Breakdown of structure in this case is a direct consequence of plastic de- formation, which in turn is determined primarily by the shear stress acting on the slip planes of individual grains. If the ice immediately adjacent to the area where the load is applied is kept from deforming by the surrounding ice, the maximum shear stress developed will be smaller than that in the uniaxial compression test for the same applied stress. As a result, there will be less
tendency for internal cracks to form as they do in the unconfined compression test, and the ice will be able to sustain a higher load before it fails by crushing. As the dependence of de- formation of ice on stress is not known for the biaxial stress condition, it is not possible to take the results of uniaxial strength tests and use them with confidence for calculating the force that ice can exert against structures.
EXPERIMENTAL PROCEDURE
Ice used in the experiments was produced in a 26-in diameter tank in a cold room maintain- ed at 15"
*
0.5"F. The tank had an air-filled slack diaphragm-type pressure cell vented to the bottom of a column of glycol to maintain constant static pressure beneath the ice surface during freezing. Tap water was de-aerated, placed in the tank and cooled to 32°F. Freezing was ini- tiated by spreading fine crushed ice over the surface. This technique produced columnar- grained ice with average diameter perpendicular to the long direction of the columns between 0.05 to 0.32 in. The cross-sectional area of some grains increased in the direction of freezing because of a tendency for those grains to grow more readily than neighbouring grains.When the ice had attained a thickness of about 7 in. it was removed and frozen on its edge to a 1- by 6- by 12- in. steel plate. The block was then machined to a thickness of bet- ween 3.75 to 5.8 in., with approximately equal amounts being removed from each face. Some of the blocks were left circular (about 25 in. in diameter), and a hole very slightly greater than 2 in. in diameter drilled at the centre. The other blocks were machined so as to be about 18 in. long and 12 in. high. Successively finer grades of emery paper and finally soft leather were used to polish the faces of the blocks. The sur- faces of the blocks were wetted with kerosene and plastic film about 1 mil thick applied to prevent sublimation.
Figure I is a sketch of the loading apparatus. For the circular blocks, the load was applied to each end of a 2-in. diameter steel pin placed in the hole drilled in the centre. For the rectangular blocl;~, it was applied through a ball and cone to the centre of a 2-in-square steel pin placed at the centre of the 18-in, edge and perpendi- cular to the 12- by 18-in. face. The long di- rection of the columnar grains was perpendicu-
lar to the face of the specimens and parallel to the loading pins.
P o s l r l o n o i C I R C U L A R 04
R E C T A N G U L A R I C E B L O C K
Fig. 1. Loading Apparatus.
The loads were applied with an Amsler Hy- draulic Jack Plant Type 791 capable of maint- aining a preset load. In all tests except block 2, the frame weight, amounting to 12.5 psi, was applied a few minutes prior to the full load. It took about 2 minutes to apply the full load. The deflection of the pin relative to the steel base was measured with 0.001 dial gauges located on either side of the blocks.
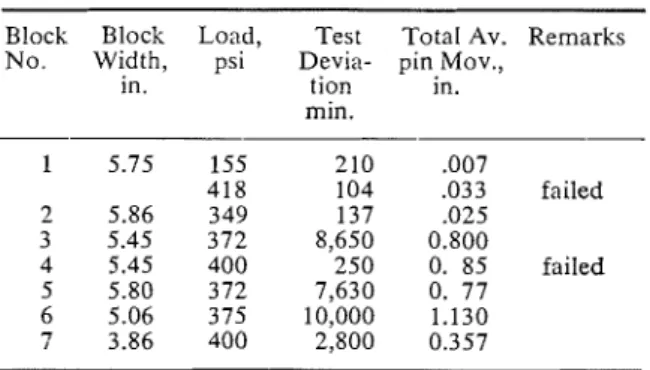
Seven tests were carried out, five on circular blocks and two on rectangular blocks. The width of the blocks, loads, duration of the test, and average total movement of the pin relative to the bottom of the specimen are listed in Table I.
Table I
Information concerning model pier tests. Blocks 1-5, cylindrical loading pin; blocks 6 and 7, rectangular loading pin.
Block Block Load, Test Total Av. Remarks No. Width, psi Devia- pin Mov.,
in. tion in.
min. 1 5.75 155 210 .007 418 104 ,033 failed 2 5.86 349 137 .025 3 5.45 372 8,650 0.800 4 5.45 400 250 0. 85 failed -- --
For the circular blocks, the loads given are the nominal stresses obtained by dividing the applied load by the projected area of contact of the pin. All tests were conducted at a temperature of
Attempts were made to measure the strain field with electrical resistance gauges frozen to the ice and with reed-type gauges. The reed-type gauges were thin metal strips with electrical re- sistance strain gauges attached, arched between metal pins embedded in the ice. These attempts were unsuccessful because of the relative motion between individual grains. Resistance gauges, 1 in. long, frozen to the ice indicated strains up to four times the actual average, while the reed gauges with a 2-in. gauge length were in error by as much as 10 per cent. It was found that the strain field could be determined at least approxi- mately by photographing a grid scribed on one face of the specimens. The lines were partially filled with optical black.
Grain size of the deformed ice was observed using thin sections cut parallel and perpendicular to the long direction of the grains. The sections cut from the ice were frozen to a glass plate. They were then cut witth a band saw so that about 3/64 in. of ice remained on the glass. After smoothing their surface with a "warm plate", the thin sections were placed between crossed polaroids and photographed.
RESULTS
The observed motion during the first 250 mi- nutes, (i.e. the movement of the steel pin relative to the base of the specimen), and the calculated rate of movement are shown in Figures 2 and 3
Fig. 2. Movement and Kate of Movement of Loading Pin During First 2 5 0 Minutes of Test for Blocks 1, 2,
3 , 4 and 5.
l l h l l . M I H
Fig. 3 . Movement and Rate of Movement of Loading Pin During First 2 5 0 Minutes of Test for Blocks 6 and 7.
for all specimens. The initial elastic deformation has been deducted. For all cases, the rate of mo- vement decreased rapidly in the first 30 minutes, and more slowly thereafter. A constant rate of penetration was not observed for any one of the tests. In Figure 4, the movement and rate of movement are shown for the full duration of the tests for blocks, 5 , 6, and 7. The rate of move- ment one hour after the application of the load is plotted against the stress in Figure 5.
. 0 1 I I , I < , , , I I I
/ / / I
100 200 100 1000 5000
l l h l t . M I H
Fig. 4. Movement and Rate of Movement of Loading Pin for Tests 5 , 6 and 7 . Initial Elastic Deflection has
been Deducted.
O C I R C U L A R B L O C K S R t C l A H G U L A R B L O C K S
Fig. 5. Average Rate of Movement of Loading Pin One Hour After Application of Load.
During each test, the dial gauges mounted on either side of the specimen moved at different rates. It was considered that this might be due to 'the increase in grain size from one side of the specimen to the other. F o r tests 3 and 5, and 6 and 7, conditions were identical except that the direction of crystal growth was reversed with respect to the apparatus. In each case, the coarse grain side had the smaller rate of movement ini- tially. This would be expected because of the usually observed dependence of creep rate on grain size. The change with time in the difference between the movements measured on either side of a block, however, indicated that the loading was not absolutely uniform. The maximum slope
of the pin that developed because of the diffe- rence in movement did not exceed 1 in 30. In the figures the average of the two dial gauges is plotted.
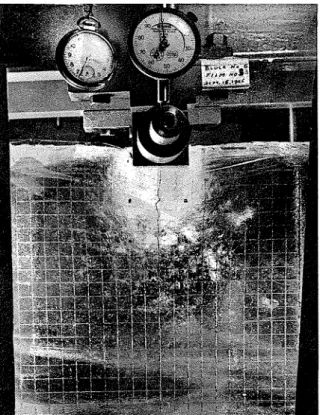
In none of the tests did failure occur by crush- ing of the ice. Failure of bloclis 1 and 4 occurred when cracks extended almost instantaneously from the base to the top. For nominal stresses greater than 349 psi for the circular blocks, and for both of the rectangular blocks, internal cracks were observed to form in the ice during the course of the test. Cracking within individual grains began at points roughly 2 in. below the steel pin and up to 2 in. on either side of the centre line. The first cracks to form were appro- ximately parallel to the estimated direction of the principal elastic stress at the site, with the plane of the crack directed toward the pin. The cracks were long and narrow, usually confined to one or two grains and with their long direction parallel to the long direction of the columnar grains. Cracking occurred at a more or less uni- form rate, at first relativelv close to the pin. and A ,
later further away. The general nature of the Fig. 6b. Deformation of Block 6, 7575 Minutes After
Application of Load. Note Distortion of Grid and
cracking behaviour of block No. 6 is shown in Region of Severe Crack Formation.
Figures 6 ( a ) and ( b ) . No cracks were observed to form in the test at 155 psi.
The formation of radial cracks extending out- ward from the hole at an angle between 45 to 120" to the vertical was a feature for all tests on circular blocks for stress greater than 349 psi. The cracks formed either during loading or imme- diately thereafter. For the rectangular blocks, cracks formed at the edges of the loading pin shortly after the load was applied, and extended inward at an angle of about 30" to the vertical. (Figure 6 ( a ) ) .
The formation of cracks parallel to the long direction of the grains was accompanied by the formation of cracks approximately perpendicular to that direction as well. These cracks were fairly large and appeared to extend over more than one grain.
Thin sections prepared within one hour after the removal of the load showed that the columnar grains had recrystallized during the deformation into a relatively fine grain granular texture. For the rectangular blocks, the boundaries of this recrystallized region were roughly circular, and corresponded to the region of maximum shear and to the boundaries of maximum shear stress
Fig. 6a Crack Pattern in Block 6 About 130 Minutes
After Application of Load of 375 psi. Lines Drawn on as predicted from plastic theory (Nadai, 193 1 ). Face of Block are at % in. Spacing. The grains surrounding the highly recrystallized
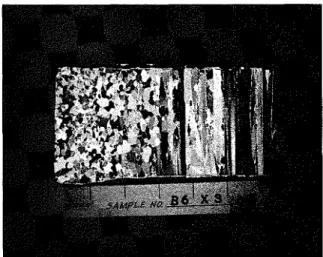
region show marked "banding" which is indica- tive of i c e grains deformed by shear. This effect and the general shape of the recrystallized zone, is shown in Figure 7a for test No. 6. The 1.13- in. indentation is due to the penetration of the loading pin. In Figure 7b is shown a section of
about one-half the block under the loading pin and perpendicular to the 12-by 18-in. face. The break-up of the columnar grains immediately beneath the area of application of the load can be clearly seen, as well as the bulging that oc- curred beneath the pin due to deformation in the long direction of the columns. Note that this bulging is associated primarily with the region where the columnar grains have recrystallized.
Fig. 7a. Thin Section of Block 6 Cut Parallel to Face of Block. Note the Zone of Recrystallization Imme- diately Beneath the Area of Application of the Load and the Band Features in Grains Outside the Recry-
stallized Zone.
Fig. 7b. Thin Section of Block 6 Cut 'Perpendicular to the Area of Application of the Load and the Face of the Block. Note the Break-up of the Columnar-Grain Structure that has Occurred Beneath the Area of
Application of the Load.
In Figure 6b can be seen the distortion that developed in the grid ruled onto specimen No. 6. The very irregular shape developed by the lines scribed onto the ice is due to non-uniform deformation. The highly cracked region occurs in the area of maximum distortion or shear strain.
DISCUSSION O F RESULTS
The tests indicate that ice, when suitably cons- trained, can sustain a stress of 400 psi for ap- preciable periods. There is justification in assum- ing that this result is also valid for larger-scale situations encountered in the field. The colum- nar-grain ice recrystallized during deformation and the granular structure that resulted had an average grain size considerably smaller than the dimensions of the area of the load. As the shape of the recrystallized zone was approximately as would be predicted from plastic theory, assuming ice to be isotropic with uniform properties, the response of ice to load for larger areas of load- ing and similar biaxial stress situations should be much the same as for the smaller scale tests.
Each grain of ice has one plane of easy slip, known as the basal plane. Earlier studies (Gold, 1960) have indicated that for uniaxial stress conditions columnar-grain ice fails due to forma- tion of internal cracks before the stress can be raised sufficiently high to cause significant plastic flow on non-basal planes. It would appear that, in the present tests, because of the biaxial stress condition, it was possible for the shear stress to be increased to the point where it caused appre- ciable slip on non-basal planes before failure occurred, as indicated by the thickening of the block under the load. Formation of cracks per- pendicular to the long direction of the grains is further evidence of this. If this suggestion is correct, the results shown in Figure 5 indicate that slip on non-basal planes becomes significant when the stress exceeds about 325 psi, and that the stress required to cause plastic flow to occur at a given rate on these planes is a major factor in determining the yield strength of columnar- grain ice in biaxial and triaxial stress situations.
CONCLUSIONS
1. When a columnar-grain ice plate subjected to a biaxial stress normal to the edge of the plate and the long direction of the grains 129
is suitably constrained, it is able to sustain a load of 400 psi for appreciable periods. 2. As the ice immediately under the load re-
crystallized into a granular texture with grain size considerably smaller than the dimen- sions of the load area, and as the shape of the resulting recrystallized zone had appro- ximately the same shape as would be pre- dicted from plastic theory, the results of the tests are probably valid for larger-scale field situations.
3. The marked increase in plastic strain rate with stress when the maximum principal stress exceeds about 325 psi, and flow pa- rallel to the long direction of the columns, indicates that plastic flow on non-basal pla- nes may determine the yield strength of columnar-grain ice under biaxial stress con- ditions.
ACKNOWLEDGEMENTS
The authors are indebted to Mr. W. Ubbink for his assistance in setting up the apparatus and carrying out the observations. This paper is a contribution from the Division of Building Re- search, National Research Council, Canada, and is published with the approval of the Director of the Division.
REFERENCES
Brown, E. (1926). Experiments on the Strength of Ice. St. Lawrence Waterway Project, Report of Joint Board of Engineers, Ap- pendix F. p. 423-453, Ottawa.
Gold, L. W. (1960) Cracking Activity in Ice During Creep, Can. J. Phys., Vol. 38, No. 9, p. 1137-1 148.
Nadai, A. (1931 ) Plasticity. McGraw Hill, New Yorlr, p. 247.