INTERNATIONAL CONFERENCE ON ENGINEERING DESIGN, ICED’07
28 - 31 AUGUST 2007, CITE DES SCIENCES ET DE L'INDUSTRIE, PARIS, FRANCE
ASSESSING INFORMATION WASTE IN LEAN
PRODUCT DEVELOPMENT
Martin Graebsch1, Warren P. Seering2 and Udo Lindemann1
1Technische Universität München
2Massachusetts Institute of Technology
ABSTRACT
Lean Product Development seeks to enhance the efficiency of product development projects by reducing and eliminating non-value-adding activities or waste, which can exist on every process level. The value stream through product development processes is a flow of information, and hence waste exists in interpersonal communication.
The study elaborates the hypothesis that most information transfers do not add value to the product. It was further theorized that different means of communication are better suited for different kinds of information, at least from the lean point of view.
In order to understand the occurrence and ramifications of waste in product development information flows, the information transferred between team members was analyzed in two student product development projects. With the help of a paper-based value stream map, frequencies of waste drivers in information, the share of waste in information transfers, the interdependencies of waste and means of communication, as well as timeliness of information transfers were analyzed.
The study’s results show that waste is omnipresent in product development information transfers, as only twelve percent of all information transfers contribute value to the product, and nearly half of the information transfers could have been omitted without a decrease in product value. Assuming that preparing, sending, receiving and retrieving information accounts for most of the time spent in product development processes, an enormous theoretical potential for efficiency enhancements could thus be identified.
Keywords: Lean Product Development, Waste, Value Stream Mapping, Information Transfer
1 INTRODUCTION
Product development processes create value by generating information. Information needs to be transferred, which can result in waste. This study analyzed information transfers according to waste drivers and means of communication.
In manufacturing, Lean Thinking has proven to yield positive results concerning efficiency and reduction of overall process time [1]. Transferring the lean principles to product development processes is expected to have positive effects on process efficiency and value creation [2, 3, 4, 5]. One of the substantial hindrances for waste reduction is the lacking transparency of information flows [6], which represent the value stream in product development. Value Stream Mapping (VSM) is a promising approach towards better process transparency in product development [7]. Currently applied VSM tools help experienced users to identify waste; they are however far from being intuitive software solutions [8, 9]. Millard [10] has discussed information and value in the context of a transitive model from data through information and knowledge phases to wisdom, and deduces seven categories of information waste. However, the model lacks a processional explanation of information generation and does not take into account the recipient and user of information. Strong has described problems in information transfers [11], and Bauch [6] has contributed a compiled and expanded list of waste drivers in product development.
For understanding waste in information processing in product development better, and to further devise product development VSM tools, it is necessary to gain knowledge about actual frequencies of the numerous waste drivers that abound in theory, and to understand the way they are fostered by using certain means of communication.
2 APPROACH AND METHODOLOGY
2.1 Objectives
The study was conducted to answer two central research questions: Which types of waste drivers are most frequent in information transfers? Furthermore, are waste drivers fostered by certain means of communication? This study seeks to answer these questions, in order to focus further research and to implement lean development more easily into industrial settings. Thereupon, suggestions might be deduced about which means of communication perform best under specific circumstances, in order to minimize communication waste.
2.2 Types of Information
Defining the term “information” is a difficult task, as there are many different views on information (e.g. in physics, social sciences and information sciences). In this study, only information with the following specific qualities is observed and analyzed:
Information related to both processes and products is analyzed. Slack [12] defined four information value streams in product development; product, project, process and business type information. However, the distinction between project, process and business type information is not sufficiently sharp, e.g. project and process type information overlap. Therefore, two types of information are defined for this study: process and product type information. Process type information is intended to inform someone about the context of the development, and product type information is intended to inform someone about the product to be developed.
Additionally, it has to be taken into account that a single piece of information can serve many purposes at the same time, and belong to different categories from the recipients’ points of view. Information that has no developmental purpose, which might be called noise-type information, is omitted. Spam and personal mails are examples for this.
Information can be discussed in models of derivation. Ahmed et al. [13] have presented a concept of data, information and knowledge which explains the transition between these stages. Furthermore, it takes into account the user of information, who differentiates between data or information in the awareness stage, and between information and knowledge in the
interpretation stage. In this study, all stages are taken into account. Waste can be expected when the recipient is not aware of the context, or cannot interpret the information at hand.
The study takes into account only the social sciences point of view of information in processes. Information is neither analyzed from the point of view of information sciences (e.g. data processing) nor from the perspective of engineering (e.g. signals and commands in technical products).
2.3 Information Transfers
Information transfers are defined as the volitional act of sending one or more pieces of information from one process participant (e.g. student) to another across defined tasks within the product development project. This definition does not include receiving information, as a piece of information could potentially never reach the intended recipient, and it does not include information transfers within tasks. Feedback-loops within tasks are expected to be very short, at least in student projects where the students commonly work together on site. Additionally, tracking this type of information transfers, which would be conversation mainly, requires a different setting and focus. Information transfers out of and into the project team, e.g. from and to experts or other projects, hasn’t been tracked either but would be very interesting to analyze in industrial settings. At these processional interfaces, content and temporal synchronization can be expected to be difficult, and thus waste might be identified.
2.4 Categories of Waste Drivers
Each piece of information and its transfer was screened for waste drivers. The categories used in this study were derived from Bauch’s [6] exhaustive list of waste drivers in product development which is a compilation of waste drivers others have identified and theorized. It was modified in that the waste driver “deficient information quality” was used in this context to solely describe the quality of the information itself, not its transfer. To take into account different causes for deficient information quality, the latter was supplemented by several additional waste drivers including timeliness,
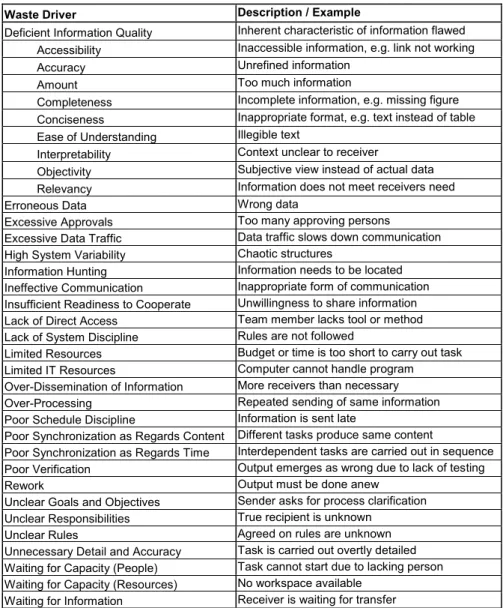
completeness, accessibility, and media usefulness. A similar view on information waste drivers can be found in [11]. In Table 1, a list of waste drivers provides a complete overview on the categories used in the study.
Table 1: List of Waste Drivers in Product Development
Waste Driver Description / Example
Deficient Information Quality Inherent characteristic of information flawed Accessibility Inaccessible information, e.g. link not working Accuracy Unrefined information
Amount Too much information
Completeness Incomplete information, e.g. missing figure Conciseness Inappropriate format, e.g. text instead of table Ease of Understanding Illegible text
Interpretability Context unclear to receiver
Objectivity Subjective view instead of actual data Relevancy Information does not meet receivers need Erroneous Data Wrong data
Excessive Approvals Too many approving persons
Excessive Data Traffic Data traffic slows down communication High System Variability Chaotic structures
Information Hunting Information needs to be located Ineffective Communication Inappropriate form of communication Insufficient Readiness to Cooperate Unwillingness to share information Lack of Direct Access Team member lacks tool or method Lack of System Discipline Rules are not followed
Limited Resources Budget or time is too short to carry out task Limited IT Resources Computer cannot handle program Over-Dissemination of Information More receivers than necessary Over-Processing Repeated sending of same information Poor Schedule Discipline Information is sent late
Poor Synchronization as Regards Content Different tasks produce same content
Poor Synchronization as Regards Time Interdependent tasks are carried out in sequence Poor Verification Output emerges as wrong due to lack of testing Rework Output must be done anew
Unclear Goals and Objectives Sender asks for process clarification Unclear Responsibilities True recipient is unknown
Unclear Rules Agreed on rules are unknown Unnecessary Detail and Accuracy Task is carried out overtly detailed Waiting for Capacity (People) Task cannot start due to lacking person Waiting for Capacity (Resources) No workspace available
Waiting for Information Receiver is waiting for transfer
2.5 Development of a Paper-based Value Stream Map
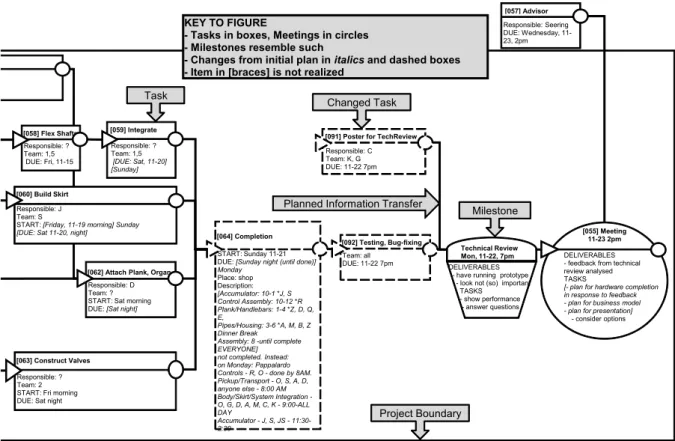
A paper-based Value Stream Map (VSM) similar to the ideas presented in [8, 9] was developed in order to identify and enumerate sub-tasks and continuous tasks, establish task dependencies and track due dates. With the VSM, all information transfers could be assigned to the enumerated sending and receiving (sub-)tasks. At the project’s beginning, a high-level VSM was drawn which contained all due dates and specified the general topic of the weekly team meetings. In each meeting, the following week was then planned in detail. To support the planning aspect of the map, each task box contains the following information: Title tag, objectives, task number, start date and time, end date and time, name of responsible person, task members, expected output. Changes from the initial plan were added retroactively during the analysis, helping to visualize delays and changes. An exemplary VSM is given in Figure 1.
A VSM printout was provided weekly to the students for planning and executing their tasks and information transfers. For the study, Excel-based documents were used in differentiating between information transfers within and across sub-tasks, and in order to track timeliness. It helped much in clarifying information transfers between concurrent tasks and responsibilities. The students referred frequently to it in order to structure their project, and for the study it proved valuable in assigning
information transfers to the tasks. Tracking changes from the initial plan proved very valuable, too. The VSM was, however, static and required some effort establishing it and keeping it up to date.
DELIVERABLES - feedback from technical review analysed TASKS
[- plan for hardware completion in response to feedback - plan for business model - plan for presentation]
- consider options [055] Meeting 11-23 2pm [057] Advisor Responsible: Seering DUE: Wednesday, 11-23, 2pm
[037] Build Pipes (Tune)
Responsible: A DUE: [Tue 11-16, 7pm] 11-22 Description:
Team: all, Advisors Date: Tue, 11-16, 2pm; Place: labs
DELIVERABLES: TASKS: State reports, plan completion until Tech Review
[085] Meeting [061] Build Pipe Mount
Responsible: DUE: Tue, 11-16, 7pm Description:
[044] Build Accumulator, Bellows
Responsible: D Team: 5
START: Wednesday, 11-17 ; DUE: [Friday, 11-19 night] Description:
Technical Review Mon, 11-22, 7pm [036] Build Control Box
Responsible: R Team: 1,5 START: Wednesday, 11-17
DUE: Thursday, 11-18, midnight
[059] Integrate
Responsible: ? Team: 1,5
[DUE: Sat, 11-20] [Sunday]
[062] Attach Plank, Organ
Responsible: D Team: ? START: Sat morning DUE: [Sat night]
[063] Construct Valves
Responsible: ? Team: 2 START: Fri morning DUE: Sat night
[064] Completion
START: Sunday 11-21 DUE: [Sunday night (until done)] Monday Place: shop Description: [Accumulator: 10-1 *J, S Control Assembly: 10-12 *R Plank/Handlebars: 1-4 *Z, D, Q, E, Pipes/Housing: 3-6 *A, M, B, Z Dinner Break
Assembly: 8 -until complete EVERYONE] not completed. Instead: on Monday: Pappalardo Controls - R, O - done by 8AM. Pickup/Transport - O, S, A, D, anyone else - 8:00 AM Body/Skirt/System Integration -O, G, D, A, M, C, K - 9:00-ALL DAY Accumulator - J, S, JS - 11:30-2:30 [060] Build Skirt Responsible: J Team: S
START: [Friday, 11-19 morning] Sunday [DUE: Sat 11-20, night]
[058] Flex Shafts
Responsible: ? Team: 1,5 DUE: Fri, 11-15
[065] Build Structure, Housing
Responsible: D Team: D, Z START: Wed, 11-17 DUE: Thu, night
[090] Get Flex Shafts
Responsible: P Ordered: Wed, 11-17 est. Rec: Sat, 11-20 Description:
[091] Poster for TechReview
Responsible: C Team: K, G DUE: 11-22 7pm [092] Testing, Bug-fixing Team: all DUE: 11-22 7pm DELIVERABLES - have running prototype
- look not (so) important TASKS - show performance
- answer questions
KEY TO FIGURE
- Tasks in boxes, Meetings in circles - Milestones resemble such
- Changes from initial plan in italics and dashed boxes - Item in [braces] is not realized
Project Boundary Task
Milestone Planned Information Transfer
Changed Task
Figure 1. Paper-based Value Stream Map (exemplary) 2.6 Setting
Two student projects were observed throughout the product development process from concept phase to prototype presentation. The teams consisted of 15, respectively 18 mechanical engineering undergraduate students, who had not experienced engineering team work before. The study took place during MIT’s 2004 course “2.009 – Product Engineering Processes”, and lasted for two months. Both teams met weekly to coordinate their actions, as suggested by [3]. One team designed a cooled backpack for transporting vaccines into remote regions; the other team designed a child’s seesaw combined with organ bellows and tonally alterable pipes.
2.7 Analysis of Information Flows
Only information transfers by emails and meetings were observed. Phone calls had to be omitted from the study for privacy regulations, which unfortunately is detrimental to the studys’ results. In order to track and observe the information transfers, emails written by team members to others were forwarded to the author. Almost all of the teams’ meetings were attended, sound recorded, and notes taken using information transfer log sheets. The log sheet contains many factors that were tracked for each transfer during the tracking phase, not all of which were later taken into account during analysis (see Figure 2). The tool was designed for the study to quickly take note of all relevant aspects, and to provide an easy means of reference later on. It proved very valuable to quickly take structured notes in meetings without having to interfere with the information transfers. The sound recordings did not provide additional information. Due to the elapsed time between recording and analysis, they were not useful for analyzing information transfers which used graphical illustrations. Video recordings would have performed better in that respect, but were unavailable. Moreover, it would have not been feasible to set up video equipment properly in spontaneous meetings.
Information Transfer Log Sheet
# : _______ TEAM (section)
planned transfer? transfer ID: [___] to [___]
date time place
sender (s): (circle responsible)
receiver (s): (circle responsible)
TYPE MEDIUM
process (describe) conversation
document ( physical electronic) presentation video other (specify) content technical presentational other (specify)
MEANS meeting (list attendants)
email (list recipients)
other (specify) CARRIER alpha-numeric graphic model other (specify) OBSERVATIONS PROBLEMS
WASTE waste drivers 1 2 3 cause
INFORMATION QUALITY
intrinsic level of detail too high too low quantified data yes no
other accessibility
contextual timeliness yes no delay (hrs:min) ___:___ completeness yes no
value enabling waste other
representational ease of understanding very good very poor media usefulness
other
Figure 2. Log Sheet for Tracking Information Transfers into Meetings
After the tracking, all 663 observed information transfers were analyzed according to several factors: 1) To each information transfer, one to three waste drivers were assigned if appropriate. This included intrinsic waste drivers (e.g. deficient information quality) as well as processional waste drivers that became apparent through the information.
2) For each piece of information, it was decided whether it contributed value to the end product. This analysis was conducted retroactively, as process value was not defined clearly at the outset of the process (e.g., the student teams did not initially agree upon which product to develop). Hence, all transfers of information that did not in any way define or help to define the properties of the final product were deemed either non-value-adding (NVA) or required non-value-adding (RNVA). For example, organizational information referring to a meeting which was required to make decisions was considered RNVA, whereas the repeated sending of the same information was considered NVA. As the decisions about value contribution were made by the author, their objectivity is somewhat limited; however, great importance was attached to assessing whether a specific information transfer’s content was represented in the end product or had defined the design process. Nevertheless, more objective results could have been obtained by discussing each value assessment with the team members.
3) The used means of communication were tracked. Only meetings and emails were observed, as stated above. However, given the fact that a piece of information can be transferred using both means of communication, these were non-exclusive categories (For example, a presentation file attached to an email was sent during a meeting, while at the same time the presentation was held).
4) It was recorded whether the transfer was previously planned or not. Planning hereby means that all team members participating in the transfer had previously agreed upon the transfer. Thereby, it could be analyzed whether planning transfers helped to decrease waste driver occurrence.
5) Slippage in schedule was recorded in cases where date and time of the transfer had been planned previously.
6) If the information transfer referred to a previous transfer, the feedback loop delay was calculated and recorded. The factors are described in more detail in the following.
3. RESULTS AND DISCUSSION
3.1 Value Contribution of Information Transfers
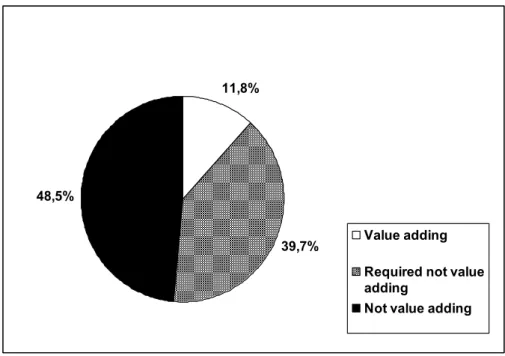
As shown in Figure 3, the analysis indicates that only 11,8 % of the information transfers contributed to the value of the end product. This might seem like a fairly low figure. Still, it is backed by similar findings of other studies [2]. Based on a questionnaire in the aerospace industry, Haggerty et al. state that only 12% of all time spent in product development contributes value to the product. Taking into account that the essential task in product development is to gather, structure, generate and disseminate information, and further that for this task most time is spent, it is taken as a strong indication that the figure’s magnitude is correct.
Nearly 50% of the information transfers are not adding value to the process. This shows a huge potential for theoretical improvement in efficiency through reduction and elimination of (information) waste. The potential for efficiency gains cannot be capitalized upon through optimizing the transfers themselves, but taking into consideration that every piece of information actually has to be produced and is received (at least noticed), it becomes apparent that there are indeed a lot of resources bound to tasks that are not requested at all. However, how much waste can possibly be reduced in practice is unknown so far, as the interdependency amongst non-value-adding activities remains unclear.
11,8%
39,7% 48,5%
Value adding Required not value adding
Not value adding
Figure 3. Value Contribution of Information Transfers (n=663) 3.2 Occurrence of Waste Drivers in Information Transfers
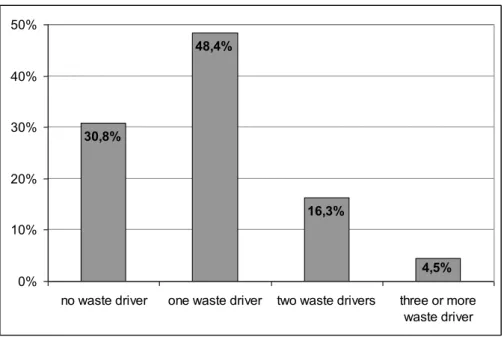
It was scrutinized which waste drivers can be assigned to each information transfer, taking into account the waste driver categories presented in section 2.3. As can be seen in Figure 4, in only less than a third of the transfers waste drivers could not be ascertained. Almost half of the information transfers had one waste driver; more than 20% had two or more waste drivers.
These findings suggest that reducing waste through elimination of information waste drivers is possible, since in many cases dealing with one waste driver alone is feasible. It seems as if there is a low correlation among waste drivers, e.g. specific waste drivers are not accompanied by other specific waste drivers in tendency. However, it has to be taken into consideration that the study did not account for what Kato [14] calls “root causes”. Root causes are reasons for waste drivers that can be found by deeply analyzing through iteratively asking “why” something is as it seems, very similar to root cause analysis in lean production. Thus, possible interdependencies and tradeoffs can not be discussed
herein. The remaining questions are: What happens if a specific waste driver was removed, and would other waste drivers emerge in its place?
30,8% 48,4% 16,3% 4,5% 0% 10% 20% 30% 40% 50%
no waste driver one waste driver two waste drivers three or more
waste driver
Figure 4. Occurrence of Waste Drivers in Information Transfers 3.3 Frequency of Waste Drivers in Information Transfers
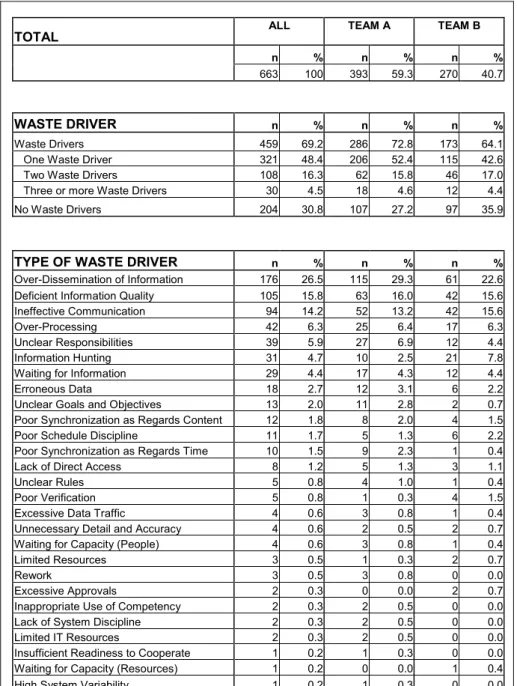
One of the central research questions was whether some types of waste drivers occur more often than others. As presented in Table 2, there are indeed considerable differences among the frequencies of waste drivers in information transfers. The categories ranking order differs only marginally between the two teams A and B; this indicates that the findings are comparable.
The most frequent waste driver is over-dissemination of information. This waste driver was observed in 26.5% of all information transfers. A very common example is the sending and forwarding of emails to people who don’t need the contained information. Others are meetings with presentation that are relevant for only part of the audience. The problem herein is the time consumed while receiving the information neither requested nor needed; and of course in the annoyance of receiving too many unsolicited information which can eventually lead to reluctantly receiving information at all.
The second largest group of waste drivers is a subset of deficient information quality, which will be discussed in the following section.
The third most observed waste driver is ineffective communication. 14% of all information transfers in the teams could have performed better without changing the information itself, planning or other preparations, just by changing the way of communication. Understanding the reasons behind ineffective communication is important to make lean product development possible [6]. The two most common reasons for ineffective communication were unstructured, ineffective meetings, and technical discussions via email. Six cases of email discussion were observed, lasting from three to twenty-eight hours. In each case, a meeting would have yielded faster agreements and caused much less handoffs, as no additional information was necessary for the tasks to proceed. However, when the need for a discussion arose, the participants were unaware of the problems and possible misunderstandings. Thus, the tendency to call for a meeting was low. Meanwhile, the technical question to be worked on was “waiting” until the decision had been made, thus constituting information waiting for people type of waste. The problem could have been avoided (or at least reduced) if the participants had felt responsible for the efficiency of discussions, and called for an immediate meeting whenever email communication had become inefficient. If within a short time span many emails with the same subject line are received, it is likely that the chosen means are inefficient and a meeting is preferable. Yet, meeting causes movement waste, and requires extra planning, both of which are not-value adding activities. These types of waste can be prevented by co-locating the team members. Spontaneous meetings then seem as a key to reduce the processional waste.
Over-processing, unclear responsibilities, information hunting and waiting for information make up for the next four most frequent waste drivers in information transfers. Over-processing is observed to
be both a management and a motivational problem. Sometimes, the senders did not realize that their information already had been available. Also, information was sent “just in case” and as a reminder that the sender was doing something. The waste driver unclear responsibilities was observed with surprisingly frequently, considering the study’s setting with a development task of limited duration and with few participants. Enhancing transparency of development processes seems thus important in order to facilitate lean improvements; yet the waste driver is expected to be less frequent in industrial settings with longer lasting projects, where team members do not change often during the project. The waste drivers information hunting and waiting for information, on the other hand, are expected to be much more frequent in larger development teams.
The remaining, less frequent waste drivers are not discussed in this paper.
Table 2. Frequency of Waste Drivers
TOTAL ALL TEAM A TEAM B
n % n % n %
663 100 393 59.3 270 40.7
WASTE DRIVER n % n % n %
Waste Drivers 459 69.2 286 72.8 173 64.1 One Waste Driver 321 48.4 206 52.4 115 42.6 Two Waste Drivers 108 16.3 62 15.8 46 17.0 Three or more Waste Drivers 30 4.5 18 4.6 12 4.4 No Waste Drivers 204 30.8 107 27.2 97 35.9
TYPE OF WASTE DRIVER n % n % n %
Over-Dissemination of Information 176 26.5 115 29.3 61 22.6 Deficient Information Quality 105 15.8 63 16.0 42 15.6 Ineffective Communication 94 14.2 52 13.2 42 15.6 Over-Processing 42 6.3 25 6.4 17 6.3 Unclear Responsibilities 39 5.9 27 6.9 12 4.4 Information Hunting 31 4.7 10 2.5 21 7.8 Waiting for Information 29 4.4 17 4.3 12 4.4 Erroneous Data 18 2.7 12 3.1 6 2.2 Unclear Goals and Objectives 13 2.0 11 2.8 2 0.7 Poor Synchronization as Regards Content 12 1.8 8 2.0 4 1.5 Poor Schedule Discipline 11 1.7 5 1.3 6 2.2 Poor Synchronization as Regards Time 10 1.5 9 2.3 1 0.4 Lack of Direct Access 8 1.2 5 1.3 3 1.1 Unclear Rules 5 0.8 4 1.0 1 0.4 Poor Verification 5 0.8 1 0.3 4 1.5 Excessive Data Traffic 4 0.6 3 0.8 1 0.4 Unnecessary Detail and Accuracy 4 0.6 2 0.5 2 0.7 Waiting for Capacity (People) 4 0.6 3 0.8 1 0.4 Limited Resources 3 0.5 1 0.3 2 0.7 Rework 3 0.5 3 0.8 0 0.0 Excessive Approvals 2 0.3 0 0.0 2 0.7 Inappropriate Use of Competency 2 0.3 2 0.5 0 0.0 Lack of System Discipline 2 0.3 2 0.5 0 0.0 Limited IT Resources 2 0.3 2 0.5 0 0.0 Insufficient Readiness to Cooperate 1 0.2 1 0.3 0 0.0 Waiting for Capacity (Resources) 1 0.2 0 0.0 1 0.4 High System Variability 1 0.2 1 0.3 0 0.0
3.4 Deficient Information Quality
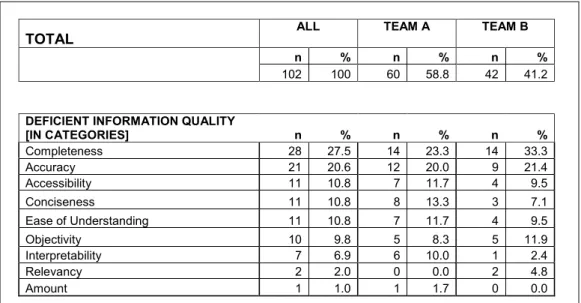
Roughly one out of six transferred pieces of information showed qualitative deficiencies, which makes deficient information quality the second most frequent waste driver. The problems that stem from deficient information quality are potentially grave, since every single deficient piece of information can cause errors, misunderstandings, and almost certainly a form of rework. Moreover, deficient
information quality was identified by [6] as a critical waste driver, i.e. it is mutually interdependent with many other waste drivers and thus difficult to reduce. Deficient information quality thus constitutes a major challenge to lean product development. Table 3 shows the frequency of the different qualitative deficiencies throughout the study as well as in comparison of the two observed teams. For the two most frequent deficiencies, the ranking by teams was the same, but differed for the other deficiencies. However, the total count of these deficiencies is too low to allow for conclusions. The most frequent deficiency was incomplete information – e.g. the time for a meeting was given but not the place, or specifications lacked essential information about weight or cost. It was observed exclusively in email transfers, as in meetings recipients have the possibility to inquire. In case of long feedback loops, this could lead to significant delay, especially if the original sender was later not available for further clarification. Yet, this specific deficiency can generally be avoided by crosschecking or by using standardized forms.
The second most frequent deficiency was inaccuracy, meaning that information is not tailored to the users needs and has thus to be extracted from rather large documents. This particular waste driver becomes problematic if many recipients exist – the relevant information then has to be extracted by each one, multiplying the required time by the number of recipients. The lean principle “Pull” offers the general solution to this type of waste driver: The recipient should be the one to define the information’s content; however, applying the principle to actual processes requires the participants’ comprehension.
The remaining, less frequent information deficiencies are not discussed in this paper. For an extended discussion, see [15].
Table 3. Frequencies of Deficient Information Qualities
TOTAL ALL TEAM A TEAM B
n % n % n %
102 100 60 58.8 42 41.2
DEFICIENT INFORMATION QUALITY
[IN CATEGORIES] n % n % n % Completeness 28 27.5 14 23.3 14 33.3 Accuracy 21 20.6 12 20.0 9 21.4 Accessibility 11 10.8 7 11.7 4 9.5 Conciseness 11 10.8 8 13.3 3 7.1 Ease of Understanding 11 10.8 7 11.7 4 9.5 Objectivity 10 9.8 5 8.3 5 11.9 Interpretability 7 6.9 6 10.0 1 2.4 Relevancy 2 2.0 0 0.0 2 4.8 Amount 1 1.0 1 1.7 0 0.0
3.5 Planning and Waste Drivers
In Figure 5, all information transfers are assorted according to planning. Planning means that both sender and recipient previously agreed upon the transfer. Planned information transfers appear to show much less waste drivers than unplanned transfers: 47% of planned information transfers could not be assigned to a waste driver at all, in contrast to 27% of unplanned transfers. This indicates that planning information transfers is a suitable method to reduce waste drivers. However, the task “planning” does not contribute value to the end customer; it is a required not-value adding (RNVA) activity at best. In the end, whether to plan or not remains a trade-off decision between expected waste reduction and additional RNVA. Moreover, not all transfers can be planned, as a demand for information transfer can arise unexpectedly.
47,2% 36,0% 14,4% 27,1% 50,9% 16,9% 5,1% 2,4% 0,0% 10,0% 20,0% 30,0% 40,0% 50,0% 60,0%
no waste drivers one waste driver two waste drivers three or more waste drivers planned unplanned
Figure 5. Occurrence of Waste Drivers in Information Transfers by Planning 3.6 Means of Communication and Waste Drivers
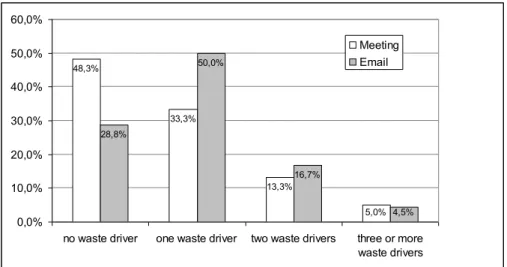
In Figure 6, all information transfers are assorted according to the used means of communication. Information transfers in meetings show much less waste drivers than by emails; nearly half of the transfers in meetings showed no waste driver, in contrast to 28.8% of emails. At first sight, this suggests transferring information via meeting was better than via emails. However, it has to be taken into account that meetings require movement, planning and a meeting room – all of which can be seen as resources spent not directly for value contribution, as discussed in section 3.3.
The frequencies of the respective waste drivers do not differ considerably between transfers via emails and meetings, and show a similar ranking order. Over-dissemination and over-processing, however, constitute an exception to this. Many emails are sent “just in case”, while the observed meetings generally do not convey information that is not needed by the recipients.
48,3% 33,3% 13,3% 5,0% 28,8% 50,0% 16,7% 4,5% 0,0% 10,0% 20,0% 30,0% 40,0% 50,0% 60,0%
no waste driver one waste driver two waste drivers three or more waste drivers
Meeting Email
Figure 6. Occurrence of Waste Drivers in Information Transfers by Means of Communication 3.7 Interdependency of Planning and Means of Communication
As expected, planned meetings perform very well in respect to waste drivers. Out of 56 planned information transfers in meetings, 26 show no waste driver. Surprisingly, planned emails perform even a little better in that respect. Only in 31 out of 61 information transfers by planned emails, waste drivers were observed. It can only be speculated upon the reasons to this. Maybe planning creates a sense of accountability that leads to enhanced advertence.
The great majority of all observed information transfers (527 of 663) were unplanned emails, and they perform worst with respect to the occurrence of waste drivers. Only slightly more than a quarter of the unplanned email transfers show no waste driver. Unplanned information transfers by email thus emerge as the driving factor for waste in information processing in product development.
4 DISCUSSION
4.1 Reducing Waste in Communication
The large number of over-processed emails, the required time and resources for a meeting, and the resulting movement type waste do not allow for generally preferring (planned) meetings over emails. The following conclusions are drawn from the field study as basic recommendations for lean communication in product development.
Information transfers should be planned, if possible. This reduces information hunting and waiting for information, at the same time promoting a better schedule performance.
Whenever an information transfer is not unidirectional, the feedback loops should be kept as short as possible. This is best facilitated by meetings, theoretically by phone calls as well. Team members should be aware of the potentially long feedback loops of emails (mean value
observed in the study was 2 hours and 47 minutes, which is expected to be much higher in industrial settings).
In unidirectional information transfers, if the sender has a clear conception of recipient’s need for information, planned emails are to prefer due to much less movement type waste.
Despite the better performance of planned transfers, unplanned pull of information should be encouraged if directed to a single, responsible person.
In order to decrease waste in information processing, all team members should be aware of the recipients need for information, e.g. when, how and in what level of detail the information is needed.
4.2 Industry is Different
Prior to applying the findings to industrial settings, several differences between industry and university have to be taken into account. Herein, some assumptions are made that have to be verified in other studies.
Firstly, industrial engineers may have gained implicit knowledge about the pros and cons of certain means of communication and act accordingly. In tendency, information waste can be expected to be reduced by experience.
Secondly, development teams and projects tend to be much bigger, with more people involved. The number of theoretically available communication channels rises exponentially with the number of involved team members. Hence, more communication needs to take place resulting in more opportunities for waste.
Thirdly, industrial projects tend to take (much) more time. In automotive engineering, projects may take up to five years. Hence, information may be retrieved that has been stored much earlier, and specific information may wait much longer for others to continue working on it. Kato [14] has shown that the longer information is not used, the more resources have to be spent in order to fully retrieve and restore it. He found a rate of 6 percent loss of information content per month.
Fourthly, industrial settings commonly have a hierarchical structure. Thus stems the possibility to use absent and/or present information for political goals – information is held back in order to secure a position or budget, subjective discussions abound, and even false information may be transferred. The quality of information is likely to decrease in such settings.
Fifthly, depending on the organizational structure of the company, an engineer typically has to work on several projects simultaneously. This severely restricts him or her in continuously creating (information) value in a given project, especially, if the direct workflow partners differ throughout the projects. Typically, information waits for transferral and further value addition in these settings, and thus the waste driver “information waiting for people” is expected to be much more frequent.
Sixthly, products and projects alike are much more complex in industry, which leads to substantially less transparency. In order to facilitate division of labor, much more process information is required. In conclusion, information waste is expected to be much higher in industrial product development processes. Notwithstanding higher experience, industrial projects are characterized by higher complexity, larger time spans, more involved people, hierarchy and multi-project situations, which all decrease information quality and/or raise the need for process information. It remains unclear in how far these factors are interdependent.
4.3 Outlook
Unplanned (e.g. spontaneous) meetings showed the least share of waste drivers in information transfers. However, since the total number of observed unplanned meetings was much too low to allow for conclusions, further research is necessary to verify this and hypothesize upon.
Alike, phone calls could not be taken into account due to the study’s setting and privacy regulations. Comparing the frequency of waste drivers in information transfers via phone calls to other means of communication may help to decide which means are best suited for a given situation.
It was observed that asking specific questions – in contrast to taking assumptions for granted – helped a lot in overcoming difficulties in information transfers. Ascertaining a “question rate”, and whether the question rate might be an indicator for lean development, might prove to be interesting.
The biggest methodological obstacle for studying the tradeoffs of reducing specific information waste drivers is the lack of a reliable metric for lean communication. Once established, solid waste-reducing strategies for improving overall process performance could then be ascertained.
REFERENCES
[1] Womack, J.P., Jones, D.T. Lean Thinking - Banish Waste and create wealth in your
corporation, 2003 (Simon & Schuster, London, UK)
[2] McManus, H., Haggerty, A., Murmann, E. Lean Engineering: Doing the Right Thing Right.
Proceedings of the 1st International Conference on Innovation and Integration in Aerospace Sciences, CEIAT, Queen’s University Belfast, 2005
[3] Oppenheim, B. W. Lean Product Development Flow, Systems Engineering, Vol.7, No.4., 2004,
pp 352-376.
[4] McManus, H.L. Outputs of the Summer 1999 Workshop on Flow and Pull in Product
Development. The Lean Aerospace Initiative Working Paper Series WP00-01, January. Lean Aerospace Initiative, Cambridge, MA, 2000
[5] Murmann, Earll M. (Ed.) Lean Enterprise Value, 2002 (Palgrave, New York)
[6] Bauch, C. Lean Product Development enabling display: Making Waste Transparent. Diploma
thesis, Massachusetts Institute of Technology and Technical University Munich, 2004
[7] McManus, H. and Millard, R. L. Value Stream Analysis and Mapping for Product Development.
Proceedings of the International Council of the Aeronautical Sciences 2002
[8] Morgan, J.M. High Performance Product Development: A Systems approach to a Lean Product
Development Process, dissertation, University of Michigan, 2002.
[9] Whitaker, R.B. Value Stream Mapping and Earned Value Management: Two Perspectives on
Value in Product Development. Master thesis, Massachusetts Institute of Technology, 2005 [10] Millard, R.L. Value Stream Analysis and Mapping for Product Development. Master thesis,
Massachusetts Institute of Technology, 2001
[11] Strong, D.M., Lee, Y.W., Wang, R.Y. 10 Potholes in the Road to Information Quality. Computer 30 (1997) 8, pp. 38-46
[12] Slack, R.A. The Application of Lean Principles to the Military Aerospace Product Development Process. Master thesis, Massachusetts Institute of Technology, 1999
[13] Ahmed, S., Blessing, L. and Wallace, K. The relationship between data, information and knowledge based on a preliminary study of engineering designers. Proceedings of the ASME Design Theory and Methodology Conference, Las Vegas 1999
[14] Kato, J., Development of a Process for Continuous Creation of Lean Value in Product Development Organizations. Master thesis, Massachusetts Institute of Technology, 2005 [15] Graebsch, M., Information and Communication in Lean Product Development. Diploma thesis,
Massachusetts Institute of Technology and Technical University Munich, 2005
Contact: Dipl.-Ing. Martin Graebsch Technische Universität München Lehrstuhl für Produktentwicklung Boltzmannstrasse 15 85746 Garching b.M. Germany +49-(0)89-289-15132 [email protected] www.pe.mw.tum.de