Solid Earth, 2, 271–281, 2011 www.solid-earth.net/2/271/2011/ doi:10.5194/se-2-271-2011
© Author(s) 2011. CC Attribution 3.0 License.
Solid Earth
Remobilization of silicic intrusion by mafic magmas during the 2010
Eyjafjallajökull eruption
O. Sigmarsson1,2, I. Vlastelic1, R. Andreasen3, I. Bindeman4, J.-L. Devidal1, S. Moune1, J. K. Keiding5, G. Larsen2, A. Höskuldsson2, and Th. Thordarson6
1Laboratoire Magmas et Volcans, CNRS-Université Blaise Pascal-IRD, 63038 Clermont-Ferrand, France 2Institute of Earth Sciences, University of Iceland, 101 Reykjavik, Iceland
3Department of Earth Science and Engineering, Imperial College London, South Kensington Campus, London SW7 2AZ, UK 4Department of Geological Sciences, 1272 University of Oregon, Eugene, OR, USA
5GeoForschungsZentrum Potsdam, Telegrafenberg, 14473 Potsdam, Germany
6School of GeoScience, University of Edinburgh, Grant Institute, Edinburgh EH9 3JW, UK
Received: 14 June 2011 – Published in Solid Earth Discuss.: 8 July 2011
Revised: 19 October 2011 – Accepted: 29 October 2011 – Published: 2 December 2011
Abstract. Injection of basaltic magmas into silicic crustal
holding chambers and subsequent magma mingling or mix-ing is a process that has been recognised since the late sev-enties as resulting in explosive eruptions. Detailed recon-struction and assessment of the mixing process caused by such intrusion is now possible because of the exceptional time-sequence sample suite available from the tephra fallout of the 2010 summit eruption at Eyjafjallajökull volcano in South Iceland. Fallout from 14 to 19 April contains three glass types of basaltic, intermediate, and silicic composi-tions recording rapid magma mingling without homogeni-sation, involving evolved FeTi-basalt and silicic melt with composition identical to that produced by the 1821–1823 AD Eyjafjallajökull summit eruption. The time-dependent change in the magma composition suggests a binary mixing process with changing end-member compositions and pro-portions. Beginning of May, a new injection of primitive basalt was recorded by deep seismicity, appearance of Mg-rich olivine phenocrysts together with high sulphur dioxide output and presence of sulphide crystals. Thus, the com-position of the basaltic injection became more magnesian and hotter with time provoking changes in the silicic mix-ing end-member from pre-existmix-ing melt to the solid cara-pace of the magma chamber. Finally, decreasing proportions of the mafic end-member with time in the erupted mixed-magma demonstrate that injections of Mg-rich basalt was the motor of the 2010 Eyjafjallajökull explosive eruption, and
Correspondence to: O. Sigmarsson (olgeir@raunvis.hi.is)
that its decreasing inflow terminated the eruption. Signifi-cant quantity of silicic magma is thus still present in the in-terior of the volcano. Our results show that detailed sam-pling during the entire eruption was essential for deciphering the complex magmatic processes at play, i.e. the dynam-ics of the magma mingling and mixing. Finally, the rapid compositional changes in the eruptive products suggest that magma mingling occurs on a timescale of a few hours to days whereas the interval between the first detected magma injec-tion and erupinjec-tion was several months.
1 Introduction
Improved understanding of volcanic plumbing-systems is needed for better interpretations of precursors to volcanic eruptions. While deformation and seismic studies yield real-time information of physical changes beneath a vol-cano, geochemical investigation of the eruptive products al-lows identification of magma sources and quantification of magmatic processes leading to an eruption. Here, we use petrological and geochemical evidences, obtained on a pre-cisely dated sample-suite of lava and tephra from the 2010 Eyjafjallajökull eruption in south Iceland (Fig. 1), to eval-uate the triggering mechanism for the 2010 summit erup-tion and to quantify the magma differentiaerup-tion processes. We show that basaltic injection remobilized older silicic magma, causing explosive eruption of inhomogeneous mixture of mingled magma. Such mechanical magma mixing trigger-ing an eruption has been frequently inferred from mtrigger-ingled magma deposits (e.g. Sparks et al., 1977; Eichelberger, 1980;
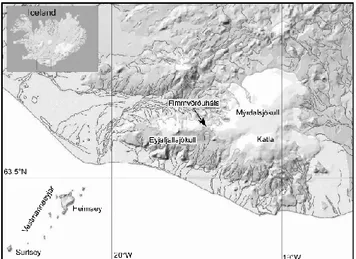
Fig. 1. Shaded relief map showing Eyjafjallajökull and Mýrdalsjökull ice-caps and the volcanic systems Vestmannaeyjar, Eyjafjallajökull and Katla. The pass between the two ice-caps, Fimmvörðuháls, was the location of the basaltic flank eruption pre-ceding the summit eruption of Eyjafjallajökull in 2010.
Nakamura, 1995; Clynne, 1999; Suzuki and Nakada, 2007; Pallister et al., 2008; Tonarini et al., 2009). Furthermore, we demonstrate how fast the composition and proportions of the mixing end-members changed, which is relevant for under-standing the dynamics of magma mixing in general.
2 The Eyjafjallajökull 2010 eruption
Over the last fifteen years, episodic seismic swarms and inflation-induced deformation have been taken to indicate sill injections at mid-crustal depth beneath Eyjafjallajökull vol-cano (Guðmundsson et al., 2010; Sigmundsson et al., 2010; Hjaltadóttir et al., 2011). A deep-sourced inflation started late December 2009, accompanied by increase in seismic-ity. Deformation and earthquake activity continued until late 20 March 2010, when a flank eruption broke out on a radial fissure at the Fimmvörðuháls Pass between Eyjafjallajökull and Mýrdalsjökull ice-caps (Fig. 1). The eruption produced a lava field and two scoria cones comprised of olivine- and plagioclase-phyric and relatively primitive mildly-alkaline basalt until 12 April (Fig. 2). This was followed by a seismic swarm that migrated rapidly from a depth of more than 7 km towards the summit of the volcano (Hjaltadóttir et al., 2011), culminating in an explosive eruption in the early morning on 14 April. Magma-water interaction was intensive during the first two days but gradually declined, and the activity be-came purely magmatic by 21 April. During the first five days, magma discharge was on the order of 106kg s−1, dropped to 104–105kg s−1 until early May when activity picked up and reached a discharge of 106kg s−1again on 5–6 May, fol-lowed by an irregular decline in discharge until the end of the eruption in late May. The magma produced is of a
ben-moreitic to trachytic composition (Fig. 3a) with very fine to fine ash that disturbed air-traffic over Europe for extended periods in April and May.
3 Samples
Our sample suite is comprised of basaltic lava (FH-1) and tephra (FH-2) from the initial phase of the flank eruption at Fimmvörðuháls, a tephra (FH-3) collected directly from the fallout from the plume on 1 April, and lava (FH-4) from the last stage of the fissure eruption. The benmoreitic sample suite includes tephra collected 15 April (EJ-1), a composite sample of tephra produced 17–19 April (EJ-2), and tephra from 22 April 3), 27 April 4), and 5 May tephra (EJ-5), in addition to two bread-crust bombs of trachyte compo-sition (EJ-6,7) from the final days of the eruption, collected on 3 June 2010 from the surface of 45 m thick tephra pile on the eastern rim of the new crater. Tephra from the 1821–1823 penultimate eruption of Eyjafjallajökull was sampled from a soil section on the western flank of the volcano for compari-son. The freshly collected samples were reduced to a powder in an agate ring-mill in preparation for whole-rock analysis. Tephra samples were mounted in epoxy, whereas the 1821 tephra was washed and sieved several times until all soil re-mains were eliminated. Two size fractions were mounted in epoxy and polished before in-situ analysis. No alteration of the glass fragments was observed. The exact timing of our samples is fundamental for precisely deciphering the magma dynamics prior to and during the eruption.
4 Methods
4.1 Microanalytical Techniques
4.1.1 Electron probe microanalyses
Major element compositions of crystals and glasses were de-termined on a Cameca SX100 electron microprobe at the Laboratoire Magmas et Volcans of Clermont-Ferrand. Oper-ating conditions were 15 kV accelerOper-ating voltage and 15 nA focused beam for minerals. Synthetic and natural minerals standards were used for calibration, with counting time set at 10 s for all elements. During glass analyses, analytical con-ditions were adjusted to minimise sodium mobility; basaltic and andesitic/dacitic tephra were analysed at 4 nA and 2 nA beam current, respectively, with a 10 µm defocused beam. Optimized mixture of minerals standards (synthetic and nat-ural) and glasses (A-THO and VG2) was used for calibration. The counting time was 10 s for Na, Si, Ca, Ti and P; 20 s for Al and Mg; 30 s for Mn, and 40 s for K and Fe. Secondary international glass standard USGS VG A-99 (Jarosewich et al., 1979; Thornber et al., 2002) was analysed during each session to monitor for possible instrumental drift. Analyses during three days in a row, yield relative standard deviation
O. Sigmarsson et al.: Remobilization of silicic intrusion by mafic magmas 273 Figure 2 Sigmarssson et al.: Chromite Fo74 Fo82 An68 50 m Fo80 Fo48 Fo50 Fo80 EJ-5 FH-3 100 m EJ-2 Or16 En11Fs48Wo41 Tri 50 m 100 m 500 m EJ-5 50 m An13 An14 An41 An31 An32 SiO2 = 62.6% SiO2 = 62.8% 100 m EJ-2 An52 Fo64 En37Fs22Wo38 a b d c e f
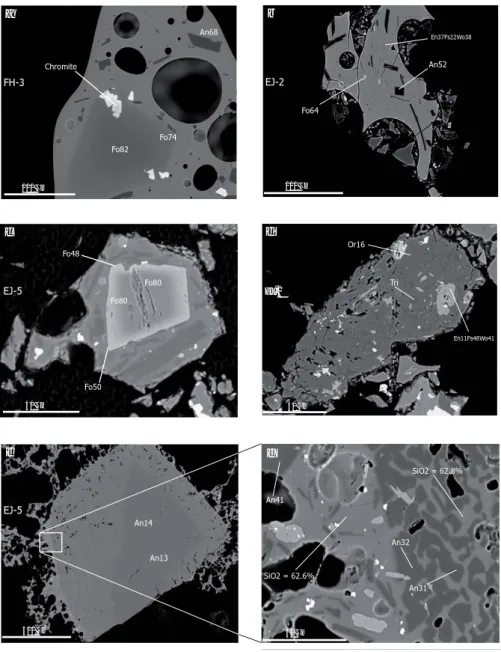
Fig. 2. Backscattered-electron images of individual tephra grains from the 2010 Eyjafjallajökull eruption: (a) basalt produced 1 April during
the flank eruption at Fimmvörðuháls; (b) evolved basalt emitted together with tephra of silicic and intermediate composition during the early (17–19 April) explosive phase (note the bent plagioclase lath that grew contemporaneously with the large vesicle illustrating gas exsolution driven crystallisation); (c) cracked Mg-rich olivine-core mantled with iron-richer olivine set in partly crystalline groundmass from 5 May suggests injection of primitive basalt into the silicic magma body; (d) microsyenitic fragment composed of alkali feldspar, sodic plagioclase, ferrohedenbergite, tridymite and fluorite minerals; (e–f) destabilised oligoclase that upon melting yielded trachytic melt and calcium-richer plagioclase (see text for further discussion). Sample numbers are given at the left boundary of each image.
of 0.6 % for SiO2, 1–2 % for TiO2, Al2O3 and CaO, 2.2 %
for FeO, and 3.3 % for Na2O and K2O, using a single set of
calibration values.
4.1.2 Laser ablation inductively coupled plasma mass spectrometry
Trace element analyses in glasses were performed at the Laboratoire Magmas et Volcans (Clermont-Ferrand) using a Resonetics M50 EXCIMER laser (193 nm) coupled to an
Ag-ilent 7500cs ICP-MS. The laser was operated at 6 mJ energy, 2 Hz repetition rate and a 11 µm spot size diameter. Ablation gas was pure helium; nitrogen (7 ml min−1) and argon were mixed with the carrier gas via Y-connectors between the ab-lation cell and ICP-MS. Analysis duration was split up in two distinct parts: 40 s background acquisition followed by 50 s data acquisition from the sample. Stability of signal intensity during ablation proved a good indicator of the analytical spot homogeneity.
The raw analyses were reduced with the Glitter software (van Achterberg et al., 2001), using CaO concentrations (measured earlier by electron microprobe) as internal stan-dard. NIST 612 glass was used as the primary standard; NIST 610, BCR2-G and A-THO, periodically analyzed dur-ing the laser sessions, were used as reference materials for run quality control. The two latter reference glasses have similar composition as the analyzed sample and are there-fore well suited to estimate precision and accuracy. Despite the small spot size, precision and accuracy were always bet-ter than 10 % for all the elements at 95 % confidence level.
4.2 Whole-rock analysis
4.2.1 Major- and trace element concentrations
About 100 mg of powder sample were fluxed with lithium metaborate (proportions 1:3) in a carbon crucible using an in-duction furnace. The melt-pearl was immediately dissolved in diluted nitric acid and diluted 2000 times before ICP-AES analysis. Another 100 mg powder aliquot was dissolved in concentrated HF-HNO3, evaporated to near dryness and
re-dissolved in 7 M HNO3. The aliquot was evaporated to
near dryness and subsequently diluted in HNO3 0.4 M to
reach a total dilution factor of 5000 for determination of trace element abundances by quadrupole ICP-MS (Agilent 7500, Laboratoire Magmas et Volcans). The reaction cell (He mode) was used to reduce interferences on masses ranging from 45 (Sc) to 75 (As). The signal was calibrated externally with a reference basaltic standard (BHVO-2, batch 759) dis-solved as samples, and employed the GeoReM preferred val-ues (http://georem.mpch-mainz.gwdg.de/). Both standards and pure HNO30.4 M were measured every 4 samples. The
external reproducibility of the method, as estimated by run-ning repeatedly different standards (BCR-2, BIR, BEN) is <5% (2σ ) for most lithophile elements and < 15% for chal-cophile elements.
4.2.2 Oxygen isotopes
Laser fluorination oxygen isotope analyses were performed at the University of Oregon stable isotope laboratory using a 35 W CO2-laser. Bulk grain sample ranging in weight from
1.1 to 2 mg were reacted with purified BrF5reagent to
liber-ate oxygen. The gases generliber-ated in the laser chamber were purified through a series of cryogenic traps held at liquid ni-trogen temperature, with a mercury diffusion pump to elim-inate traces of fluorine gas. Oxygen was converted to CO2
gas using a small platinum-graphite converter, and then the CO2gas was analyzed on a MAT 253 mass spectrometer
in-tegrated to the laser line. Five aliquots of standards were analyzed together with the unknown samples; Gore Mt Gar-net (δ18O = 5.75h) was used in the standard set. Day-to-day δ18O variability on the standards ranged from –0.1 to + 0.25h, and these values were added to the unknown
sam-ples to correct for day-to-day variability and absolute values on SMOW scale. The obtained precision on the standards is better than 0.13h and 0.01 h in two sessions at 1 standard deviation.
4.2.3 Isotope ratios of Sr and Nd
About 100–150 mg of rock powder (chips for FH-3) were weighed into Teflon beakers for the samples and rock stan-dards and leached for an hour in warm 6 M HCl. After leach-ing, the samples were washed in Milli-Q water and dissolved in a 2:1 mixture of concentrated HNO3and HF on a hotplate
for 3 days. After drying down, the sample residues were re-dissolved in 6 M HCl, dried down and rere-dissolved again in 6 M HCl to obtain clear sample solutions. The samples for Sr and Nd analysis were dried down and redissolved in 1 M HNO3 and passed through TRU.Spec column chemistry; the Sr and Nd fractions were further purified through Sr.spec and LN.spec column chemistries, respectively (Pin et al., 1994; Pin et al. 1997).
The Sr samples were analysed at the Imperial College London MAGIC laboratories and Laboratoire Magmas et Volcans in Clermont-Ferrand on Triton TIMS in static mode. Rubidium interferences were monitored and corrected for, but were always lower than 40 ppm. Data were corrected for instrumental mass fractionation using the exponential law and88Sr/86Sr = 8.375209. Six analyses of NIST SRM 987 in-terspersed with the samples gave an average87Sr/86Sr value of 0.710251 ± 8 (2σ ).
Neodymium was analyzed in static mode and data were corrected for instrumental mass fractionation using the exponential law, and 146Nd/144Nd = 0.7219. Sam-ples were analyzed in two analytical sessions: dur-ing the first, average value of the JNdi standard was 143Nd/144Nd = 0.512099 ± 20; during the second,
143Nd/144Nd = 0.512059 ± 20. Sample data were normalized
to143Nd/144Nd value of JNdi of 0.512113. Samarium inter-ferences were monitored and corrected for during the run; they were always lower than 100 ppm.
5 Results and discussion
Major-element concentrations show that the basalt of the flank eruption is mildly alkaline in composition (Ta-ble 1), similar to the magma erupted during the first half of the 1963–1967 Surtsey eruption in the Vestman-naeyjar volcanic system, 65 km south of Eyjafjallajökull (e.g. Jakobsson, 1979; Furman et al., 1991; Sigmarsson et al., 2009). Euhedral and normally zoned phenocrysts of olivines (Fo87−71)and plagioclases (An86−61)are
abun-dant in addition to rare chromian spinel (inclusions in olivines) and clinopyroxene (Mg-number (100 × molar ra-tio of MgO over MgO + FeO) = 76-65). Glomerocrysts of olivine, plagioclase and clinopyroxene display more evolved
O. Sigmarsson et al.: Remobilization of silicic intrusion by mafic magmas 275
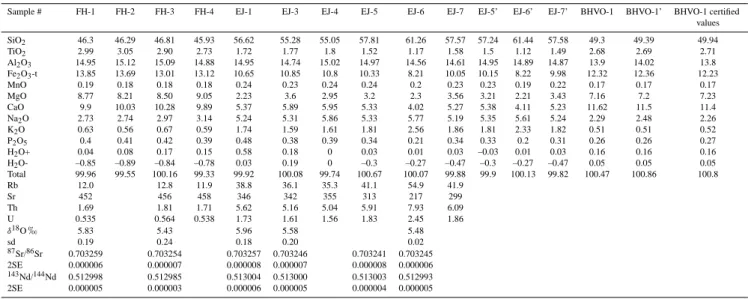
Table 1. Whole-rock major- and trace-element concentrations and Sr-, Nd- and O-isotope ratios in Eyjafjallajökull 2010 products.
Sample # FH-1 FH-2 FH-3 FH-4 EJ-1 EJ-3 EJ-4 EJ-5 EJ-6 EJ-7 EJ-5’ EJ-6’ EJ-7’ BHVO-1 BHVO-1’ BHVO-1 certified values SiO2 46.3 46.29 46.81 45.93 56.62 55.28 55.05 57.81 61.26 57.57 57.24 61.44 57.58 49.3 49.39 49.94 TiO2 2.99 3.05 2.90 2.73 1.72 1.77 1.8 1.52 1.17 1.58 1.5 1.12 1.49 2.68 2.69 2.71 Al2O3 14.95 15.12 15.09 14.88 14.95 14.74 15.02 14.97 14.56 14.61 14.95 14.89 14.87 13.9 14.02 13.8 Fe2O3-t 13.85 13.69 13.01 13.12 10.65 10.85 10.8 10.33 8.21 10.05 10.15 8.22 9.98 12.32 12.36 12.23 MnO 0.19 0.18 0.18 0.18 0.24 0.23 0.24 0.24 0.2 0.23 0.23 0.19 0.22 0.17 0.17 0.17 MgO 8.77 8.21 8.50 9.05 2.23 3.6 2.95 3.2 2.3 3.56 3.21 2.21 3.43 7.16 7.2 7.23 CaO 9.9 10.03 10.28 9.89 5.37 5.89 5.95 5.33 4.02 5.27 5.38 4.11 5.23 11.62 11.5 11.4 Na2O 2.73 2.74 2.97 3.14 5.24 5.31 5.86 5.33 5.77 5.19 5.35 5.61 5.24 2.29 2.48 2.26 K2O 0.63 0.56 0.67 0.59 1.74 1.59 1.61 1.81 2.56 1.86 1.81 2.33 1.82 0.51 0.51 0.52 P2O5 0.4 0.41 0.42 0.39 0.48 0.38 0.39 0.34 0.21 0.34 0.33 0.2 0.31 0.26 0.26 0.27 H2O+ 0.04 0.08 0.17 0.15 0.58 0.18 0 0.03 0.01 0.03 –0.03 0.01 0.03 0.16 0.16 0.16 H2O- –0.85 –0.89 –0.84 –0.78 0.03 0.19 0 –0.3 –0.27 –0.47 –0.3 –0.27 –0.47 0.05 0.05 0.05 Total 99.96 99.55 100.16 99.33 99.92 100.08 99.74 100.67 100.07 99.88 99.9 100.13 99.82 100.47 100.86 100.8 Rb 12.0 12.8 11.9 38.8 36.1 35.3 41.1 54.9 41.9 Sr 452 456 458 346 342 355 313 217 299 Th 1.69 1.81 1.71 5.62 5.16 5.04 5.91 7.93 6.09 U 0.535 0.564 0.538 1.73 1.61 1.56 1.83 2.45 1.86 δ18Oh 5.83 5.43 5.96 5.58 5.48 sd 0.19 0.24 0.18 0.20 0.02 87Sr/86Sr 0.703259 0.703254 0.703257 0.703246 0.703241 0.703245 2SE 0.000006 0.000007 0.000008 0.000007 0.000008 0.000006 143Nd/144Nd 0.512998 0.512985 0.513004 0.513000 0.513003 0.512993 2SE 0.000005 0.000003 0.000006 0.000005 0.000004 0.000005
Major- and trace-element concentrations are given in wt%, and ppm, respectively. Abbreviations SE and sd denote standard error and standard deviation, respectively.
composition and oscillatory zonation (Fo57−68, An79−68,
Cpx Mg-number: 79-63). The magma is highly vesiculated and the groundmass is largely crystallized (Fig. 2). The in-terstitial glass has evolved FeTi-basaltic composition simi-lar to segregation veins at Surtsey and Holocene lavas from the Katla volcano (Sigmarsson et al., 2009; Óladóttir et al., 2008). Less evolved basaltic glass compositions are pre-served in melt inclusions of olivine and plagioclase phe-nocrysts (Moune et al., 2011). In contrast, bulk samples of tephra from the explosive phase of the 2010 Eyjafjallajökull eruption are of a benmoreitic composition (Table 1). During the summit eruption, phenocryst compositions vary greatly, with olivines ranging from Fo80 (Fig. 2) to Fo46, feldspars
varying from An69 to An9, and Mg-number of
clinopyrox-ene ranging from 72 down to 19. Magnetite is abundant and traces of apatite, pyrite and orthopyroxene are also present. Both the plagioclases and the clinopyroxenes display an in-verse chemical zonation (e.g. Fig. 2e–f), with a core hav-ing, respectively, lower An content and Mg-number. Such compositional zonation is readly explained by magma mix-ing. In contrast, zoned olivines have a core with higher Fo (Fig. 2c). Noteworthy are microgranitic fragments com-posed of anorthoclase (An1.2Or32), tridymite,
ferrohedenber-gite (Mg-number = 19; En11Fs48Wo41)and fluorite emitted
during the first days of the summit eruption (Fig. 2d). The major-element concentration variations for the whole-rock and glass samples are shown in Fig. 3, where CaO vs. MgO are plotted (a) and the molar ratio of CaO over Al2O3
is displayed as a function of the Mg-number (b). The whole-rock CaO/MgO decreased from 2.41 in the initial phase (sample EJ-1) to 1.48 in bread-crust bombs from the final stage of the eruption. Whole-rock sample of the first tephra (15 April) plots on a binary mixing line defined by the
inter-stitial glass of the Fimmvörðuháls basalt and the glass com-position of the 1821–1823 AD rhyolitic tephra. Three glass composition is detected in the composite tephra from 17– 19 April (sample EJ-2): basalt with SiO2 of 49–51 %,
ben-moreite (SiO2 = 60–61 %), and trachyte (SiO2 = 69–70 %;
Fig. 3 and Table 2). These compositions plot on the same binary mixing line, indicating mechanical mixing, or min-gling, of the evolved basalts with older silicic melt. In-situ glass analyses of tephra produced between 22 April and 5 May (samples EJ-3,4,5) are all of intermediate composition. These tephra show increasingly lower whole-rock CaO/MgO values with time, indicating changes in composition of mix-ing end-members durmix-ing the eruption. Other major elements display the same behaviour, namely a single mixing line on oxide vs. oxide diagrams for the early samples and changing ratios between the different elements for the later samples.
In-situ trace element measurements (see Table 3) in the three glass types of sample EJ-2, three glass inclusions in phenocrysts of the Fimmvörðuháls flank basalt, and in tephra glass from the 1821–1823 eruption confirm the role of mingling in forming the 2010 Eyjafjallajökull benmoreite magma. Strong linear correlations are not only observed be-tween incompatible element concentrations such as Rb and Th (Fig. 4), but also between those of compatible and in-compatible elements (e.g. Sr versus Th). This suggests that crystal-liquid separation had probably too little time to oc-cur. The apparent absence of fractional crystallization de-spite tenfold variation in Th concentrations is best explained by rapid magma mingling with minimal melt homogenisa-tion prior to eruphomogenisa-tion. The whole-rock tephra trace element compositions (Table 1) plot on the same mixing line, illus-trating that despite changing composition of the mixing end-members during the eruption, they must have had similar
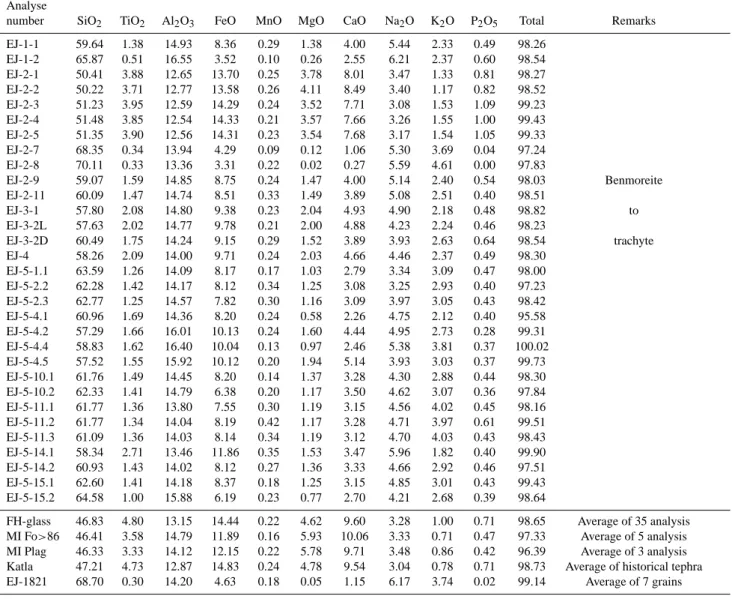
Table 2. Electron probe microanalysis of glasses in Eyjafjallajökull’s tephra.
Analyse
number SiO2 TiO2 Al2O3 FeO MnO MgO CaO Na2O K2O P2O5 Total Remarks
EJ-1-1 59.64 1.38 14.93 8.36 0.29 1.38 4.00 5.44 2.33 0.49 98.26 EJ-1-2 65.87 0.51 16.55 3.52 0.10 0.26 2.55 6.21 2.37 0.60 98.54 EJ-2-1 50.41 3.88 12.65 13.70 0.25 3.78 8.01 3.47 1.33 0.81 98.27 EJ-2-2 50.22 3.71 12.77 13.58 0.26 4.11 8.49 3.40 1.17 0.82 98.52 EJ-2-3 51.23 3.95 12.59 14.29 0.24 3.52 7.71 3.08 1.53 1.09 99.23 EJ-2-4 51.48 3.85 12.54 14.33 0.21 3.57 7.66 3.26 1.55 1.00 99.43 EJ-2-5 51.35 3.90 12.56 14.31 0.23 3.54 7.68 3.17 1.54 1.05 99.33 EJ-2-7 68.35 0.34 13.94 4.29 0.09 0.12 1.06 5.30 3.69 0.04 97.24 EJ-2-8 70.11 0.33 13.36 3.31 0.22 0.02 0.27 5.59 4.61 0.00 97.83 EJ-2-9 59.07 1.59 14.85 8.75 0.24 1.47 4.00 5.14 2.40 0.54 98.03 Benmoreite EJ-2-11 60.09 1.47 14.74 8.51 0.33 1.49 3.89 5.08 2.51 0.40 98.51 EJ-3-1 57.80 2.08 14.80 9.38 0.23 2.04 4.93 4.90 2.18 0.48 98.82 to EJ-3-2L 57.63 2.02 14.77 9.78 0.21 2.00 4.88 4.23 2.24 0.46 98.23 EJ-3-2D 60.49 1.75 14.24 9.15 0.29 1.52 3.89 3.93 2.63 0.64 98.54 trachyte EJ-4 58.26 2.09 14.00 9.71 0.24 2.03 4.66 4.46 2.37 0.49 98.30 EJ-5-1.1 63.59 1.26 14.09 8.17 0.17 1.03 2.79 3.34 3.09 0.47 98.00 EJ-5-2.2 62.28 1.42 14.17 8.12 0.34 1.25 3.08 3.25 2.93 0.40 97.23 EJ-5-2.3 62.77 1.25 14.57 7.82 0.30 1.16 3.09 3.97 3.05 0.43 98.42 EJ-5-4.1 60.96 1.69 14.36 8.20 0.24 0.58 2.26 4.75 2.12 0.40 95.58 EJ-5-4.2 57.29 1.66 16.01 10.13 0.24 1.60 4.44 4.95 2.73 0.28 99.31 EJ-5-4.4 58.83 1.62 16.40 10.04 0.13 0.97 2.46 5.38 3.81 0.37 100.02 EJ-5-4.5 57.52 1.55 15.92 10.12 0.20 1.94 5.14 3.93 3.03 0.37 99.73 EJ-5-10.1 61.76 1.49 14.45 8.20 0.14 1.37 3.28 4.30 2.88 0.44 98.30 EJ-5-10.2 62.33 1.41 14.79 6.38 0.20 1.17 3.50 4.62 3.07 0.36 97.84 EJ-5-11.1 61.77 1.36 13.80 7.55 0.30 1.19 3.15 4.56 4.02 0.45 98.16 EJ-5-11.2 61.77 1.34 14.04 8.19 0.42 1.17 3.28 4.71 3.97 0.61 99.51 EJ-5-11.3 61.09 1.36 14.03 8.14 0.34 1.19 3.12 4.70 4.03 0.43 98.43 EJ-5-14.1 58.34 2.71 13.46 11.86 0.35 1.53 3.47 5.96 1.82 0.40 99.90 EJ-5-14.2 60.93 1.43 14.02 8.12 0.27 1.36 3.33 4.66 2.92 0.46 97.51 EJ-5-15.1 62.60 1.41 14.18 8.37 0.18 1.25 3.15 4.85 3.01 0.43 99.43 EJ-5-15.2 64.58 1.00 15.88 6.19 0.23 0.77 2.70 4.21 2.68 0.39 98.64
FH-glass 46.83 4.80 13.15 14.44 0.22 4.62 9.60 3.28 1.00 0.71 98.65 Average of 35 analysis
MI Fo>86 46.41 3.58 14.79 11.89 0.16 5.93 10.06 3.33 0.71 0.47 97.33 Average of 5 analysis
MI Plag 46.33 3.33 14.12 12.15 0.22 5.78 9.71 3.48 0.86 0.42 96.39 Average of 3 analysis
Katla 47.21 4.73 12.87 14.83 0.24 4.78 9.54 3.04 0.78 0.71 98.73 Average of historical tephra
EJ-1821 68.70 0.30 14.20 4.63 0.18 0.05 1.15 6.17 3.74 0.02 99.14 Average of 7 grains
Rb-Th and Sr-Th ratios. Uniform O, Sr and Nd isotope ra-tios in the whole-rock lava and tephra samples (Table 1) sup-port this conclusion. Delta18O of 5.96 ± 0.18h in EJ-1 is consistent with the silicic mixing end-member being formed by fractional crystallisation of mantle derived basalt similar to those erupted laterally on Fimmvörðuháls (δ18O = 5.4– 5.8 ± 0.2h). During this process the global partition coeffi-cient of Sr (DSr)between fractionating mineral assemblage and residual melt must have been close to unity (Fig. 4b).
The rapid magma mingling/mixing is also reflected in the highly heterogeneous and zoned mineral compositions in the benmoreitic tephra. For instance, tephra that fell during the second peak in magma discharge (i.e. 5 and 6 May) contains 50 µm zoned olivine (Fig. 2c) with 10 µm thick rim having a composition of Fo48−50, but a core of Fo80indistinguishable
from olivines in the Fimmvörðuháls basalts. This suggests
arrival of deep-derived primitive basalts that concurs with a deep seismic swarm (originating from a depth close to the mantle-crust boundary (Hjaltadóttir et al., 2011; Bjarnason, 2008)), as well as increased magma and sulphur output as indicated, respectively, by higher eruption column on 5 May (Arason et al., 2011) and satellite observations (Carn et al., 2010), together with the appearance of sulphide crystals in the benmoreitic tephra. The new influx of more primitive basalt magma coincides with changes in the composition of the silicic mixing end-member changing to a less evolved composition, as indicated by the mixing curves and lines on Fig. 3. The composition of the final mixing end-member is present in the EJ-5 tephra and identified as low temperature melting component of a Na-rich plagioclase (Fig. 2e–f). This suggests that the stagnant residual melt, most likely since the 1821–1823 eruption, was somewhat altered by blending with
O. Sigmarsson et al.: Remobilization of silicic intrusion by mafic magmas 277
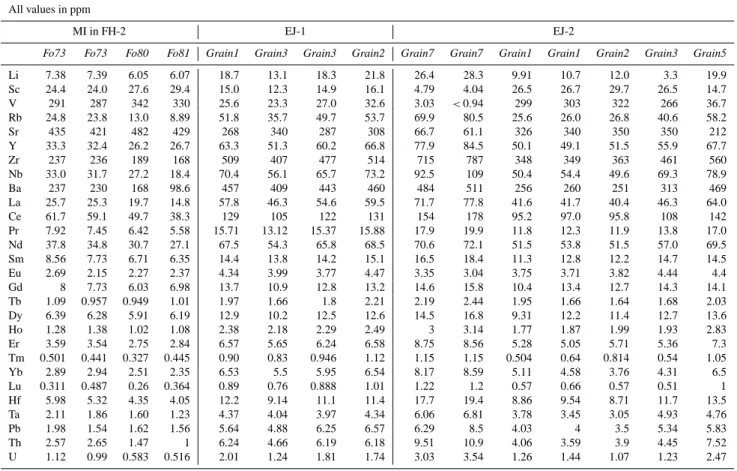
Table 3. Trace element concentrations analysed by laser ablation ICP-MS in melt inclusions (MI) in olivines from flank basalt and in
benmoritic tephra erupted from the first explosive phase. All values in ppm
MI in FH-2 EJ-1 EJ-2
Fo73 Fo73 Fo80 Fo81 Grain1 Grain3 Grain3 Grain2 Grain7 Grain7 Grain1 Grain1 Grain2 Grain3 Grain5
Li 7.38 7.39 6.05 6.07 18.7 13.1 18.3 21.8 26.4 28.3 9.91 10.7 12.0 3.3 19.9 Sc 24.4 24.0 27.6 29.4 15.0 12.3 14.9 16.1 4.79 4.04 26.5 26.7 29.7 26.5 14.7 V 291 287 342 330 25.6 23.3 27.0 32.6 3.03 <0.94 299 303 322 266 36.7 Rb 24.8 23.8 13.0 8.89 51.8 35.7 49.7 53.7 69.9 80.5 25.6 26.0 26.8 40.6 58.2 Sr 435 421 482 429 268 340 287 308 66.7 61.1 326 340 350 350 212 Y 33.3 32.4 26.2 26.7 63.3 51.3 60.2 66.8 77.9 84.5 50.1 49.1 51.5 55.9 67.7 Zr 237 236 189 168 509 407 477 514 715 787 348 349 363 461 560 Nb 33.0 31.7 27.2 18.4 70.4 56.1 65.7 73.2 92.5 109 50.4 54.4 49.6 69.3 78.9 Ba 237 230 168 98.6 457 409 443 460 484 511 256 260 251 313 469 La 25.7 25.3 19.7 14.8 57.8 46.3 54.6 59.5 71.7 77.8 41.6 41.7 40.4 46.3 64.0 Ce 61.7 59.1 49.7 38.3 129 105 122 131 154 178 95.2 97.0 95.8 108 142 Pr 7.92 7.45 6.42 5.58 15.71 13.12 15.37 15.88 17.9 19.9 11.8 12.3 11.9 13.8 17.0 Nd 37.8 34.8 30.7 27.1 67.5 54.3 65.8 68.5 70.6 72.1 51.5 53.8 51.5 57.0 69.5 Sm 8.56 7.73 6.71 6.35 14.4 13.8 14.2 15.1 16.5 18.4 11.3 12.8 12.2 14.7 14.5 Eu 2.69 2.15 2.27 2.37 4.34 3.99 3.77 4.47 3.35 3.04 3.75 3.71 3.82 4.44 4.4 Gd 8 7.73 6.03 6.98 13.7 10.9 12.8 13.2 14.6 15.8 10.4 13.4 12.7 14.3 14.1 Tb 1.09 0.957 0.949 1.01 1.97 1.66 1.8 2.21 2.19 2.44 1.95 1.66 1.64 1.68 2.03 Dy 6.39 6.28 5.91 6.19 12.9 10.2 12.5 12.6 14.5 16.8 9.31 12.2 11.4 12.7 13.6 Ho 1.28 1.38 1.02 1.08 2.38 2.18 2.29 2.49 3 3.14 1.77 1.87 1.99 1.93 2.83 Er 3.59 3.54 2.75 2.84 6.57 5.65 6.24 6.58 8.75 8.56 5.28 5.05 5.71 5.36 7.3 Tm 0.501 0.441 0.327 0.445 0.90 0.83 0.946 1.12 1.15 1.15 0.504 0.64 0.814 0.54 1.05 Yb 2.89 2.94 2.51 2.35 6.53 5.5 5.95 6.54 8.17 8.59 5.11 4.58 3.76 4.31 6.5 Lu 0.311 0.487 0.26 0.364 0.89 0.76 0.888 1.01 1.22 1.2 0.57 0.66 0.57 0.51 1 Hf 5.98 5.32 4.35 4.05 12.2 9.14 11.1 11.4 17.7 19.4 8.86 9.54 8.71 11.7 13.5 Ta 2.11 1.86 1.60 1.23 4.37 4.04 3.97 4.34 6.06 6.81 3.78 3.45 3.05 4.93 4.76 Pb 1.98 1.54 1.62 1.56 5.64 4.88 6.25 6.57 6.29 8.5 4.03 4 3.5 5.34 5.83 Th 2.57 2.65 1.47 1 6.24 4.66 6.19 6.18 9.51 10.9 4.06 3.59 3.9 4.45 7.52 U 1.12 0.99 0.583 0.516 2.01 1.24 1.81 1.74 3.03 3.54 1.26 1.44 1.07 1.23 2.47
partial-melts of the magma chamber’s carapace (Fig. 1d) due to interaction with newly injected and hotter mantle-derived basalts. Taken together, the explosive Eyjafjalla-jökull eruption is best explained by mingling and mixing involving an older silicic intrusion that was heated up and remobilized by the injection of hot basalt magma that be-came more primitive with time. The high resolution sam-ple suite from the 2010 Eyjafjallajökull eruption allows us to estimate a) the proportions of the basalt component in the mingled/mixed magma and its variations with time, and b) the time-dependent changes in the composition of the deep-derived basalt magma (Fig. 4). These estimates are obtained from the calculated binary mixing curves shown in Fig. 3b, and from the intercept of the mixing lines with the fractional crystallisation vector of the basalts applying the lever rule (see legend to Fig. 3). The results indicate that the propor-tions of the basalt decreased from approximately 50 % late April to less than 30 % a month later, whereas the evolved FeTi-basalt composition early in the eruption was progres-sively replaced by more primitive basalt composition at the end.
The petrological and geochemical results obtained so far suggest the following scenario. The real-time deformation results measured during the first three months of 2010 (Sig-mundsson et al., 2010) were caused by the ascent and de-gassing of relatively primitive and slightly alkaline basalt magma that produced, via fractional crystallisation, evolved FeTi-basalts similar to those of Katla volcano (Sigmarsson et al., 2009). This evolved basalt appears to have accumu-lated at depth over the three months, and only shortly be-fore the explosive eruption (13 April) encountered the par-tially molten 1821–1823 residual silicic magma body be-neath the summit of the volcano (Keiding and Sigmarsson, 2011). The silicic magma intrusion/chamber appears to have hindered the rise of the basalt, whereas a portion of the prim-itive basalt emerged further east during the Fimmvörðuháls flank eruption. Three weeks later the flank eruption stopped when the FeTi-basalt was injected into the now heated and re-mobilised alkaline rhyolite body directly beneath the summit crater, provoking the explosive eruption of mingled benmor-eitic magma. The magnitude 2.3 earthquake that occurred 13 April (at 22:59 GMT; Hjaltadóttir et al., 2011) at 7 km depth may indicate the timing of the basalt injection into the
Table 3. Continued.
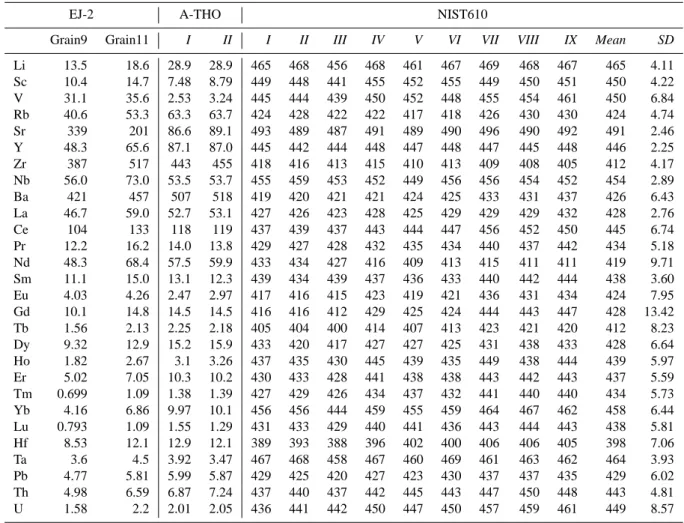
EJ-2 A-THO NIST610
Grain9 Grain11 I II I II III IV V VI VII VIII IX Mean SD
Li 13.5 18.6 28.9 28.9 465 468 456 468 461 467 469 468 467 465 4.11 Sc 10.4 14.7 7.48 8.79 449 448 441 455 452 455 449 450 451 450 4.22 V 31.1 35.6 2.53 3.24 445 444 439 450 452 448 455 454 461 450 6.84 Rb 40.6 53.3 63.3 63.7 424 428 422 422 417 418 426 430 430 424 4.74 Sr 339 201 86.6 89.1 493 489 487 491 489 490 496 490 492 491 2.46 Y 48.3 65.6 87.1 87.0 445 442 444 448 447 448 447 445 448 446 2.25 Zr 387 517 443 455 418 416 413 415 410 413 409 408 405 412 4.17 Nb 56.0 73.0 53.5 53.7 455 459 453 452 449 456 456 454 452 454 2.89 Ba 421 457 507 518 419 420 421 421 424 425 433 431 437 426 6.43 La 46.7 59.0 52.7 53.1 427 426 423 428 425 429 429 429 432 428 2.76 Ce 104 133 118 119 437 439 437 443 444 447 456 452 450 445 6.74 Pr 12.2 16.2 14.0 13.8 429 427 428 432 435 434 440 437 442 434 5.18 Nd 48.3 68.4 57.5 59.9 433 434 427 416 409 413 415 411 411 419 9.71 Sm 11.1 15.0 13.1 12.3 439 434 439 437 436 433 440 442 444 438 3.60 Eu 4.03 4.26 2.47 2.97 417 416 415 423 419 421 436 431 434 424 7.95 Gd 10.1 14.8 14.5 14.5 416 416 412 429 425 424 444 443 447 428 13.42 Tb 1.56 2.13 2.25 2.18 405 404 400 414 407 413 423 421 420 412 8.23 Dy 9.32 12.9 15.2 15.9 433 420 417 427 427 425 431 438 433 428 6.64 Ho 1.82 2.67 3.1 3.26 437 435 430 445 439 435 449 438 444 439 5.97 Er 5.02 7.05 10.3 10.2 430 433 428 441 438 438 443 442 443 437 5.59 Tm 0.699 1.09 1.38 1.39 427 429 426 434 437 432 441 440 440 434 5.73 Yb 4.16 6.86 9.97 10.1 456 456 444 459 455 459 464 467 462 458 6.44 Lu 0.793 1.09 1.55 1.29 431 433 429 440 441 436 443 444 443 438 5.81 Hf 8.53 12.1 12.9 12.1 389 393 388 396 402 400 406 406 405 398 7.06 Ta 3.6 4.5 3.92 3.47 467 468 458 467 460 469 461 463 462 464 3.93 Pb 4.77 5.81 5.99 5.87 429 425 420 427 423 430 437 437 435 429 6.02 Th 4.98 6.59 6.87 7.24 437 440 437 442 445 443 447 450 448 443 4.81 U 1.58 2.2 2.01 2.05 436 441 442 450 447 450 457 459 461 449 8.57
The first two MI in olivine with Fo73 and the two A-THO analysis are duplicate analysis of the same glass patch. The standard glass NIST610 was run as an unknown during different runs and yields the overall reproducibilty.
silicic intrusion. During the first two weeks of the explosive summit eruption, evolved basalt was involved in the magma mingling/mixing process, and thereafter the basalt became less evolved due to inflow of deeper-derived and more primi-tive magma. The ascent of deeper-derived basalts most likely caused the seismicity at 18–24 km depth observed in early May (Hjaltadóttir et al., 2011).
Decreasing mafic end-member proportions with time in the erupted mixture strongly suggests that the basaltic in-jection remobilized the half-solidified residual silicic magma beneath Eyjafjallajökull and that the 2010 eruption was shut off by declining basaltic intrusion rather than emptying of a silicic magma reservoir. Therefore, the next eruption at this volcano is likely to produce silicic magma with correspond-ing tephra production. The strong evidences for magma min-gling/mixing at the origin of recent explosive eruptions else-where, such as at Mt. St. Helens (USA, Pallister et al., 2008) and Mt. Unzen (Japan; Nakamura, 1995), and the time-related increasing proportions of mafic enclaves in volcanics from the on-going eruption at Soufrière Hills (Montserrat, Lesser Antilles; Barclay et al., 2010), clearly demonstrate
that not only is magma mingling and mixing important as a triggering mechanism at hazardous volcanoes but also a very dynamic process. The results of the present study clearly un-derline how fast magma mixing components can change.
6 Conclusions
The explosive summit eruption of Eyjafjallajökull in 2010 was triggered by an injection of Mg-rich basaltic magma several months earlier. This basalt stagnated below a sili-cic magma body – presumably residues from the penulti-mate alkali rhyolite eruption in 1821–1823 – degassed, par-tially crystallized and evolved to a FeTi-basalt. The heat and gas liberated rose up into the half-frozen silicic magma, opening a pathway for the evolved basalt that triggered the explosive eruption on 14 April through magma mingling within the silicic reservoir. In the meantime, the Mg-rich magma by-passed the central magma chamber and produced a flank eruption until the passage through the central conduit opened up. Early May, the evolved basalt was consumed
O. Sigmarsson et al.: Remobilization of silicic intrusion by mafic magmas 279 10 0 0.2 0.4 0.6 0.8 1 1.2 1.4 0 10 20 30 40 50 60 70 [CaO/Al 2 O 3 ] #Mg 90 70 50 30 90 70 50 10 FH-1,2,4 EJ-1 4 6 5 3 7 olivine clinopyroxene plagioclase 30 b Figure 3 Sigmarsson et al. 0 2 4 6 8 10 12 0 2 4 6 8 10 WR Katla Glass EJ-1 Glass EJ-2 Glass EJ-3 Glass EJ-4 Glass EJ-5 EJ-1821 FH-glass MI FH-2 CaO (wt%) MgO (wt%) 14-27/4 14-15/4 27/4 5/5 20/5 5-20/5 22/4 EJ-1 4 53 6 7 FH-1,2,4 a 1821 1821
Fig. 3. Major-element variations in 2010 Eyjafjallajökull tephra and
lava. (a) CaO versus MgO showing a near-horizontal fractionation vector from Fimmvörðuháls whole-rock (WR) basalt compositions (samples with prefix FH) to that of the corresponding interstitial glasses and Katla 1918 basalt glasses (Óladóttir et al., 2008). Mix-ing lines between these evolved basalt compositions (MgO∼4.5; CaO∼9.5 wt%) and the two silicic end-members, the 1821–1823 rhyolite and oligoclase melt (open crosses; see text for further dis-cussion) of 5 May (dash-dot line) are also shown. The intercepts of these lines with the basaltic fractionation vector are used to es-timate the degree of basaltic evolution (expressed as mixing pro-portions between evolved and primitive basalts in Fig. 5) in the mafic mixing pole. Dates of samples corresponding to different in-tercepts are shown in addition to the interval of active silicic mix-ing poles. (b) Molar ratios of CaO over Al2O3against the Mg-number (#Mg = molar MgO over the sum of MgO plus FeO cal-culated from total iron analysed by assuming Fe2O3/FeO of 0.2). In the lower right corner are shown schematically the melt compo-sition vectors of pure mineral fractionation from basalt. These are consistent with olivine domination on the fractionation vector from FH-basalt, but the trend of EJ-2 basalt glasses indicates clinopy-roxene fractionation. Binary mixing curves are calculated using the same end-member composition as in (a). Mingling and mixing proportions of basalt to silicic melt are derived from the calculated curves. Duplicate analyses of three Eyjafjallajökull bulk-tephra (EJ-5, 6, 7) indicate the overall analytical precision. Abbreviations are WR for whole-rock compositions, EJ for Eyjafjallajökull, FH for Fimmvörðuháls flank basalts and MI for melt inclusions.
0 20 40 60 80 100 0 2 4 6 8 10 12 MI FH-2 EJ-1 EJ-2 EJ-1821 WR K-1918 Rb (ppm) Th (ppm) a 0 100 200 300 400 500 0 2 4 6 8 10 12 Sr (ppm) Th (ppm) 0.2 0.1 0.1 0.2 0.3 0.3 0.4 0.4 0.5 0.5 0.6 0.7 0.8 D = 0.5 D = 1 b Figure 4 Sigmarsson et al.: Single-grain variability 1821 1821
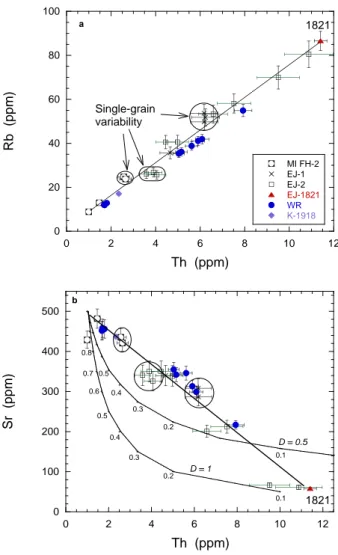
Fig. 4. Linear correlations of Rb, Sr, and Th concentrations
be-tween extreme magma compositions produced during the 2010 Eyjafjallajökull eruption. Four spot analyses of three olivine-hosted melt inclusions are shown for comparison. Larger error bars for the in-situ analysis, compared to those of whole-rock (WR), are caused by small ablation crater-size (diameter of 11 µm) due to small area of crystal-free glass patches and consequent lower count rates of each element. Multiple analyses of single grains are encircled in both panels. In (b), two curves of melt evolution during hypotheti-cal crystal fractionation are shown for different DSr(assuming DT h
close to 0) with the remaining melt fractions indicated. The origin of the 1821–1823 alkaline rhyolite will be addressed elsewhere but it is consistent with over 90 % fractional crystallisation from prim-itive basalt. This differentiation mechanism appears dominant at Icelandic volcanoes close to the periphery of the island (Martin and Sigmarsson, 2007). Apatite fractionation, where DSrcan be as high as 5 (Prowatke and Klemme, 2006), together with that of plagio-clase, having DSrin the range 1–3 (Fabbrizio et al., 2009), account for a bulk DSras high as unity. See Fig. 3 for abbreviations.
Mixing proportions of mafic end-member ( )
Proportions of primitive basalt in mafic end-member ( )
-0.2 0 0.2 0.4 0.6 0.8 1 1.2 0.1 0.2 0.3 0.4 0.5 0.6 0 5 10 15 20 25 30 35 40 Days 15/4 22/4 27/4 5/5 21/5 Fig. 5 Sigmarsson et al.
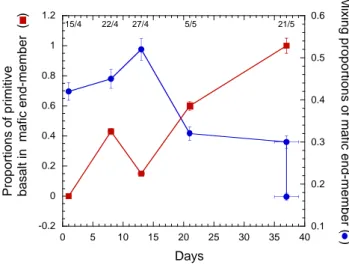
Fig. 5. Mixing (and mingling) proportions as a function of time
of primitive basalt in the mafic end-member (scale on left y-axis) and that of basalt melt in the benmoritic tephra of Eyjafjallajökull. Arbitrary 5 % error is assigned to the estimated magma mixing pro-portions that are derived from Fig. (3). The decrease of the basalt component suggests that supply of silicic magma at depth is abun-dant (see text for further details).
by the magma mingling/mixing and deeper Mg-rich basalt rose from a depth in excess of 20 km into the silicic reser-voir and caused increased magma output and a correspond-ing higher eruption column. The additional heat brought in by the fresh intrusion caused partial melting of the micro-granitic carapace, causing changes in the composition of the mixing end-members. Finally, the basalt injection declined and the eruption came to a halt.
Acknowledgements. Sigurdur R. Gislason collected sample EJ-1. Analytical assistance by C. Bosq, D. Auclair-Aubierge and M. Benbakkar was much appreciated. We are grateful to an anony-mous reviewer and D. Perugini for detailed and thought provoking reviews. Direct funding from the Icelandic government and a grant from the Icelandic Research Fund (110242011 “Volcano Anatomy”) is acknowledged. This article has a ClerVolc contribu-tion number 2.
Edited by: R. Moretti
References
Arason, P., Petersen, G.N., and Bjornsson, H.: Observations of the altitude of the volcanic plume during the eruption of Eyjafjalla-jökull, April–May 2010, Earth Syst. Sci. Data, 3, 9–17, 2011, http://www.earth-syst-sci-data.net/3/9/2011/.
Barclay, J., Herd, R. A., Edwards, B. R., Christopher, T., Kiddle, E. J., Plail, M., and Donovan, A.: Caught in the act: implications for the increasing abundance of mafic enclaves during the re-cent eruptive episodes of the Soufrière Hills volcano, Montserrat,
Geophys. Res. Lett., 37, L00E09, doi:10.1029/2010GL042509, 2010.
Bjarnason, I. Th.: An Iceland hotspot saga, Jökull, 58, 3–16, 2008. Carn, S. A., Wang, J. Yang, K., and Krotkov, N. A.: Sulfur bud-get of the 2010 Eyjafjallajökull eruption derived from satellite observations, AGU Fall Meeting, Abstract V53F-08, 2010. Clynne, M. A.: A Complex Magma Mixing Origin for Rocks
Erupted in 1915, Lassen Peak, California, J. Petrol., 40, 105– 132, 1999.
Eichelberger, J. C.: Vesiculation of mafic magma during replenish-ment of silicic magma reservoirs, Nature, 288, 446–450, 1980. Fabbrizio, A., Schmidt, M. W., Günther, D., and Eikenberg, J.:
Experimental determination of Ra mineral/melt partitioning for feldspars and226Ra-disequilibrium crystallization ages of pla-gioclase and alkali-feldspar, Earth Planet. Sc. Lett., 280, 137– 148, 2009.
Furman, T., Frey, F. A., and Park, K.-H.: Chemical constraints on the petrogenesis of mildly alkaline lavas from Vestmannaeyjar, Iceland: the Eldfell (1973) and Surtsey (1963–1967) eruptions: Contrib. Mineral. Petr., 109, 19–37, 1991.
Guðmundsson, M. T., Pedersen, R., Vogfjörd, K., Thorbjarnardot-tir, B., JakobsdotThorbjarnardot-tir, S., and Roberts, M.: Eruptions of Eyjafjalla-jökull Volcano, Iceland: Eos, 91, 190–191, 2010.
Hjaltadóttir, S., Vogfjörð, K., and Slunga, R.: Precise seis-mic mapping of magma pathways before and during the 2010 Eyjafjalljökull eruptions, submitted to J. Geophys. Res., 2011. Jakobsson, S. P.: Petrology of Recent basalts from the Eastern
Vol-canic Zone, Iceland: Acta Naturalia Islandica, 26, 1–103, 1979. Jarosewich, E., Nelen, J. A., and Borberg, J. A.: Electron
micro-probe reference samples for mineral analysis, edited by: Fudali, R. F., Smithsonian Institution Contributions to the Earth Sciences No. 22, Smithsonian Institution Press, 68–72, 1979.
Keiding, J. K. and Sigmarsson, O.: Geothermobarometry of the 2010 Eyjafjallajökull eruption, J. Geophys. Res., in press., 2011. Martin, E. and Sigmarsson, O.: Geographical variations of silicic magma origin in Iceland: the case of Torfajökull, Ljósufjöll and Snæfellsjökull volcanoes, Contrib. Mineral. Petr., 153, 593–605, 2007.
Moune, S., Sigmarsson, O., Schiano, P., and Thordarson, Th.: Melt inclusion in olivines from the 2010 flank eruption at Eyjafjalla-jökull: magma source and degassing, J. Geophys. Res., in review, 2011.
Nakamura, M.: Continuous mixing of crystal mush and replenished magma in the ongoing Unzen eruption, Geology, 23, 807–810, 1995.
Óladóttir, B., Sigmarsson, O., Larsen, G., and Thordarson, T.: Tem-poral evolution of the magma plumbing system beneath Katla volcano Iceland, B. Volcanol., 70, 475–493, 2008.
Pallister, J. S., Thornber, C. R., Cashman, K. V., Clynne, M. A., Lowers, H. A., Mandeville, C. W., Brownfield, I. K., and Meeker, G. P.: Petrology of the 2004–2006 Mount St. Helens lava dome – Implications for magmatic plumbing and eruption triggering, edited by: Sherrod, D. R., Sherrod, D. R., Scott, W. E., and Stauf-fer, P. H., A volcano rekindled; the renewed eruption of Mount St. Helens, 2004–2006, U.S. Geological Survey Professional Pa-per 1750, 647–702, 2008.
Pin, C., Briot, D., Bassin, C., and Poitrasson, F.: Concomitant sepa-ration of strontium and samarium-neodymium for isotopic anal-ysis in silicate samples, based on specific extraction
chromatog-O. Sigmarsson et al.: Remobilization of silicic intrusion by mafic magmas 281
raphy, Anal. Chim. Acta, 298, 209–217, 1994.
Pin, C. and Zaldegui, J. F. S.: Sequential separation of light rare-earth elements, thorium, and uranium by miniaturized extrac-tion chromatography: Applicaextrac-tion to isotopic analyses of silicate rocks, Anal. Chim. Acta, 339, 79–87, 1997.
Prowatke, S. and Klemme, S.: Trace element partitioning between apatite and silicate melts, Geochim. Cosmochim. Ac., 70, 4513– 4527, 2006.
Sigmarsson, O., Thordarson, Th., and Jakobsson, S. P.: Segrega-tions in Surtsey lavas (Iceland) reveal extreme magma differen-tiation during late stage flow emplacement, edited by: Thordars-son, Th., Self, S., Larsen, G., Rowland, S. K., and HoskuldsThordars-son, A.: Studies in Volcanology: The Legacy of George Walker. Spe-cial Publications of IAVCEI: London, United Kingdom, Geol. Soc., 2, 85–104, 2009.
Sigmundsson, F., Hreinsdóttir, S., Hooper, A., Árnadóttir, T., Ped-ersen, R., Roberts, M. J., Óskarsson, N., Auriac, A., Decriem, J., Einarsson, P., Geirsson, H., Hensch, M., Ófeigsson, B. G., Sturkell, E., Sveinbjörnsson, H., and Feigl, K. L.: Intrusion trig-gering of the 2010 Eyjafjallajökull eruption, Nature, 468, 426– 430, 2010.
Sparks, S. R. J., Sigurdsson, H., and Wilson, L.: Magma mixing: a mechanism for triggering acid explosive eruptions, Nature, 267, 315–318, 1977.
Suzuki, Y. and Nakada, S.: Remobilization of Highly Crystalline Felsic Magma by Injection of Mafic Magma: Constraints from the Middle Sixth Century Eruption at Haruna Volcano, Honshu, Japan, J. Petrol., 48, 1543–1567, 2007.
Thornber, C. R., Sherrod, D. R., Siems, D. R., Heliker, C. C., Meeker, G. P., Oscarsson, R. L., and Kauahikaua, J. P.: Whole rock and glass major-element geochemistry of Kilauea Volcano, Hawaii, near-vent eruptive products: September 1994 through September 2001, in: US Geological Survey open file report, 02– 17, 2002.
Tonarini, S., D’Antonio, M., Di Vito, M., Orsi, G., and Carandente, A.: Geochemical and B–Sr–Nd isotopic evidence for mingling and mixing processes in the magmatic system that fed the Astroni volcano (4.1–3.8 ka) within the Campi Flegrei caldera (southern Italy), Lithos, 107, 135–151, 2009.
van Achterbergh, E., Ryan, C. G., Jackson, S. E., and Griffin, W. X.: Data reduction software for La-ICP-MS, edited by: Sylvester, P., Laser ablation ICP-MS in Earth Science Principles and Applica-tions, Mineralogical Association of Canada, 239–243, 1997.