HAL Id: hal-00297964
https://hal.archives-ouvertes.fr/hal-00297964
Submitted on 24 Jan 2008HAL is a multi-disciplinary open access
archive for the deposit and dissemination of sci-entific research documents, whether they are pub-lished or not. The documents may come from teaching and research institutions in France or abroad, or from public or private research centers.
L’archive ouverte pluridisciplinaire HAL, est destinée au dépôt et à la diffusion de documents scientifiques de niveau recherche, publiés ou non, émanant des établissements d’enseignement et de recherche français ou étrangers, des laboratoires publics ou privés.
Methane emissions from the upwelling area off
Mauritania (NW Africa)
A. Kock, S. Gebhardt, H. W. Bange
To cite this version:
A. Kock, S. Gebhardt, H. W. Bange. Methane emissions from the upwelling area off Mauritania (NW Africa). Biogeosciences Discussions, European Geosciences Union, 2008, 5 (1), pp.297-315. �hal-00297964�
BGD
5, 297–315, 2008 CH4 off Mauritania A. Kock et al. Title Page Abstract Introduction Conclusions References Tables Figures ◭ ◮ ◭ ◮ Back CloseFull Screen / Esc
Printer-friendly Version Interactive Discussion
EGU Biogeosciences Discuss., 5, 297–315, 2008
www.biogeosciences-discuss.net/5/297/2008/ © Author(s) 2008. This work is licensed under a Creative Commons License.
Biogeosciences Discussions
Biogeosciences Discussions is the access reviewed discussion forum of Biogeosciences
Methane emissions from the upwelling
area off Mauritania (NW Africa)
A. Kock1, S. Gebhardt1,*, and H. W. Bange1
1
Forschungsbereich Marine Biogeochemie IFM-GEOMAR, Leibniz-Institut f ¨ur Meereswissenschaften, D ¨usternbrooker Weg 20, 24105 Kiel, Germany
*
now at: Atmospheric Chemistry Dept., Max Planck Institute for Chemistry, Mainz, Germany Received: 4 December 2007 – Accepted: 10 December 2007 – Published: 24 January 2008 Correspondence to: H. W. Bange (hbange@ifm-geomar.de)
BGD
5, 297–315, 2008 CH4 off Mauritania A. Kock et al. Title Page Abstract Introduction Conclusions References Tables Figures ◭ ◮ ◭ ◮ Back CloseFull Screen / Esc
Printer-friendly Version Interactive Discussion
EGU
Abstract
Coastal upwelling regions have been indentified as sites of enhanced CH4 emissions
to the atmosphere. The coastal upwelling area off Mauritania (NW Africa) is one of the most biologically productive regions of the world’s ocean but its CH4 emissions have not been quantified so far. More than 1000 measurements of atmospheric and 5
dissolved CH4in the surface layer in the upwelling area off Mauritania were performed
as part of the German SOPRAN (Surface Ocean Processes in the Anthropocene) study during two cruises in March/April 2005 (P320/1) and February 2007 (P348). During P348 enhanced CH4 saturations of up to 179% were found close to the coast and
were associated with upwelling of South Atlantic Central Water. An area-weighted, 10
seasonally adjusted estimate yielded overall annual CH4 emissions in the range from 0.7 to 1.4 Gg CH4. Thus the upwelling area off Mauritania represents a regional hot
spot of CH4emissions but seems to be of minor importance for the global oceanic CH4
emissions.
1 Introduction
15
Atmospheric methane (CH4) is a greenhouse gas and plays an important role in the chemistry of the Earth’s atmosphere (WMO, 2007; IPCC, 2007). The world’s ocean, as a natural source of CH4, plays only a minor role in the global budget of atmospheric
CH4. Estimates of the global oceanic CH4 emissions differ considerably and range from 0.4–0.8 Tg CH4yr−1 for the open ocean (Bates et al., 1996; Kelley and Jeffrey, 20
2002) up to 11–18 Tg CH4yr −1
including coastal areas (Bange et al., 1994). Biolog-ically productive coastal regions cover only a small portion of the world’s ocean, but appear to be sites of significantly enhanced oceanic CH4 emissions (see e.g. Bange, 2006). Coastal upwelling regions such as found in the NW Arabian Sea, the coast off Oregon and off Namibia (SW Africa) have been identified as sites of enhanced CH4
25
BGD
5, 297–315, 2008 CH4 off Mauritania A. Kock et al. Title Page Abstract Introduction Conclusions References Tables Figures ◭ ◮ ◭ ◮ Back CloseFull Screen / Esc
Printer-friendly Version Interactive Discussion
EGU Monteiro et al., 2006). CH4 emissions from coastal upwelling areas are indirectly
linked to high primary productivity which favours CH4 formation during
methanogen-esis in sinking organic particles or in the sediments (Rehder et al., 2002; Sansone et al., 2001). CH4-enriched subsurface water masses are brought to the surface during the upwelling events providing a pathway to ventilate CH4 from the ocean to the
at-5
mosphere. The coastal upwelling area off Mauritania (NW Africa) is one of the most biologically productive regions of the world’s ocean but its CH4 emissions have not been quantified so far. Here we present the first study of CH4in the coastal upwelling
area of Mauritania during two cruises during the upwelling seasons in 2005 and 2007. On the basis of more than 1000 measurements of atmospheric and dissolved CH4 in 10
the surface layer we present an area-weighted, seasonally adjusted CH4flux estimate for the Mauritanian upwelling.
2 Study site description
The eastern tropical North Atlantic Ocean is an area with strongly differing hydrographic properties. On the one hand, the Canary and North Equatorial Currents form the east-15
ern part of the North Atlantic Subtropical Gyre which is a zone of low nutrient-supply and thus low primary production (Signorini et al., 1999). On the other hand nutrient-rich upwelled water masses feed zones of high biological productivity off the West African coast (Minas et al., 1986). Coastal upwelling along Mauritania occurs in consequence of offshore Ekman transport due to trade winds along the coastline (Mittelstaedt, 1986) 20
and shows a seasonality following the shifting of the Inter-Tropical Convergence Zone (ITCZ) throughout the year (Hagen, 2001). In the region between Cap Vert (10◦N) and Cap Blanc (21◦N) seasonal upwelling takes place during winter/spring with the southernmost extension in February (Schemainda et al., 1975; Nykjær and Van Camp, 1994; Mittelstaedt, 1986). Two different subsurface water masses have been identi-25
fied to feed the upwelling zone (Tomczak, 1980): North of 21◦N upwelled waters are mainly influenced by North Atlantic Central Water (NACW) while south of 21◦N they
BGD
5, 297–315, 2008 CH4 off Mauritania A. Kock et al. Title Page Abstract Introduction Conclusions References Tables Figures ◭ ◮ ◭ ◮ Back CloseFull Screen / Esc
Printer-friendly Version Interactive Discussion
EGU show properties of South Atlantic Central Water (SACW). Both NACW and SACW are
found between 100 and 800 m water depth. SACW is advected by a poleward under-current into the northern hemisphere and is nutrient enriched compared to the NACW (Minas et al., 1982).
3 Methods
5
The measurements were performed on board the research vessel Poseidon during the cruises P320/1 and P348. The cruise P320/1 was a pilot study of the German SOPRAN (Surface Ocean Processes in the Anthropocence) project and took place from 21 March to 7 April 2005. However, CH4 measurements were performed only
from 27 March to 30 March. The cruise P348 was part of the SOPRAN study and took 10
place from 8 to 26 February 2007. During P348 CH4 measurements were performed
in the period from 19 to 24 February. The cruise tracks are shown in Fig. 1.
CH4 was determined using a gas chromatograph equipped with a flame ionization detector. Details of the analytical system are described in Kock (2007) and Bange et al. (1996). Seawater was pumped continuously from a depth of approximately 3 m into 15
a shower type equilibrator developed by R. F. Weiss (Scripps Institution of Oceanog-raphy, La Jolla, CA). Concentrations and resulting saturation values were corrected for difference between the water temperature at the sea chest and the continuously recorded water temperature in the equilibrator. A series of measurements of seawater and ambient air followed by two standards (1.779±0.002 and 2.543±0.002 ppm CH4
20
in synthetic air) were repeated every 26 min (P320/1) and 22 min (P348). The gravi-metrically prepared gas standards (made by DEUSTE Steininger GmbH, M ¨uhlhausen, Germany) were calibrated against the actual NOAA standard scale (Dlugokencky et al., 2005) in the laboratories of the Max Planck Institute for Biogeochemistry in Jena, Germany.
25
The analytical precision, calculated for P320/1 as the ratio of the standard deviation of the atmospheric measurements to the mean atmospheric mole fractionwas ±1.1%.
BGD
5, 297–315, 2008 CH4 off Mauritania A. Kock et al. Title Page Abstract Introduction Conclusions References Tables Figures ◭ ◮ ◭ ◮ Back CloseFull Screen / Esc
Printer-friendly Version Interactive Discussion
EGU The mean relative errors of the CH4concentrations and saturations, were estimated to
±5%. Saturation values (expressed in %, i.e., 100%=equilibrium) were calculated by applying the solubility equation of Wiesenburg and Guinasso (1979). Continuous time series of seawater temperature (SST), salinity, and wind speed were obtained from the ship’s records. SST and salinity were measured by the ship’s thermosalinograph and 5
calibrated against CTD values.
4 Results and discussion
The mean atmospheric CH4 dry mole fraction during P320/1 in March 2005 was
1.84±0.02 ppm CH4 and is in agreement with the monthly mean of 1.821 ppm
mea-sured in March 2005 at the NOAA/ESRL atmospheric baseline observatory Iza ˜na on 10
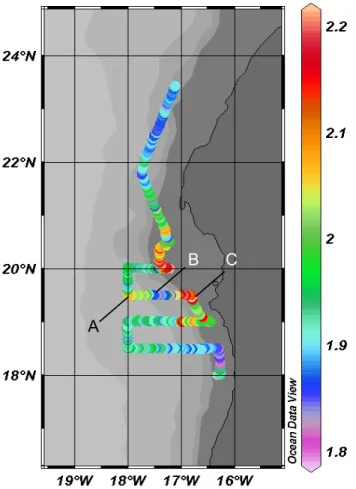
Tenerife (28.3◦N, 16.5◦W, elevation 2300 m) (Dlugokencky et al., 2007). In contrast to P320/1, the atmospheric CH4dry mole fractions during P348 in February 2007 were
highly variable and ranged from 1.8 to 2.5 ppm (Fig. 2). They are in reasonable agree-ment with the monthly mean CH4 dry mole fraction of 1.836±0.017 ppm measured
in February 2007 at Iza ˜na (E. Dlugokencky, personal communication]). During P348 15
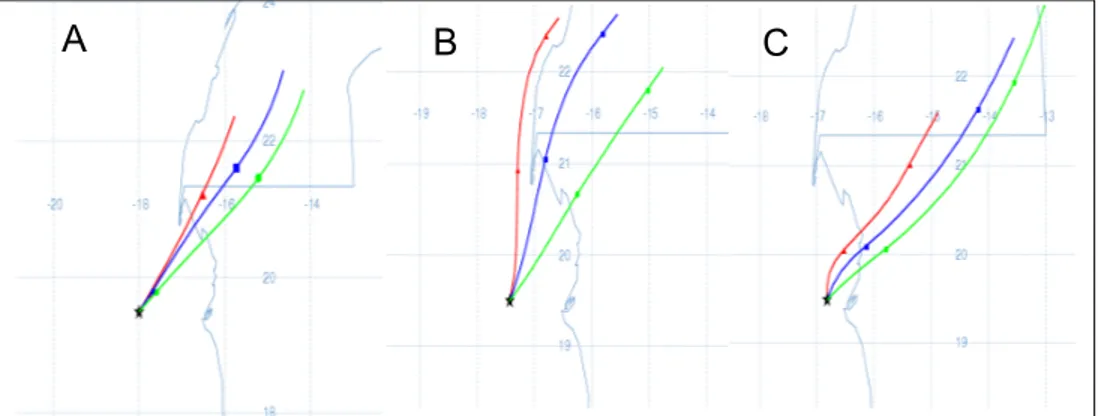
enhanced CH4 mole fractions were found between 19◦N and 21◦N. This could result from air masses, which became enriched with CH4 while crossing the Banc d’Arguin
area as indicated by air mass backward trajectories (Fig. 3). The shallow waters of the Banc d’Arguin ecosystem (water depths between 1–10 m) are very productive and, therefore, the sediments of the Banc d’Arguin should be rich in organic material and 20
favourable for enhanced emissions of CH4. With the assumption that an air mass at
20 m spent 6 h over the Banc d’Arguin area before being measured at the ship, the observed atmospheric increase of about 0.7 ppm requires a CH4 surface flux of about 100 µmol h−1m−2. This seems plausible given the fact that CH4 fluxes from
organic-rich tropical coastal environments such as mangroves can be >1000 µmol h−1m−2 25
(Allen et al., 2007; Biswas et al., 2007). Unfortunately, CH4 measurements from the inner Banc d’Arguin are not available.
BGD
5, 297–315, 2008 CH4 off Mauritania A. Kock et al. Title Page Abstract Introduction Conclusions References Tables Figures ◭ ◮ ◭ ◮ Back CloseFull Screen / Esc
Printer-friendly Version Interactive Discussion
EGU Backward trajectories for P320/1 indicated that the air masses measured during
P320/1 did cross the Banc d’Arguin as well (Quack et al., 2007), however, the dis-tance from the ship positions to the Banc d’Arguin was considerably larger compared to P348. Thus we speculate that either the CH4source in the Banc d’Arguin area was weaker in 2005 or that the air masses were depleted in CH4 due to mixing or
atmo-5
spheric decomposition before arriving at the ship. During both cruises we did not find indications that the atmospheric values have been influenced by possible contamina-tion due to CH4emissions from the ship’s diesel engines (Sinha et al., 2003).
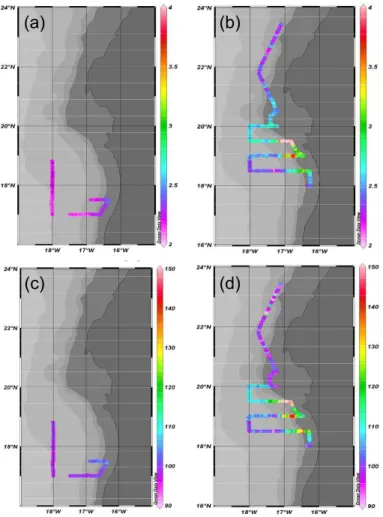
In March 2005 dissolved CH4 concentrations were rather uniform and ranged from
2.1 to 2.5 nmol L−1 with saturations close to the equilibrium with the atmosphere (98– 10
106%) (Fig. 4). During P348 in February 2007 dissolved CH4 concentrations were much more variable and ranged from 2.1 to 4.9 nmol L−1. CH4saturations ranged up
179% (Fig. 4). The majority of low CH4saturations were found in the western part of the
transect at 18.5◦N and north of 20◦N, whereas significantly enhanced CH4saturations were mainly found close to the coast between 19◦ to 19.5◦N (Fig. 4).
15
Our open ocean data are in good agreement with CH4 concentrations (about
2 nmol L−1) measured along 20◦W (Rhee, 2000). However, our open ocean concen-trations are lower than those observed by Forster et al. (2007), who found a mean CH4 concentration of 3±0.7 nmol L
−1
(corresponding to a mean CH4 saturation of
156±29%) in the surface layer at three stations off Mauritania along 18◦W in Septem-20
ber 2003. The discrepancy might results from seasonal and/or interannual differences (Nykjær and Van Camp, 1994) because the measurements by Rhee (2000) and Forster et al. (2007) were performed in September/October 1998 and September 2003, re-spectively.
Figure 5 shows a plot of SST vs. CH4 saturation to illustrate the role of upwelling
25
processes. It is obvious that the enhanced CH4 saturations during P348 were
as-sociated with low SST indicating upwelled water masses. In order to analyze the effects of mixing between open ocean and upwelled water masses during P348, we applied a simple mixing model by defining two mixing endmembers: open ocean water
BGD
5, 297–315, 2008 CH4 off Mauritania A. Kock et al. Title Page Abstract Introduction Conclusions References Tables Figures ◭ ◮ ◭ ◮ Back CloseFull Screen / Esc
Printer-friendly Version Interactive Discussion
EGU masses with SST >19◦C and upwelled water masses with SST <19◦C and CH4
con-centrations >3.9 nmol L−1. The linear correlation of these data points has a slope of −0.75±0.28 nmol L−1K−1. The CH4/SST relationship from the Mauritanian upwelling is
in the range of comparable CH4/SST relationships reported from the NW Arabian Sea upwelling area (−0.09 nmol L−1K−1) (Bange et al., 1998) and from the upwelling area 5
off Oregon (–1.5 nmol L1K−1, as estimated from Fig. 5 in Rehder et al. 2002). Thus, the potential CH4upwelling “efficiency” off Mauritania in February 2007 was moderate
compared to the upwelling off Oregon but significantly higher than in the NW Arabian Sea.
The hydrographic properties of the subsurface waters together with CH4saturations
10
are shown in Fig. 6. At temperatures <19◦C, most data points lie between the T/S lines of NACW and SACW, suggesting that they were resulting from mixing of the two water masses. While the water with enhanced CH4 saturations (i.e. those found close to
Banc d’Arguin) show properties close to the SACW, water with CH4saturations around 100% were associated with NACW. Thus, we conclude that the observed enhanced 15
CH4 concentrations mainly originated from water masses with a major contribution of
SACW. A possible contribution of CH4 enriched water masses originating from the Banc d’Arguin (characterised by surface salinities of >37 (Mittelstaedt, 1986; Peters, 1976) is not visible in Fig. 6 and thus seems to be unlikely at the time of our cruises.
5 CH4air-sea exchange
20
The CH4 exchange flux density, F in pmol m −2
s−1, can be parameterized as
F =kw(Cw–Ca), where kw is the gas transfer coefficient, Cw is the seawater
concentra-tion, and Cais the equilibrium water concentration calculated using the corresponding atmospheric dry mole fraction. To calculate kw, we used the tri-linear kw/wind speed
relationship from Liss and Merlivat (1986) (hereinafter referred to as LM86) or, alter-25
natively, the quadratic kw/wind speed relationship established by Wanninkhof (1992) (hereinafter referred to as W92). The coefficients kw were adjusted by multiplying with
BGD
5, 297–315, 2008 CH4 off Mauritania A. Kock et al. Title Page Abstract Introduction Conclusions References Tables Figures ◭ ◮ ◭ ◮ Back CloseFull Screen / Esc
Printer-friendly Version Interactive Discussion
EGU (Sc/600)−n(n=2/3 for wind speeds ≤3.6 m s−1and n=0.5 for wind speeds >3.6 m s−1)
for LM86 and (Sc/660)−0.5 for W92. Sc is the Schmidt number for CH4 and was
cal-culated using empirical equations for the kinematic viscosity of seawater (Siedler and Peters, 1986) and the diffusivity of CH4 in water (J ¨ahne et al., 1987). The measured
wind speeds were normalized to 10 m height by using the relationship of Garratt (1977). 5
In order to estimate the CH4 emissions from the Mauritanian upwelling we pooled our data into the two categories: open ocean which includes data with SST >19◦C and upwelling-influenced coastal data with SST <19◦C. Then we calculated the mean flux densities and emissions for the two categories (Table 1). The CH4 emissions from the coastal upwelling off Mauritania (0.5–0.9 Gg CH4) are comparable with the emissions
10
from the coastal upwelling in the NW Arabian Sea (0.5–0.9 Gg CH4, calculated for a
4 months upwelling period) (Bange et al., 1998). The annual CH4 emissions, calcu-lated as the sum of the individual emssions during the upwelling and the non-upwelling seasons, range from 0.7 to 1.4 Gg CH4 (Table 1) representing about 0.1–0.4% of the
global open ocean emissions of 400–800 Gg yr−1(Bates et al., 1996; Kelley and Jeffrey, 15
2002).
6 Summary
Atmospheric CH4 dry mole fractions during the cruise P348 in February 2007 were
highly variable and were most probably influenced by high CH4emissions from the
ad-jacent shallow waters of the Banc d’Arguin. In March 2005 (cruise P320/1) dissolved 20
CH4 concentrations were rather uniform whereas in February 2007 (cruise P348)
dis-solved CH4 concentrations were much more variable. During P348 CH4 saturations
ranged up 179 %. The significantly enhanced CH4saturations were mainly found close to the coast between 19◦to 19.5◦N and were associated with upwelling of SACW. The potential CH4upwelling “efficiency” off Mauritania in Februray 2007 was moderate
com-25
pared to the upwelling off Oregon but significantly higher than in the NW Arabian Sea. The overall annual CH4 emissions were estimated to range from 0.7 to 1.4 Gg CH4.
BGD
5, 297–315, 2008 CH4 off Mauritania A. Kock et al. Title Page Abstract Introduction Conclusions References Tables Figures ◭ ◮ ◭ ◮ Back CloseFull Screen / Esc
Printer-friendly Version Interactive Discussion
EGU Thus the upwelling area off Mauritania represents a regional hot spot but is of minor
importance for the global oceanic CH4emissions.
Acknowledgements. We are indepted to all participants of P320/1 and P348 for their
excel-lent collaboration and we acknowledge the invaluable support of the captain and crew of R/V Poseidon. We thank I. Goertz for building the CH4 pump rack and we thank A. Jordan for 5
the calibration of our standard gases. E. Dlugokencky generously made unpublished CH4 data available for us. We thank the authorities of Mauritania for permission to work in their exclusive economic zone. The authors gratefully acknowledge the NOAA Air Resources Lab-oratory (ARL) for the provision of the HYSPLIT transport and dispersion model used in this publication. Cruise P320/1 was supported by the Deutsche Forschungsgemeinschaft (DFG) 10
with grant BA1990/6. Cruise P348 was part of the joint project SOPRAN and was funded by Bundesministerium f ¨ur Bildung und Forschung (BMBF) with grant 03F0462A. This work was supported by the Forschungsbereich Marine Biogeochemie of IFM-GEOMAR, Kiel.
References
Allen, D. E., Dalal, R. C., Rennenberg, H., Meyer, R. L., Reeves, S., and Schmidt, S.: Spatial 15
and temporal variation of nitrous oxide and methane flux between subtropical mangrove sediments and the atmosphere, Soil Biol. Biochem., 39, 622–631, 2007.
Bange, H. W., Bartell, U. H., Rapsomanikis, S., and Andreae, M. O.: Methane in the Baltic and North Seas and a reassessment of the marine emissions of methane, Global Biogeochem. Cy., 8, 465–480, 1994.
20
Bange, H. W., Rapsomanikis, S., and Andreae, M. O.: The Aegean Sea as a source of atmo-spheric nitrous oxide and methane, Mar. Chem., 53, 41–49, 1996.
Bange, H. W., Ramesh, R., Rapsomanikis, S., and Andreae, M. O.: Methane in the surface waters of the Arabian Sea, Geophys. Res. Lett., 25, 3547–3550, 1998.
Bange, H. W.: Nitrous oxide and methane in European coastal waters, Estuarine and Coastal 25
Shelf Science, 70, 361–374, 2006.
Bates, T. S., Kelly, K. C., Johnson, J. E., and Gammon, R. H.: A reevaluation of the open ocean source of methane to the atmosphere, J. Geophys. Res., 101, 6953–6961, 1996.
Biswas, H., Mukhopadhyay, S. K., Sen, S., and Jana, T. K.: Spatial and temporal patters of 305
BGD
5, 297–315, 2008 CH4 off Mauritania A. Kock et al. Title Page Abstract Introduction Conclusions References Tables Figures ◭ ◮ ◭ ◮ Back CloseFull Screen / Esc
Printer-friendly Version Interactive Discussion
EGU methane dynamics in the tropical mangrove dominated estuary, NE coast of Bay of Bengal,
India, J. Mar. Syst., 68, 55–64, 2007.
Dlugokencky, E. J., Myers, R. C., Lang, P. M., Masarie, K. A., Crotwell, A. M., Thoning, K. W., Hall, B. D., Elkins, J. W., and Steele, L. P.: Conversion of NOAA atmospheric dry air CH4 mole fractions to a gravimetrically prepared standard scale, J. Geophys. Res., 110, D18306, 5
doi:10.1029/2005JD006035, 2005.
Dlugokencky, E. J., Lang, P. M., and Masarie, K. A.: Atmospheric methane dry air mole fractions from the NOAA ESRL Carbon Cylce Cooperative Global Air Sampling Network, 1983–2006, version 2007-07-31,ftp://ftp.cmdl.noaa.gov/ccg/ch4/flask/month, 2007.
Draxler, R. R. and Rolph, G. D.: HYSPLIT (HYbrid Single-Particle Lagrangian Integrated Trajec-10
tory) model access via NOAA ARL READY website (http://www.arl.noaa.gov/ready/hysplit4.
html), NOAA Air Resources Laboratory, Sliver Spring, MD, USA, 2003.
Forster, F. G., Upstill-Goddard, R. C., and Uher, G.: Nitrous oxide and methane in the Atlantic Ocean between 50◦
N and 52◦
S: Latitudinal distribution and sea-to-air flux, Deep-Sea Res. Part II, in press, 2007.
15
Garratt, J. R.: Review of the drag coefficients over oceans and continents, Mon. Weather Rev., 105, 915–929, 1977.
Hagen, E.: Northwest African upwelling scenario, Oceanol. Acta, 24, S113–S127, 2001. IPCC: Climate Change 2007: The Physical Science Basis. Contribution of Working Group I to
the Fourth Assessment Report of the Intergovernmental Panel on Climate Change, Cam-20
bridge University Press, Cambridge, UK and New York, NY, USA, 996 pp., 2007.
J ¨ahne, B., Heinz, G., and Dietrich, W.: Measurements of the diffusion coefficients of sparingly soluble gases in water, J. Geophys. Res., 92, 10 767–10 776, 1987.
Kelley, C. A. and Jeffrey, W. H.: Dissolved methane concentration profiles and air-sea fluxes from 41◦S to 27◦N, Global Biogeochem. Cy., 16, 1040, doi:10.1029/2001GB001809, 2002. 25
Kock, A.: Methane measurements in selected ocean areas: Eastern tropical North Atlantic Ocean and southwestern Labrador Sea, Diploma thesis, Kiel University, Kiel, 106 pp., 2007. Liss, P. S. and Merlivat, L.: Air-sea exchange rates: introduction and synthesis, in: The Role of
Air-Sea Exchange in Geochemical Cycling, edited by: Buat-M ´enard, P., Series C: Mathem. and Phys. Sciences, D. Reidel Publishing Company, Dordrecht, 113–127, 1986.
30
Longhurst, A.: Ecological geography of the sea, Academic Press, San Diego, 398 pp., 1998. Minas, H. J., Codispoti, L. A., and Dugdale, R. C.: Nutrients and primary production in the
BGD
5, 297–315, 2008 CH4 off Mauritania A. Kock et al. Title Page Abstract Introduction Conclusions References Tables Figures ◭ ◮ ◭ ◮ Back CloseFull Screen / Esc
Printer-friendly Version Interactive Discussion
EGU 182, 1982.
Minas, H. J., Minas, M., and Packard, T. T.: Productivity in upwelling areas deduced from hydrographic and chemical fields, Limnol. Oceanogr., 31, 1182–1206, 1986.
Mittelstaedt, E.: Upwelling regions, in: Landoldt-B ¨ornstein, New Series, Vol. 3, Oceanography, edited by: S ¨undermann, J., Springer Verlag, Berlin, 135–166, 1986.
5
Monteiro, P. M. S., Van der Plas, A., Mohrholz, V., Mabille, E., and Pascall, A.: Variability of natural hypoxia and methane in coastal upwelling system: Oceanic physics or shelf biology?, Geophys. Res. Lett., 33, L16614, doi:10.1029/2006GL026234, 2006.
Nykjær, L. and Van Camp, L.: Seasonal and interannual variability of coastal upwelling along northwest Africa and Portugal from 1981 to 1991, J. Geophys. Res., 99, 14 197–14 207, 10
1994.
Owens, N. J. P., Law, C. S., Mantoura, R. F. C., Burkill, P. H., and Llewellyn, C. A.: Methane flux to the atmosphere from the Arabian Sea, Nature, 354, 293–296, 1991.
Peters, H.: The spreading of water masses of the Banc d’Arguin in the upwelling area off the northern Mauritanian coast, Meteor. Forschung-Ergebnisse A, 18, 78–100, 1976.
15
Quack, B., Atlas, E., Petrick, G., and Wallace, D. W. R.: Bromoform and dibromomethane above the Mauritanian upwelling: Atmospheric distributions and oceanic emissions, J. Geophys. Res., 112, D09312, doi:10.1029/2006JD007614, 2007.
Rehder, G., Collier, R. W., Heeschen, K., Kosro, P. M., Barth, J., and Suess, E.: Enhanced marine CH4 emissions to the atmosphere off Oregon caused by coastal upwelling, Global 20
Biogeochem. Cy., 16, doi:10.1029/2000GB001391, 2002.
Rhee, T. S.: The process of air-water gas exchange and its application, PhD thesis, Office of Graduate Studies, Texas A and M University, College Station, 272 pp., 2000.
Sansone, F. J., Popp, B. N., Gasc, A., Graham, A. W., and Rust, T. M.: Highly elevated methane in the eastern tropical North Pacific and associated isotopically enriched fluxes to the atmo-25
sphere, Geophys. Res. Lett, 28, 4567–4570, 2001.
Schemainda, R., Nehring, D., and Schulz, S.: Ozeanologische Untersuchungen zum Produk-tionspotential der norwestafrikanischen Wasserauftriebsregionen 1970–1973, Geod ¨atische und Geophysikalische Ver ¨offentlichungen Reihe IV, 1–88, 1975.
Siedler, G. and Peters, H.: Properties of sea water, in: Oceanography, edited by: S ¨undermann, 30
J., Landolt-B ¨ornstein, New Series, Springer Verlag, Berlin, 233–264, 1986.
Signorini, S. R., Murtugudde, R. G., McClain, C. R., Christian, J. R., Picaut, J., and Busalachhi, A. J.: Biological and physical signatures in the tropical and equatorial Atlantic, J. Geophys.
BGD
5, 297–315, 2008 CH4 off Mauritania A. Kock et al. Title Page Abstract Introduction Conclusions References Tables Figures ◭ ◮ ◭ ◮ Back CloseFull Screen / Esc
Printer-friendly Version Interactive Discussion
EGU Res., 104, 18 367–18 382, 1999.
Sinha, P., Hobbs, P. V., Yokelson, R. J., Christian, T. J., Kirchstetter, T. W., and Bruintjes, R.: Emissions of trace gases and particles from two ships in the southern Atlantic Ocean, Atmos. Environ., 37, 2139–2148, 2003.
Tomczak, M.: The distribution of water masses at the surface as derived from T-S diagram 5
analysis in the CINECA area, Rapp. P.-v. R ´eun. Cons. Int. Explor. Mer, 180, 48–49, 1980. Tomczak, M. and Godfrey, J. S.: Regional oceanography: An introduction, 2nd Edition, Daya
Publishing House, Delhi, India, 391 pp., 2003.
Wanninkhof, R.: Relationship between wind speed and gas exchange over the ocean, J. Geo-phys. Res., 97, 7373–7382, 1992.
10
Wiesenburg, D. A. and Guinasso Jr., N. L.: Equilibrium solubilities of methane, carbon monox-ide, hydrogen in water and seawater, J. Chem. Eng. Data, 24, 356–360, 1979.
WMO: Scientific assessment of ozone depletion: 2006, WMO, World Meteorological Organiza-tion, Geneva, CH, 572 p., 2007.
BGD
5, 297–315, 2008 CH4 off Mauritania A. Kock et al. Title Page Abstract Introduction Conclusions References Tables Figures ◭ ◮ ◭ ◮ Back CloseFull Screen / Esc
Printer-friendly Version Interactive Discussion
EGU
Table 1. CH4emission estimate.
Areaa, Mean flux density Emissons, 1012m−2 pmol m−2s−1 Gg
Season Upwellingb Non-upwellingb Upwellingb Non-upwellingb
Coast 0.3 6.7/11 − 0.5/0.9 −
Open ocean 0.5 2.8/5.4 − 0.2/0.4 −
Coast + open ocean 0.8 − 2.8/5.4c − 0.04/0.09
a
We assumed a that upwelling occurs in 50 km wide band close to the coast which extends roughly from 24◦
N and 18◦
N, yielding 0.3×10¹²m2. The total area of 0.8×10¹²m2 is the area given by Forster et al. (2007) for the eastern (Canary) coastal province as defined by Longhurst (1998).
b
First value stands for flux densities and emissions based on Liss and Merlivat (1986), second value stands for flux densities and emissions based on Wanninkhof (1992). We assumed a mean duration of 6 months for both the upwelling and the non-upwelling seasons.
c
Adopted form the open ocean measurements during the upwelling season.
BGD
5, 297–315, 2008 CH4 off Mauritania A. Kock et al. Title Page Abstract Introduction Conclusions References Tables Figures ◭ ◮ ◭ ◮ Back CloseFull Screen / Esc
Printer-friendly Version Interactive Discussion
EGU
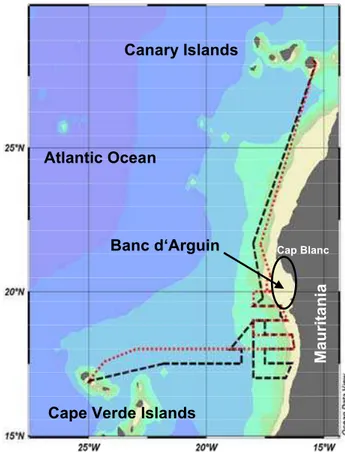
Banc d‘Arguin Cap Blanc
Canary Islands
Cape Verde Islands
M a u ri ta n ia Atlantic Ocean
Fig. 1. Cruise tracks of P320/1 (black, March/April 2005) and P348 (red, February 2007) in the eastern tropical North Atlantic Ocean.
BGD
5, 297–315, 2008 CH4 off Mauritania A. Kock et al. Title Page Abstract Introduction Conclusions References Tables Figures ◭ ◮ ◭ ◮ Back CloseFull Screen / Esc
Printer-friendly Version Interactive Discussion
EGU A
B C
Fig. 2. Atmospheric CH4dry mole fraction during P348. The capital letters refer to the air mass backward trajectories shown in Fig. 3.
BGD
5, 297–315, 2008 CH4 off Mauritania A. Kock et al. Title Page Abstract Introduction Conclusions References Tables Figures ◭ ◮ ◭ ◮ Back CloseFull Screen / Esc
Printer-friendly Version Interactive Discussion
EGU
A
B
C
Fig. 3. Selected 12 h backward air mass trajectories. Trajectories were calculated with the NOAA HYSPLIT on-line transport and dispersion model (Draxler and Rolph, 2003). The start-ing points and times correspond to the ships position as depicted with the capital letters in Fig. 2. Red trajectory, 20 m above sea level (a.s.l), blue trajectory, 200 m a.s.l., and green trajectory, 500 m a.s.l.
BGD
5, 297–315, 2008 CH4 off Mauritania A. Kock et al. Title Page Abstract Introduction Conclusions References Tables Figures ◭ ◮ ◭ ◮ Back CloseFull Screen / Esc
Printer-friendly Version Interactive Discussion
EGU
(a) (b)
(c) (d)
Fig. 4. CH4 concentrations (in nmol L1) during P320/1 (a) and P348 (b) and CH4saturations (in %) during P320/1 (c) and P348 (d).
BGD
5, 297–315, 2008 CH4 off Mauritania A. Kock et al. Title Page Abstract Introduction Conclusions References Tables Figures ◭ ◮ ◭ ◮ Back CloseFull Screen / Esc
Printer-friendly Version Interactive Discussion
EGU
Fig. 5. CH4 concentrations vs. SST. Open circles represent data from P348, open triangles represent data from P320/1. The solid line is the dissolved CH4 equilibrium concentration calculated with an atmospheric CH4dry mole fraction of 1.83 ppm. The dashed line stands for the linear correlation between the data from the open ocean and the upwelling as defined in the text; y=−0.752x +17.24 (r=0.923, n=91, α=0.01).
BGD
5, 297–315, 2008 CH4 off Mauritania A. Kock et al. Title Page Abstract Introduction Conclusions References Tables Figures ◭ ◮ ◭ ◮ Back CloseFull Screen / Esc
Printer-friendly Version Interactive Discussion EGU
M
e
th
a
n
e
s
a
tu
ra
tio
n
[
%
]
Fig. 6. T/S diagram and CH4 saturations from the P348. The T/S curves of the predominant water masses, NACW and SACW, are shown as straight lines (Tomczak and Godfrey, 2003).