513
http://journals.tubitak.gov.tr/zoology/ © TÜBİTAK
doi:10.3906/zoo-1705-55
Discriminant-based study of the shell morphometric relationships of Patella caerulea
(Gastropoda: Prosobranchia) of the western Mediterranean Sea
Zoheir BOUZAZA1,2,*, Karim MEZALI2
1Department of Biology, Faculty of Natural Sciences and Life, Abedelhamid Ibn Badis University, Mostaganem, Algeria. 2Protection, Valorization of Littoral Marine Resources and Molecular Systematic Laboratory, Department of Marine Sciences and
Aquaculture, Faculty of Natural Sciences and Life, Abedelhamid Ibn Badis University, Mostaganem, Algeria
* Correspondence: zoheir.bouzaza@univ-mosta.dz 1. Introduction
Because of their wide distribution in the world and their biological and ecological importance, marine gastropod molluscs have interested scientists for a long time. They are present in all marine habitats and are essential for maintaining trophic webs. They are situated at several levels in the food chain, which increases their determining role in the functioning of marine ecosystems (Hakenkamp and Morin, 2000). In addition, these marine invertebrates deeply affect the structure of communities by controlling the growth of marine algae (Branch, 1981).
The prosobranch limpets belonging to the genus Patella are very frequent on the rocky shores of the intertidal area (Ridgway et al., 1998). They are also present in the infralittoral fringe (Fekih and Gougerot, 1974). All existing species of the genus Patella are limited to the northeast Atlantic and the Mediterranean Sea, and constitute a monophyletic group (Ridgway et al., 1998; Koufopanou et al., 1999). Four species of limpets belonging to the genus Patella are present in the Mediterranean Sea: Patella
ferruginea (Gmelin, 1791); Patella rustica (Linnaeus 1758); Patella caerulea (Linnaeus 1758); and Patella ulyssiponensis
(Gmelin, 1791) (Cretella et al., 1994). Among these species, Patella caerulea is considered endemic to the Mediterranean Sea (Christiaens, 1973; Frenkiel, 1975). This limpet is present on the rocky shores, often in a calm zone, up to a few meters deep, preferring a location where humidity is almost permanent. The limpet must erode its shell to adapt to the irregularities of the substratum. This process allows this species to store water when emerged (Guelorget and Perthuisot, 1983).
Patella caerulea is a common grazer that feeds on
microalgae (diatoms and Cyanophyceae) and other encrusting algae (e.g., Corallina elongata, Ulva lactuca) (Della Santina et al., 1993; Silva et al., 2008). Patella
caerulea is a hermaphrodite protandric species. Spawning
occurs from autumn to spring along the southwestern coast of Italy (Bacci, 1947).
The systematic distinction between all species of the genus Patella (including P. caerulea) is mainly based on the morphology of their shells. The great morphological plasticity of the individuals of each species, different evolutionary changes, and strong subjectivity has led to a wealth of named species and subspecies and caused
Abstract: Our work is a contribution to the study of the morphometric dissimilarity of the limpet Patella caerulea (Linnaeus, 1758)
inhabiting the seashore of the western Mediterranean Sea. For this study, 438 individuals of this species were sampled in 24 stations and separated into 2 groups of individuals: the first group (G1) originating from the upper infralittoral and the lower mediolittoral areas, and the second group (G2) originating from the upper mediolittoral area. The biometry of P. caerulea has been studied by considering the total length (L), the total width (W), and the total height (H) of the shell. These parameters revealed a strong positive correlation, and were used for the principal component analysis (PCA). Other combined parameters (L/W, L/H, and W/H) were added for the discriminant function analysis (DFA). Both multivariate analyses showed that both groups (G1 and G2) were well separated. The morphometric survey based on the calculation of the geometric mean (GM) and the gibbosity index (GIB) revealed the existence of a morphological dissimilarity between the shells of groups G1 (flattened and stocky) and G2 (high and short). This morphological dissimilarity is discussed and compared with the results of other works on the same species and other related species.
Key words: Patella caerulea, morphometric, plasticity, morphological dissimilarity, western Mediterranean Sea
Received: 26.05.2017 Accepted/Published Online: 17.07.2018 Final Version: 17.09.2018
disagreement on their morphological diversity and geographical distribution (Fischer-Piette and Gaillard, 1959). This morphological plasticity is very distinct in P.
caerulea. Indeed, this species possesses adaptive strategies
for important variations in ecological factors (Vermeij, 1973; Branch, 1981). This is why morphological analysis of the organisms is essential for highlighting evolutionary changes (Bachnou and Boughdiri, 2005). This kind of analysis can give us a better approach for the distinction of P. caerulea shells.
Several studies have been carried out on the morphological diversity of genus Patella and other related species around the world such as the study by Tablado and Lopez-Gappa (2001) on the morphometric diversity of the pulmonate limpet Siphonaria lessoni in the province of Buenos Aires (Argentina), and the study by Jerardino and Navarro (2008) on the shell morphometrics of limpet species (genera Cymbula and Scutelastra) on the South African coasts. In the southwestern Mediterranean Sea, similar studies have been made on several species of the genus Patella (P. ferruginea, P. caerulea, P. rustica) and the genus Cymbula (C. nigra) (Espinosa and Ozawa, 2006; Mezali, 2007; Rivera-Ingraham et al., 2011; Belkhodja and Romdhane, 2012; Bouzaza, 2012). These studies have shown several morphotypes that may belong to the same species. This intraspecific polymorphism could be influenced by the type of substratum, which has great importance on the depth of fixation of the limpets (Tablado and Lopez-Gappa, 2001; Pandita et al., 2013), the immersion time of the limpet species, and the surrounding physicochemical factors (Jarne et al., 1988; Moreteau and Vicente, 1988; Belkhodja and Romdhane, 2012).
The aim of our study is to determine whether the external factors of 2 paralic environments could influence the morphology of P. caerulea.
2. Materials and methods 2.1. Study area
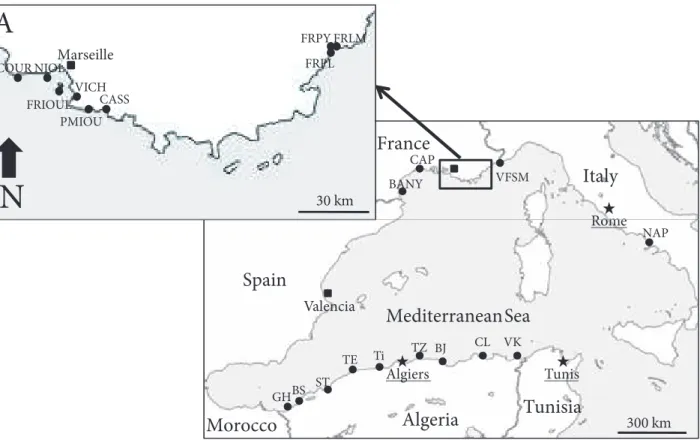
Our survey was conducted at 24 stations on the western Mediterranean coast (Figure 1, Table 1) using a random sampling of a batch of 438 individuals of P. caerulea between October 2014 and May 2015. The individuals were collected using a penknife, and then placed in plastic bags labeled and numbered to indicate their habitat (i.e., mediolittoral and infralittoral fringes).
The samples were separated into 2 groups of individuals. The first group (G1) includes 186 individuals originating from the upper infralittoral and the lower mediolittoral levels; the second group (G2) is composed of 252 individuals originating from the upper mediolittoral level (Table 1). All the stations considered in the present work have a hard substratum with variable slope. The difference in the type of substratum is not very marked
between the stations of group G1 (constantly immersed in water) and the stations of group G2 (immersed occasionally), since G1 is the continuity of G2 in depth. However, the fact that the G1 area is constantly submerged makes its substrate easier for the limpet to scrape in order to assimilate nutrients. All sampled individuals were taken from natural areas, except for the individuals originating from the harbor of La Vielle Chapel (VICH) station, which were collected from a dam constructed between 1964 and 1972 (Data from INSEE, France; Table 1).
2.2. Morphometric and statistical study
For each individual of P. caerulea, the biometric measurements (the shell length [L], the maximal width of the shell [W], and the maximal height of the shell [H]) were carried out using a caliper (±0.01 mm) (Tablado and Lopez-Gappa, 2001; Jerardino and Navarro, 2008; Rivera-Ingraham et al., 2011; Saucède et al., 2013). Other ratios such as L/W, L/H, and W/H were calculated (Jarne et al., 1988; Rivera-Ingraham et al., 2011) accordingly.
The correlation between L, W, and H of all P. caerulea individuals (G1 + G2) was realized using R 3.2.2 software. The Kolmogorov–Smirnov nonparametric test was applied to confirm the normality of our samples at each station. In order to see if the 2 groups (G1 and G2) had significantly different values from each other, a t-test was performed on each of the parameters (L, W, H, L/W, L/H, and W/H) using Xlstat (2009) software. The same software was used to achieve principal component analysis (PCA) of the studied variables and stations. To check the adherence of the individuals of each station to their respective group (G1 or G2), a discriminant function analysis (DFA) was realized. Thus, a Box’s M-test was performed, and then the Wilk’s Lambda parameter (Δ-Wilk) was calculated with a Rao approximation (Saporta, 2006). To see if the stations were classified correctly into their groups, a classification was performed following the analyses. A one-dimensional test of class means was established in order to determine the most discriminative parameter. All of these analyses were performed using IBM SPSS 20.0 Statistics software.
Regarding the morphometric survey, we calculated the geometric mean (GM) according to the equation: GM = ³√ (L × W × H) (Matousek and Nesetril, 2004), and the gibbosity index (GIB) according to the equation: GIB = H√ (L × W) (David and Fouray, 1984). The higher the GIB is, the higher and shorter the shell shape; the shell shape is stocky and flattened if the GIB is low (David and Fouray, 1984). A morphometric analysis of all sampled individuals was conducted by studying the regression between
GM and the parameters L, W, H, and GIB using R 3.2.2
software. A Levene test was performed on the GIB index in order to test the homogeneity of the intragroup variances within G1 and G2. A t-test was carried out in order to determine the differences between G1 and G2 based on the parameters L, W, H, and GIB.
3. Results
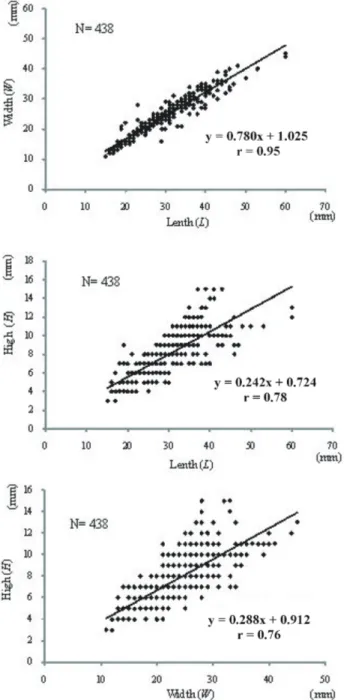
The biometric relationships established for the shell of P.
caerulea showed a strong correlation between the length
and the width (W–L), the height and the length (H–L), and the height and the width (H–W) (all P < 0.001; Figure 2). The mean length and the mean width of all individuals of group G1 are respectively higher than those of group G2 (31.183 ± 7.960 > 27.496 ± 5.765; 25.591 ± 6.309 > 22.333 ± 4.874, respectively). However, the mean height of all individuals of group G1 is lower than that of the individuals in group G2 (7.516 ± 2.041 < 7.944 ± 2.243).
The results of the t-test between the 2 groups (G1 and G2) established for the parameters L, W, H, L/H, and W/H are highly significant (P < 0.01). In contrast, the parameter
L/W is not significant (P = 0.06). The mean value of L/W for G1 is almost equal to that of G2 (1.221 ~ 1.237,
respectively). This shows that the L/W parameter remains more or less stable regardless of the depth of sampling for
P. caerulea.
The PCA of the variables and individuals is represented in Figure 3A. Contributions of each variable (L, W, and
H) to the PCA axes (F1 to F3) are shown in Table 2. The
first and second axes together explain 96.38% of the total variance (F1: 80.55%, F2: 15.83%; Figure 3A); however, axis F3 explains only 3.62% of the variance, and shows no
correlation with any variables. The parameters L, W, and
H have positive and very high contributions to F1 (which
could be interpreted as a size factor; Table 2), and show highly significant correlation coefficients (0.97, 0.96, and 0.87, respectively; all P < 0.001). Moreover, L, W, and H are positively correlated with each other and considered as size variables (Nakhlé, 2003; Espinosa and Ozawa, 2006; Rivera-Ingraham et al., 2011; Belkhodja and Romdhane, 2012). The influence of the H parameter is fairly well marked on axis F2 with a positive correlation coefficient (r = 0.5; P = 0.02), while L and W show respectively a low and nonsignificant correlation with the same axis (–0.21, –0.22; all P > 0.05). In addition, the qualitative aspects of the 2 groups (G1 and G2) show a strong correlation on the F2 axis (r = 0.79; P < 0.001). As a result, the F2 axis may provide more information on the aspect of P.
caerulea shell shape. The centroids of the 2 groups (G1
and G2) are well separated along the second axis F2 with the closeness of the station (VICH) to the centroid of G2 (Figure 3A), even if this station initially belonged to G1. After checking the homoscedasticity of the covariance matrices by Box’s M-test (M = 140.08; P < 0.001), a DFA was achieved (Figure 3B). The obtained Wilk’s Δ value is equal to 0.151 (P < 0.001). This value indicates that there is good discrimination between G1 and G2 and that their
BANY CAP VFSM Rome
Italy
France
COUR NIOL FRIOULVICH PMIOU CASS FRPL FRPY FRLM 30 kmN
MarseilleA
300 km NAP CL TZ Ti TE GHBS ST VK BJ Algiers Tunis Rome ValenciaAlgeria
Tunisia
Morocco
Spain
MediterraneanSea
Figure 1. Study area showing the sampling stations (black dots). See Table 1 for abbreviations. A: Details of the French Mediterranean coast.
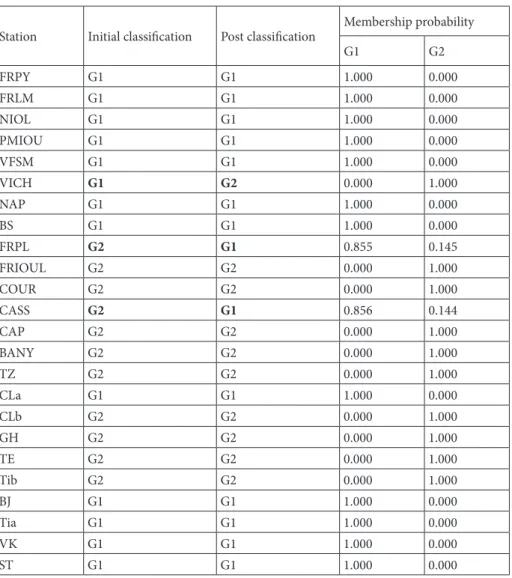
centroids are well separated on axis F1, which contains more than 99.99% of the information (~100%; Figure 3B). The DFA shows that both groups (G1 and G2) are well separated and their centroids are very distant. The classification following the analyses (Table 3) indicates that the individuals originating from the VICH station are very close to the centroid of G2 and should be classified therein. In contrast, the individuals of the 2 stations FRPL and CASS were reclassified into group G1 (Table 3).
The confusion matrix shows a high classification rate (87.50%) for 1 station belonging to group G1 (VICH) which was supposed to be classified in G2, and 2 stations of group G2 (CASS and FRPL) that were supposed to be classified in G1 (Table 3). The one-dimensional equality
test of class means shows that the ratios L/H and W/H are the most discriminating parameters (P < 0.0001).
The morphometric results, based on the regression between the size (geometric mean [GM]), (length [L], width [W], height [H], and the gibbosity index [GIB]) are mentioned in Figure 4. A highly significant correlation is observed between L–GM, W–GM, and H–GM (all P < 0.001) (Figures 4A, 4B, and 4C, respectively). However, this relationship is very weak between GIB and GM (Figure 4D). These results indicate that the size of the shell increases with the parameters (L, W, and H). The Levene test performed on the GIB index within the 2 groups (G1 and G2) gives the following F-values: FG1 = 0.802 and FG2 = 1.209 (P > 0.05). As a result, no significant difference
Table 1. Abbreviations, geographical coordinates, and depths of sampling stations. (a) Lower mediolittoral and infralittoral area. (b)
Upper mediolittoral area.
Station abbreviation Coastal country Geographical coordinates Group Depth (m) Latitude Longitude
Ghazaouet (GH) Algeria 35°6′1.25″N 1°52′13.87″E G2 0–0.5
Beni Saf (BS) Algeria 35°18′45.70″N 1°22′26.03″E G1 1–8
Ténès (TE) Algeria 36°31′9.03″N 1°18′32.54″E G2 0–0.5
Tipaza (a) (Tia) Algeria 36°36′37.78″N 2°24′52.09″E G1 1–8
Tipaza (Tib) Algeria 36°36′37.78″N 2°24′52.09″E G2 0–0.5
Tigzirt (TZ) Algeria 36°53′43.28″N 4°7′47.00″E G2 0–0.5
Collo (CLa) Algeria 37°0′51.40″N 6°33′56.59″E G1 1–8
Collo (CLb) Algeria 37°0′51.40″N 6°33′56.59″E G2 0–0.5
Banyuls-sur-Mer* (BANY) France 42°29′12.46″N 3°7′51.69″E G2 0–0.5 Cap d′Agde* (CAP) France 43°16′28.48″N 3°30′52.53″E G2 0–0.5 Fréjus Plage* (FRPL) France 43°33′17.03″N 4°4′30.08″E G2 0–0.5 Fréjus Le Lion de Mer* (FRLM) France 43°33′17.01″N 4°4′30.10″E G1 1–8 Fréjus Les Pyramides* (FRPY) France 43°33′17.03″N 4°4′30.10″E G1 1–8
Couronne (COUR) France 43°19′46.35″N 5°2′57.54″E G2 0–0.5
Niolon (NIOL) France 43°20′12.91″N 5°15′20.95″E G1 1–8
Frioul (FRIOUL) France 43°16′57.80″N 5°17′59.33″E G2 0–0.5
La Vieille Chapelle (VICH) France 43°14′56.86″N 5°22′20.93″E G1 1–8
Port Miou (PMIOU) France 43°12′8.75″N 5°30′35.81″E G1 1–8
Cassis (CASS) France 43°12′42.15″N 5°32′17.01″E G2 0–0.5
Villefranche-sur-Mer* (VFSM) France 43°42′17.88″N 7°19′5.04″E G1 1–8
Naples* (NAP) Italy 40°50′16.31″N 14°15′54.08″E G1 1–8
Stidia (ST) Algeria 35.83° N 0° G1 1–8
Vielle Calle (VK) Algeria 36.9° N 8.45° E G1 1–8
Béjaïa (BJ) Algeria 36.87° N 4.84° E G1 1–8
*: The individuals from these stations were collected by the IMBE (Mediterranean Institute of Marine and Terrestrial Biodiversity, France).
in variance was found between the groups. The mean gibbosity index (GIB) of all individuals of group G1 is lower than that of group G2 (0.270 ± 0.041 < 0.319 ± 0.045, respectively). The t-test established between the 2 groups (G1 and G2) on the variable GIB gives an observed value t = –11.188 (P < 0.001). This value indicates the existence of a “group effect” caused by the morphological dissimilarity of P. caerulea shells. Indeed, group G1 is characterized by individuals with flattened and stocky shells. In contrast,
group G2 consists of individuals with high and less wide shells.
4. Discussion
The parameters L, W, and H are often used in the biometric relationships of limpets since they evolve with their shell volume (Nakhlé, 2003; Espinosa et al., 2009; Rivera-Ingraham et al., 2011; Belkhodja and Romdhane, 2012). These parameters present a very strong correlation for P. caerulea species in our survey (Figure 2). This result corroborates with those obtained by Nakhlé (2003) and Belkhodja and Romdhane (2012) for the same species.
The mean values obtained for L, W, and H in the sampled individuals belonging to both groups (G1 and G2) (Table 1) showed that the shells of group G1 are more flattened than the shells of group G2, which are high and stocky. Our survey revealed that the shell sizes of the individuals of group G1 is higher than those of group G2 (i.e., the westernmost Algerian station BS [Table 1], which presented specimens having the most imposing sizes). This result coincides with the model of Vermeij (1972). This model indicates that the marine species living in the lowest levels of the intertidal areas (such as P. caerulea) possess imposing shell sizes, larger and lower in form than the individuals living in the highest intertidal areas. In addition, Rivera-Ingraham et al. (2011) showed that shell lengths of the limpet C. nigra of Ceuta (northwest coast of Africa) were negatively correlated with shell heights in upper sea levels. The same authors noted that shell heights decreased gradually towards the lower intertidal areas. According to Vermeij model (1972), the difference in the limpet shell sizes (larger in the lower benthic zone than in the upper benthic zone) is due to a downward vertical migration. Indeed, in the highest inshore areas, we found juveniles recruited by their own larvae. In contrast, individuals with large shell sizes were found in the lowest inshore areas (e.g., 3 sampling stations from the Algerian coast: BS, CLa, and ST [Table 1]). This migration could be horizontal for the most part at the other studied stations, such as for individuals belonging to the French coastal station VICH (Table 1). Other studies concerning other limpet species inhabiting the lower levels of the intertidal areas, such as Patella argenvillei (Stephenson et al., 1940) or P. intermedia (Vermeij, 1972), and of the species of acmeides such as Acmaeapelta (Shotwell, 1950) or A. testudinalis testudinalis (Stephenson and Stephenson, 1954) showed that these species could migrate horizontally. According to these authors, this suggests that these species could develop a preference for a specific type of substratum by a competition phenomenon. This hypothesis is shared by Tablado and Lopez-Gappa (2001), who showed that shell size differences of the pulmonate limpet Siphonaria
lessoni were influenced by intraspecific competition and
was closely linked to its habitat.
Figure 2. Linear regression between length (L), width (W), and
Our study also revealed that the ratios L/H and W/H are the most discriminating and seem to be independent of the age of the limpet, as indicated by Jarne et al. (1988) in their study on the morphometric of some Mediterranean clams. These authors showed that there is a real morphometric dissimilarity between these species. In addition, these ratios have been used by Espinosa and Ozawa (2006) and Mezali (2007) to distinguish between the Rouxii and
Lamarkii forms of Patella ferruginea (Gmelin, 1791).
Discriminant function analysis (Figure 3B) showed that there is clear discrimination between groups G1 and G2
with good classification (Table 3), except for the individuals of VICH station which might belong to group G2, and the individuals of 2 stations (CASS and FRPL) which could be classified in group G1 (Tables 1 and 3). This could be explained by a homing phenomenon that limpets usually practice (Breen, 1971). Indeed, these marine gastropods can move 10 cm/day in all directions in order to graze for a few hours around their resting points (Little and Kitching, 1996; Santini et al., 2004, Silva et al., 2008).
The morphometric survey revealed the presence of 2 different morphotypes of P. caerulea in 2 different ecotones.
A B FRPY FRLM NIOL PMIOU VFSM VICH NAP BS FRPL FRIOUL COUR CASS CAP TZ CLa CLb GH TE Tib BJ Tia VK ST G1 G2 L W H -0.8 -0.4 0 0.4 0.8 -6 -4.4 -2.8 -1.2 0.4 2 3.6 5.2 6.8 F2 (15.83%) F1 (80.55%) F1 and F2 (96.38%) FRPY FRLM NIOL PMIOU VFSM VICH NAP BS CLa BJ Tia VK ST FRPL FRIOUL COUR CASS CAP BANY TZ CLb GH TE Tib G1 G2 -3.5 -2.5 -1.5 -0.5 0.5 1.5 2.5 3.5 -5 -4 -3 -2 -1 0 1 2 3 4 5 F'2 (< 0.01%) F'1 (> 99.99%) F'1 and F'2 (100.00%)
Figure 3. Multivariate analysis (A: principal component analysis [PCA]; B: discriminant function analysis [DFA]) established on all
sampled individuals of P. caerulea using the mean values of the parameters ([L, W and H] for the PCA and [L, W, H, L/W, L/H and W/H] for the DFA). • Individuals of group G1. • Individuals of group G2 (see Table 1 for the abbreviations). • Centroids of both groups (G1 and G2). • Projection of the parameters (L, W, and H) on the 2 most informative axes (F1 and F2) of the PCA.
This morphological difference is relative to the period of immersion of the individuals of P. caerulea, the nature of the substratum, and surrounding physical factors (Gérard, 1978; Moreteau and Vicente, 1988; Gray and Hodgson, 2003; Espinosa et al., 2009; Boukhicha et al., 2010). Group G1 includes individuals whose shells are more flattened and
lower in height than the shells of individuals of group G2, which are higher and shorter. The structure of the shells of group G2 (higher and shorter) allows them to store more water and assimilate a considerable quantity of oxygen in these paralytic areas (Guelorget and Perthuisot, 1983). This hypothesis is supported by Belkhodja and Romdhane (2012), who consider it an adaptive response to physical and ecological environmental conditions. Moreover, Jarne et al. (1988) demonstrated with populations of the Mediterranean clams Ruditapeses decussatus that the circumstances of growth of their populations have an influence on the shapes of their shells. In addition, it has been demonstrated that the morphology of the limpet shell is strongly influenced by the latitudinal position and the vertical distribution of individuals (Balaparameswara Rao and Ganapati, 1971; Vermeij, 1973; Branch, 1981; 1985).
Table 2. Contribution of each variable (L, W, and H) to the 3
PCA axes.
F1 F2 F3
L 0.940 –0.248 0.234
W 0.938 –0.259 –0.232
H 0.808 0.589 –0.004
Table 3. Classification of the sampling stations with membership probability for groups G1 and
G2 (see Table 1 for the abbreviations).
Station Initial classification Post classification Membership probability
G1 G2 FRPY G1 G1 1.000 0.000 FRLM G1 G1 1.000 0.000 NIOL G1 G1 1.000 0.000 PMIOU G1 G1 1.000 0.000 VFSM G1 G1 1.000 0.000 VICH G1 G2 0.000 1.000 NAP G1 G1 1.000 0.000 BS G1 G1 1.000 0.000 FRPL G2 G1 0.855 0.145 FRIOUL G2 G2 0.000 1.000 COUR G2 G2 0.000 1.000 CASS G2 G1 0.856 0.144 CAP G2 G2 0.000 1.000 BANY G2 G2 0.000 1.000 TZ G2 G2 0.000 1.000 CLa G1 G1 1.000 0.000 CLb G2 G2 0.000 1.000 GH G2 G2 0.000 1.000 TE G2 G2 0.000 1.000 Tib G2 G2 0.000 1.000 BJ G1 G1 1.000 0.000 Tia G1 G1 1.000 0.000 VK G1 G1 1.000 0.000 ST G1 G1 1.000 0.000
It seems that the shell of P. caerulea takes 2 different forms related to a specific habitat: one associated with submerged areas (lower mediolittoral and infralittoral), and the other with drier areas (upper mediolittoral). This morphological plasticity allows this limpet to adapt to different ecotones and resist difficult environmental conditions that can affect its habitat.
Acknowledgments
The first author expresses his gratitude to the staff of the IMBE (France), especially Anne Chenuil for providing samples collected from several stations (originating from the French and Italian Mediterranean coast) during her brief scientific stay in France. The authors are especially appreciative of the editor and the reviewers for their valuable comments and suggestions.
y = 1.578x + 1.376 r = 0.96 0 10 20 30 40 50 60 70 0 10 20 30 40 Le ng h (L ) Geometric mean (GM) A (mm) (mm) y = 1.294x + 1.021 r = 0.95 0 10 20 30 40 50 0 10 20 30 40 W id th (W ) Geometricmean (GM) B (mm) (mm) y = 0.493x - 0.750 r = 0.92 0 5 10 15 20 0 10 20 30 40 H ig h (H ) Geometric mean (GM) C (mm) (mm) y = 0.002x + 0.252 r = 0.23 0.0 0.1 0.2 0.3 0.4 0.5 0 10 20 30 40 G ib bo sit y in de x (G IB ) Geometric mean (GM) D (mm)
Figure 4. Linear regression between the parameters (A: L–GM, B: W–GM, C: H–GM, and D: GIB–GM) of all measured individuals of P. caerulea. • Individuals of group G1.• Individuals of group G2.
References
Bacci G (1947). L’inversione del sesso ed il ciclo stagionale della gonade in Patella caerulea L. Pubbl Staz Zool Napoli 21: 183-217 (article in Italian).
Bachnou A, Boughdiri M (2005). Morphométrie des brachiopodes par modélisation mathématique combinée des tracés ouvert et fermé. Exemple d’application parmi les Terebratulidae du Jurassique moyen. Rev Paléo biol 24: 789-802 (article in French).
Balaparameswara Rao M, Ganapati PN (1971). Ecological studies on tropical limpet, Cellana radiata. Structural variations in the shell in relation to distribution. Mar Biol 10: 236-243.
Belkhodja H, Romdhane MS (2012). Étude morphométrique du mollusque Gastéropode Patella caerulea Linnaeus, 1758 des côtes nord de la Tunisie. SCI Techno Mer 39: 15-23 (article in French).
Boukhicha J, Tlig SZ, Ben Hassine OK (2010). Diversité morphométrique de Patella caerulea (Linnaeus, 1758) du littoral rocheux des côtes tunisiennes. Rapp Comm Int Mer Medit 39: 722 (article in French).
Bouzaza Z (2012). Contribution à l’étude systématique, phylogénétique et phylogéographique de quelques espèces de patelles (Gastropoda: Patellidae) de la zone intertidale de la côte algérienne. Thèse de Magister, Université Abdelhamid Ibn Badis, Mostaganem, Algerie (article in French).
Branch GM (1981). The biology of limpets: physical factors, energy flow and ecological interactions. Oceanogr Mar Biol A Rev 19: 235-380.
Branch GM (1985). Limpets: their role in littoral and sublittoral community dynamics. In: Moore PG, Seed R, editors. The Ecology of Rocky Coasts. London: Hodder and Stroughton, pp. 97-113.
Breen PA (1971). Homing behavior and population regulation in the limpet Acmea (Collisella) digitalis. Veliger 15: 133-141. Christiaens J (1973). Révision du genre Patella (Mollusca,
Gastropoda). Bull Mus Hist Nat 182: 1305-1392 (article in French).
Cretella M, Scillitani G, Toscano F, Turella P, Picariello O, Cataudo A (1994). Relationships between Patella ferruginea Gmelin, 1791 and the other Tyrrhenian species of Patella (Gastropoda: Patellidae). J Mollusc Stud 60: 9-17.
David B, Fouray M (1984). Variabilité et disjonction évolutive des caractères dans les populations de Micraster (Echinoidea, spatangoida) du Crétacé supérieur de Picardie. Geobios-Lyon 17: 447-476.
Della Santina P, Sonni C, Sartoni G, Chelazzi G (1993). Food availability and diet composition of three coexisting Mediterranean limpets (Patella spp.). Mar Biol 116: 87-95. Espinosa F, Ozawa T (2006). Population genetics of the endangered
limpet Patella ferruginea (Gastropoda: Patellidae): taxonomic conservation and evolutionary considerations. J Zool Syst Evol Res 44: 8-16.
Espinosa F, Rivera-Ingraham, Fa D, Garcia-Gomez Jc (2009). Effect of human pressure on population size structures of the endangered ferruginean limpet: toward future management measures. J Coastal Res 25: 857-863.
Fekih M, Gougerot L (1974). Liste commentée des Gastéropodes testacés marins recueillis dans les dépôts littoraux actuels du Golfe de Tunis. Bull Inst Natl Sci Techn Océanogr Pêche Salammbo 3: 165-232 (article in French).
Fischer-Piette E, Gaillard J (1959). Les Patelles au long des côtes Atlantiques Ibériques et nord Marocaines. J Conchol 99: 135-200 (article in French).
Frenkiel L (1975). Contribution à l’étude des cycles de reproduction des Patellidae en Algérie. Pubbl Staz Zool Napoli 39: 153-189 (article in French).
Gérard A (1978). Recherches sur la variabilité de diverses populations de Ruditapes decussatus et Ruditapes philippinarum. PhD, Université de Bretagne Occidentale, Brest, France (in French).
Gray DR, Hodgson AN (2003). Growth and reproduction in the high-shore South African limpet Helicon pectunculus (Mollusca: Patellogastropoda). Afr Zool 38: 371-386.
Guelorget O, Perthuisot J-P (1983). Le domaine paralique : expressions géologiques, biologiques et économiques du confinement. Travaux du laboratoire de géologie. 16th edition.
Paris, France: Presse de l’école normale supérieure (in French). Hakenkamp CC, Morin A (2000). The importance of meiofauna to
lotic ecosystem functioning. Freshw Biol 44: 165-175.
Jarne P, Berrebi P, Guelorget O (1988). Variabilité génétique et morphométrique de cinq populations de palourdes Ruditapes
decussatus (mollusque, bivalve). Oceanol Acta 11: 401-407
(article in French).
Jerardino A, Navarro R (2008). Shell morphometry of seven limpet species from coastal shell middens in southern Africa. J Archaeol Sci 35: 1023-1029.
Koufopanou V, Reid DG, Ridgway SA, Thomas RH (1999). A molecular phylogeny of the Patellid limpets (Gastropoda: Patellidae) and its implications for the origins of their antitropical distribution. Mol Phylogenet Evol 11: 138-156.
Little C, Kitching JA (1996). The biology of rocky shores. Lwnnol Oceanogr 41: 1584-1585.
Matousek J, Nesetril J (2004). Introduction aux mathématiques discrètes. 1st edition. New York: Springer Science and Business
Media (in French).
Mezali K (2007). État de pollution de la côte de Mostaganem et étude systématique et écologique de la patelle géante Patella
ferruginea (Gmelin, 1791) dans la zone de Stidia (Algérie). 7ème
Congrès Maghrébin des Sciences de la Mer et le 1er Congrès
Franco-Marocain de Zoologie et d’Ichtyologie. El Djadida, Morocco; 4–7 November 2007 (in French).
Moreteau JC, Vicente N (1988). Étude morphologique et croissance de Pinnanobllis L. (Mollusque eulamellibranche) dans le Parc national sous-marin de Port-Cros (Var, France). Rapp Commint Mer Médit 31: 2 (in French).
Nakhle KF (2003). Le mercure, le cadmium et le plomb dans les eaux littorales libanaises: apport et suivi au moyen de bioindicateurs quantitatifs (éponges, bivalves et gastéropodes). PhD, Université Denis Diderot, Paris, France (in French).
Pandita H, Zaim Y, Aswan, Rizal Y (2013). Relationship of biometrical aspect of Turritellidae with geochronological aspect in West Java. Int J Geosci 4: 777-784.
Ridgway SA, Reid DG, Taylor JD, Branch GM, Hodgson AN (1998). A cladistic phylogeny of the family Patellidae: (Mollusca: Gastropoda). Philos T Roy Soc B 353: 1645-1671.
Rivera-Ingraham GA, Espinosa F, Garcia-Gomez JC (2011). Ecological considerations and niche differentiation between juvenile and adult black limpets (Cymbula nigra). J Mar Biol Assoc UK 91: 191-198.
Santini G, Thompson RC, Tendi C, Hawkins SJ, Hartnoll RG, Chelazzi G (2004). Intra-specific variability in the temporal organisation of foraging activity in the limpet Patella vulgata. Mar Biol 144: 1165-1172.
Saporta G (2006). Probabilités, analyse des données et statistique. 2nd
ed. Paris, France: Technip (in French).
Saucède T, Bonnot A, Marchand D, Courville P (2013). A revision of the rare genus Cyclolampas (Echinoidea) using morphometrics with description of a new species from the upper Callovian of Burgundy (France). J Paleontol 87: 105-121.
Shotwell JA (1950). Distribution of volume and relative linear measurement changes in Acmaea, the limpet. Ecology 31: 51-61.
Silva ACF, Hawkins SJ, Boaventura DM, Thompson RC (2008). Predation by small mobile aquatic predators regulates populations of the intertidal limpet Patella vulgata (L.) J Exp Mar Biol Ecol 367: 259-265.
Stephenson TA, Stephenson A, Day JH (1940). The South African intertidal zone and its relation to ocean currents. VIII. Lamberts Bay and the west coast. Ann Natal Mus 9: 345-380. Stephenson TA. Stephenson A (1954). Life between tide-marks in
North America. IIIA. Nova Scotia and Prince Edward Island: description of the region. J Eco 42: 14-45.
Tablado A, Lopez-Gappa J (2001). Morphometric diversity of the pulmonate limpet Siphonaria lessoni in different coastal environments. Sci Mar 65: 33-41.
Vermeij GJ (1972). Intraspecific shore-level size gradients in intertidal molluscs. Ecology 53: 693-700.
Vermeij GJ (1973). Morphological patterns in high intertidal gastropods: adaptive strategies and their limitations. Mar Biol 20: 319-346.
![Figure 3. Multivariate analysis (A: principal component analysis [PCA]; B: discriminant function analysis [DFA]) established on all sampled individuals of P](https://thumb-eu.123doks.com/thumbv2/123doknet/13101002.386020/6.829.171.656.102.744/multivariate-analysis-principal-component-analysis-discriminant-established-individuals.webp)