HAL Id: hal-02311361
https://hal.archives-ouvertes.fr/hal-02311361
Submitted on 10 Oct 2019
HAL is a multi-disciplinary open access
archive for the deposit and dissemination of
sci-entific research documents, whether they are
pub-lished or not. The documents may come from
teaching and research institutions in France or
abroad, or from public or private research centers.
L’archive ouverte pluridisciplinaire HAL, est
destinée au dépôt et à la diffusion de documents
scientifiques de niveau recherche, publiés ou non,
émanant des établissements d’enseignement et de
recherche français ou étrangers, des laboratoires
publics ou privés.
macrophages? A proteomic-instructed view
Bastien Dalzon, Anaelle Torres, Hélène Diemer, Stephane Ravanel, Véronique
Collin-Faure, Karin Pernet-Gallay, Pierre-Henri Jouneau, Jacques
Bourguignon, Sarah Cianférani, Marie Carrière, et al.
To cite this version:
Bastien Dalzon, Anaelle Torres, Hélène Diemer, Stephane Ravanel, Véronique Collin-Faure, et al..
How reversible are the effects of silver nanoparticles on macrophages?
A proteomic-instructed
view.
Environmental science .Nano, Royal Society of Chemistry, 2019, 6 (10), pp.3133-3157.
�10.1039/c9en00408d�. �hal-02311361�
Science
Nano
PAPER
Cite this:Environ. Sci.: Nano, 2019, 6, 3133
Received 8th April 2019, Accepted 21st July 2019 DOI: 10.1039/c9en00408d rsc.li/es-nano
How reversible are the effects of silver
nanoparticles on macrophages? A
proteomic-instructed view
†
Bastien Dalzon,
‡
aAnaelle Torres,
‡
aHélène Diemer,
bStéphane Ravanel,
cVéronique Collin-Faure,
aKarin Pernet-Gallay,
dPierre-Henri Jouneau,
eJacques Bourguignon,
cSarah Cianférani,
bMarie Carrière,
fCatherine Aude-Garcia
§
aand Thierry Rabilloud
*
aSilver nanoparticles are known to strongly affect biological systems, and numerous toxicological studies have investigated their effects. Most of these studies examine the effects immediately following acute ex-posure. In this work, we have conducted further investigation by studying not only the acute, post-exposure response, but also the cellular response after a 72 hour-recovery-phase post post-exposure. As a bio-logical model we have used macrophages, which are very important cells with respect to their role in the immune response to particulate materials. To investigate the response of macrophages to nanoparticles and their recovery post exposure, we have used a combination of proteomics and targeted experiments. These experiments provided evidence that the cellular reaction to nanoparticles, including the reaction during the recovery phase, is a very active process involving massive energy consumption. Pathways such as the oxidative stress response, central and lipid metabolism, protein production and quality control are strongly modulated during the cellular response to nanoparticles, and restoration of basic cellular homeo-stasis occurs during the recovery period. However, some specialized macrophage functions, such as lipopolysaccharide-induced cytokine and nitric oxide production, did not return to their basal levels even 72 hours post exposure, showing that some effects of silver nanoparticles persist even after exposure has ceased.
1. Introduction
Silver nanoparticles (AgNPs) are used as a biocide in a variety of consumer and medical products, because of the toxic ef-fects that they have on microorganisms. However, as an
unwanted side effect, AgNPs also show toxicity to mamma-lian cells. Thus, numerous toxicological studies have been conducted both in vitro in bacterial and eukaryotic model cell systems and in vivo in animal models, including at the micro-biome level.1–3Although some studies, especially those using
aChemistry and Biology of Metals, Univ. Grenoble Alpes, CNRS UMR5249, CEA,
IRIG, CBM-ProMD, 17 Rue des Martyrs, F-38054 Grenoble Cedex 9, France. E-mail: thierry.rabilloud@cnrs.fr; Tel: +33 438 783 212
bLaboratoire de Spectrométrie de Masse BioOrganique (LSMBO), Université de
Strasbourg, CNRS, IPHC UMR 7178, 67000 Strasbourg, France
cUniv. Grenoble Alpes, INRA, CNRS UMR5168, CEA, IRIG, Laboratory of Plant
Cellular Physiology, Grenoble, F-38000 France
dUniv. Grenoble Alpes, Inserm U1216 Grenoble Institut des Neurosciences, 38000
Grenoble, France
eUniv. Grenoble Alpes, Modelization and Exploration of Materials,
CEA-DRF-IRIG-DEPHY-MEM-LEMMA, F-38000 Grenoble, France
fUniv. Grenoble-Alpes, CEA, CNRS UMR 5819, IRIG, SyMMES, Chimie Interface
Biologie pour l'Environnement, la Santé et la Toxicologie (CIBEST), F-38054 Grenoble, France
† Electronic supplementary information (ESI) available. See DOI: 10.1039/ c9en00408d
‡ These authors contributed equally to this work.
§ Deceased: Nov. 21st, 2018. This paper is dedicated to her memory. Environmental significance
Silver nanoparticles are known to have profound effects on living cells. Because of their widespread use, contamination is almost unavoidable. In this context, it is important not only to assess the immediate effects of silver nanoparticles on cells, but also how they recover after exposure. Using macrophages as the target cell type and a combination of proteomic and targeted experiments, we show here that the recovery phase is not just a“return to normal” condition. For example, some of the specialized macrophage functions are still not restored after this time, showing that subtle but sustained effects can occur after a single exposure. Although cell survival is not affected, such effects may impact the health status of living beings.
Open Access Article. Published on 20 September 2019. Downloaded on 10/10/2019 5:37:27 PM.
This article is licensed under a
Creative Commons Attribution-NonCommercial 3.0 Unported Licence.
View Article Online
animal models, have examined the effects of NPs after re-peated, low-dose exposures,4–8most of the cellular, toxicolog-ical studies have been conducted in an acute exposure mode, meaning that high doses have been used and exposure times have been short, spanning less than or equal to 24 hours. In these types of studies, toxicological endpoints are investi-gated at the end of the exposure period.9–16In terms of expo-sure, the acute schemes relate most closely to accidental, acute exposures, while chronic schemes correspond highly to occupational exposures. It is of interest to study how biologi-cal systems recover after a single, high, non-lethal exposure. This is not a trivial question, as some mineral toxicants such as beryllium or crystalline silica show very prolonged effects, even after the exposure has ceased.17,18 This poor recovery has also been observed for silver nanomaterials such as silver nanowires19and silver nanoparticles.20
Many toxicological studies have reported pro-inflammatory responses5,11,12,21 and/or immunological ef-fects15,22 pointing to macrophages as a cell type of major interest in toxicological studies of AgNPs. This is in accor-dance with the important scavenging function of macro-phages in many different tissues.
This work investigates the recovery of macrophages af-ter a unique, acute, but subtoxic dose of AgNPs. Targeted experiments carried out primarily on macrophages showed that several functional effects (e.g. LPS-induced cytokine and NO production, mitochondrial transmembrane poten-tial and phagocytosis) were altered immediately after expo-sure to AgNPs. However, these functions tended to return to normal after a 72 h recovery period.23 We therefore de-cided to get a broader view of cellular recovery using a proteomic approach.
Proteomic approaches have been used to study cellular responses to AgNPs in several models such as intestinal cells9,24,25 or liver cells.10 This allowed several important pathways modulated in response to acute exposures to AgNPs to be highlighted. These included mitochondrial proteins, pointing at potential mitochondrial dysfunc-tion,9,10,24 and proteins involved in intermediate metabo-lism9,10,24 or in inflammatory responses.10 The latter find-ings reinforced the interest in studying macrophages, which are major players in inflammation. We therefore decided to use proteomics to study the cellular responses using a macrophage J774 cell line, directly after acute ex-posure and after a recovery period had lapsed. This model cell line was selected because, unlike human monocyte cell lines,26,27 mouse macrophage cell lines such as RAW264.7 and J774 do not need to be chemically differen-tiated into macrophages, a process that deeply alters cell physiology and causes some cell death. Furthermore, as opposed to primary macrophages derived from human blood, these mouse cell lines do not show extensive vari-ability from one experiment to another. This explains why these cell lines are extensively used as models for testing of a wide variety of nanomaterials,28–31 including large scale projects.32–34
2. Experimental
Most experiments have been performed essentially as de-scribed in previous publications.35–37 Details are given here for the sake of the consistency of the paper. All biological ex-periments were carried out at least on three independent bio-logical replicates.
2.1 Nanoparticles
PVP-coated silver nanoparticles were purchased from Sigma, directly as a concentrated suspension (catalog number #758329). Their characteristics have been published previ-ously.23,38 These experiments confirmed the manufacturer's data and showed that the nanoparticles are spherical, with a diameter in the 50–110 nm range, and did not aggregate upon dilution in water or culture medium.
2.2 Cell culture
The mouse macrophage cell line J774 was obtained from the European Cell Culture Collection (Salisbury, UK). The cells were cultured in DMEM + 10% fetal bovine serum (FBS). For routine culture, cells were seeded in non-adherent flasks (e.g. suspension culture flasks from Greiner) at 200 000 cells per ml and harvested 48 hours later, at 1 000 000 cells per ml. Cell viability was measured by a dye exclusion assay, either with eosin (1 mg ml−1)39 under a microscope or with propidium iodide (1μg ml−1)40in a flow cytometry mode.
For determination of the useful dose, cells were seeded at 500 000 cells per ml. They were treated with nanoparticles on the following day and harvested after a further 24 hours in culture.
For treatment with nanoparticles, cells were seeded in classical cell culture flasks and left for 24 hours at 37 °C for cell adhesion and confluence. For the recovery condition, cells were treated with nanoparticles on the following day. Af-ter 24 hours of exposure, the cell culture medium was re-moved and replaced by fresh medium. For consistency rea-sons, this operation was also carried out on cells used for control and for acute exposure. Another medium culture change was carried out 36 hours after the initial medium change, i.e. mid-term of the 72 hour recovery period. Finally, acute exposure was carried out for the final 24 hours and the cells were used immediately afterwards.
2.3 Phagocytosis and particle internalization assay
The phagocytic activity was measured using fluorescent latex beads (1μm diameter, green labelled, catalog number L4655 from Sigma). The beads were pre-incubated at a final concen-tration of 55μg mL−1for 30 minutes at 37°C in PBS/FBS (v/ v). Then, they were incubated with cells (5 μg mL−1) for 2 h 30 at 37 °C. Cells were harvested and washed with PBS. Cells were resuspended by vortexing with addition of 3/4 water vol-ume and then 1/4 NaCl (35 mg mL−1) volume was added un-der vortexing in orun-der to clean the cell surface of adsorbed particles. Cells were harvested in PBS with propidium iodide
Open Access Article. Published on 20 September 2019. Downloaded on 10/10/2019 5:37:27 PM.
This article is licensed under a
(1μg mL−1). Viability and phagocytic activity were measured simultaneously by flow cytometry on a FacsCalibur instru-ment (Beckton Dickinson). The dead cells (propidium posi-tive) were excluded from the analysis.
2.4 Mitochondrial transmembrane potential measurement The mitochondrial transmembrane potential was assessed by rhodamine 123 uptake. Cells were incubated with rhodamine 123 (80 nM) for 30 minutes at 37 °C, 5% CO2 then rinsed
twice in cold glucose (1 mg mL−1)–PBS (PBSG) and harvested in cold PBSG supplemented with propidium iodide (1 μg mL−1). The mitochondrial potential of the cells was analysed by flow cytometry on a FacsCalibur instrument (Beckton Dickinson). The dead cells (propidium positive) were ex-cluded from the analysis. The low rhodamine concentration was used to avoid intramitochondrial fluorescence quenching that would result in a poor estimation of the mitochondrial potential.41
2.5 Enzyme assays
The enzymes were assayed according to published procedures (see below).
The cell extracts for enzyme assays were prepared by lysing the cells for 20 minutes at 0 °C in Hepes (20 mM, pH 7.5), MgCl2 (2 mM), KCl (50 mM), EGTA (1 mM), and
tetra-decyldimethylammonio propane sulfonate (SB 3-14) (0.15% (w/v)), followed by centrifugation at 15 000g for 15 minutes to clear the extract. The protein concentration was determined by a dye-binding assay.42 The dehydrogenase or dehydrogenase-coupled activities were assayed at 500 nm using the phenazine methosulfate/iodonitrotetrazolium coupled assay.43The enzyme assay buffer contained 25 mM Hepes, NaOH (pH 7.5), 5 mM magnesium acetate, 100 mM potassium nitrate and 1% Triton X-100. It also contained 30 μM phenazine methosulfate, 200 μM iodonitrotetrazolium chloride, 250 μM of the adequate cofactor (NAD or NADP) and 1–5 mM of the organic substrate, which was used to start the reaction. For phosphate-dependent enzymes such as glyc-eraldehyde dehydrogenase (GAPDH) and purine phosphory-lase (PNPH), 50 mM potassium phosphate (pH 7.5) was added to the enzyme assay buffer. Triose phosphate isomer-ase was assayed with dihydroxyacetone phosphate and a glyc-eraldehyde dehydrogenase-coupled assay.44Purine phosphor-ylase (PNPH) was assayed by a xanthine oxidase-coupled assay.45Hexokinase was assayed by a glucose phosphate de-hydrogenase (G6PDH)-coupled assay.46 Biliverdine reductase was assayed at 450 nm as described.47Pyridoxal kinase was assayed directly at 388 nm.48Enolase was assayed at 340 nm by a pyruvate kinase–lactate dehydrogenase-coupled assay.49 2.6 NADP/NADPH and glucose assays
The glucose concentration in conditioned media was deter-mined by a hexokinase–G6PDH assay.50Briefly, culture media collected at the end of the exposure period were centrifuged for 15 min at 15 000g to pelletize the particulate material.
The supernatant was collected, and diluted 100-fold in the dehydrogenase assay buffer described above, containing also 1 mM EGTA, 30 μM phenazine methosulfate, 200 μM iodo-nitrotetrazolium chloride, 10 IU ml−1G6PDH and 7.5 IU ml−1 hexokinase. The reaction was started by the addition of ATP (1 mM final concentration) and the increase in absorbance at 500 nm read for 1 minute. The linear part of the absorbance curve was used to determine the reaction speed, which was proportional to the glucose concentration. Fresh culture me-dia supplemented with 10% fetal calf serum, i.e. high glucose DMEM (4.5 g L−1glucose), RPMI1640 (2 g L−1 glucose) and 199 medium (1 g L−1glucose) were used as standards.
The NADP–NADPH concentration was determined using an adapted alkaline extraction buffer.51Briefly, at the end of the exposure period, cells were collected by scraping, rinsed twice in PBS and pelleted. The packed cell pellet (PCP) ume was estimated, and the cells were lysed in 10 PCP vol-umes of 10 mM CAPS, 1 mM EGTA and 2 mM MgCl2for 10
minutes on ice with occasional vortexing. The suspension was centrifuged (10 000g, 5 minutes, 4 °C), the viscous cell pellet discarded and the supernatant collected and split into two aliquots. The first aliquot was neutralized on ice by adding 0.1 volume of 1 M tricine. This aliquot contained both the oxidized and reduced forms of the pyridine nucleo-tides, and was also used to determine the protein concentra-tion by a dye-binding assay.42
The other aliquot was heated at 60°C for 30 minutes in a thermostated water bath to destroy the oxidized forms of the pyridine nucleotides.51It was then cooled on ice, neutralized by adding 0.1 volume of 1 M tricine, and centrifuged for 10 minutes at 10 000g at 4 °C to eliminate any particulate material.
The NADP–NADPH concentration was then determined by using an enzyme cycling assay and standard NADP solutions.52
2.7 NO production and cytokine production
The cells were grown to confluence in a 6-well plate and pre-treated with nanoparticles as described above. For the final 18 hours of culture, half of the wells were treated with 100 ng ml−1LPS (from salmonella, purchased from Sigma), and argi-nine monohydrochloride was added to all the wells (5 mM fi-nal concentration) to give a high concentration of the sub-strate for nitric oxide synthase. After 18 hours of incubation, the cell culture medium was recovered and centrifuged at 10 000g for 10 minutes to remove cells and debris, and the ni-trite concentration in the supernatants was read at 540 nm after addition of an equal volume of Griess reagent and incu-bation at room temperature for 30 minutes.
For cytokine production, a commercial kit (BD Cytometric Bead Array, catalog number 552364 from BD Biosciences) was used. 2.8 F-actin staining
The experiments were performed essentially as previously de-scribed.53The cells were recovered at the mid-term medium
Open Access Article. Published on 20 September 2019. Downloaded on 10/10/2019 5:37:27 PM.
This article is licensed under a
change (see above) and cultured on coverslips placed in 6-well plates. For the acute exposure condition, the cells were exposed to silver nanoparticles for 24 h at 37°C. At the end of the exposure time, the cells were washed twice for 5 min at 4°C in PBS and fixed in 4% paraformaldehyde for 30 min at room temperature. After two washes (5 min/4°C in PBS), they were permeabilized in 0.1% Triton X100 for 5 min at room temperature. After two more washes in PBS, 500 nM Phalloidin-Atto 550 (Sigma) was added to the cells and left for 20 min at room temperature in the dark. Coverslip-attached cells were washed, placed on microscope slides (Thermo Scientific) using a Vectashield mounting medium containing DAPI (Eurobio) and imaged using a Zeiss LSM 800 confocal microscope. The images were processed using ImageJ software.
2.9 Silver assay by ICP-MS
For measuring the Ag-NP uptake and release in cells, 2 mL cell cultures in 6-well plates were used, with the exposure scheme described above in section 2.2. At the end of the ex-posure period, the culture medium was removed and saved and the cell layer was gently rinsed twice with culture me-dium without serum.
The cells were then lysed by scraping in 2 ml of lysis buffer (50 mM Hepes (pH 7.5), 4 mM magnesium acetate, 200 mM sorbitol, and 0.1% (w/v) tetradecyldimethylammonio propane sulfonate (SB 3-14)). The lysate was pipetted into a microtube and incubated for 20 minutes on ice to complete cell lysis. For determination of soluble silver, aliquots of the culture media and of the cell lysates were centrifuged for 45 minutes at 16 000g, and the upper half of the supernatant was collected.
The samples were mineralized by the addition of one vol-ume of suprapure 65% HNO3 and incubation on a rotating
wheel at room temperature for 18 h.
Mineralized samples were diluted in 0.5% (v/v) HNO3and
analysed using an iCAP RQ quadrupole mass instrument (Thermo Fisher Scientific GmbH, Germany) equipped with an ASX-560 auto-sampler (Teledyne CETAC Technologies, Omaha, USA). The instrument was used with a MicroMist U-Series glass concentric nebulizer, a quartz spray chamber cooled at 3°C, a Qnova quartz torch, a nickel sample cone, and a nickel skimmer cone equipped with a high-sensitivity insert.24Mg,25Mg,107Ag and109Ag concentrations were deter-mined using standard curves and corrected using an internal standard solution of 103Rh added online. Data integration was done using the Qtegra software (version 2.8.2944.115). The results were normalized using the Mg concentration (4 mM in the cellular extracts and 0.82 mM in culture medium). To take into account the cellular concentration effects, the protein concentration of the extracts was determined by a dye-binding assay.42
2.10 Proteomics
The 2D gel-based proteomic experiments were essentially car-ried out as previously described,35 at least on independent
biological triplicates. However, detailed materials and methods are provided for the sake of paper consistency.
2.10.1 Sample preparation. The cells were collected by scraping and then washed three times in PBS. The cells were then washed once in TSE buffer (10 mM Tris-HCl (pH 7.5), 0.25 M sucrose, and 1 mM EDTA), and the volume of the cell pellet was estimated. The pellet was resuspended in its own volume of TSE buffer. Then 4 volumes (respective to the cell suspension just prepared) of concentrated lysis buffer (8.75 M urea, 2.5 M thiourea, 5% w/v CHAPS, 6.25 mM TCEP-HCl, 20 mM spermine base, and 20 mM spermine tetra-hydrochloride) were added and the solution was left to ex-tract at room temperature for 1 hour. The nucleic acids were then pelleted by centrifugation (270 000g at room tempera-ture for 1 h), and the protein concentration in the superna-tant was determined by a dye-binding assay.42 Carrier ampholytes (Pharmalytes, pH 3–10) were added to a final concentration of 0.4% (w/v), and the samples were kept fro-zen at−20 °C until use.
2.10.2 Isoelectric focusing. Home-made 160 mm long 4– 8 linear pH gradient gels54were cast according to published procedures.55 Four mm-wide strips were cut and rehydrated overnight with the sample, diluted to a final volume of 0.6 ml of the rehydration solution (7 M urea, 2 M thiourea, 4% CHAPS, 0.4% carrier ampholytes (Pharmalytes 3–10) and 100 mM dithiodiethanol).56
The strips were then placed in a Multiphor plate (GE Healthcare), and IEF was carried out with the following elec-trical parameters: 100 V for 1 hour, then 300 V for 3 hours, then 1000 V for 1 hour, then 3400 V up to 60–70 kVh. After IEF, the gels were equilibrated for 20 minutes in 125 mM Tris, 100 mM HCl, 2.5% SDS, 30% glycerol and 6 M urea.57 They were then transferred on top of the SDS gels and sealed in place with 1% agarose dissolved in 125 mM Tris, 100 mM HCl, 0.4% SDS and 0.005% (w/v) bromophenol blue.
2.10.3 SDS electrophoresis and protein detection. Ten per-cent gels (160 × 200 × 1.5 mm) were used for protein separa-tion. The Tris taurine buffer system58was used and operated at an ionic strength of 0.1 and a pH of 7.9. The final gel com-position is thus 180 mM Tris, 100 mM HCl, 10% (w/v) acryl-amide, and 0.27% bisacrylamide. The upper electrode buffer is 50 mM Tris, 200 mM taurine, and 0.1% SDS. The lower electrode buffer is 50 mM Tris, 200 mM glycine, and 0.1% SDS. The gels were run at 25 V for 1 hour, then 12.5 W was applied per gel until the dye front reached the bottom of the gel. Detection was carried out by tetrathionate silver staining59.
2.10.4 Image analysis and global analysis of the spot abun-dance data. The gels were scanned after silver staining on a flatbed scanner (Epson perfection V750), using 16 bit gray-scale image acquisition. The gel images were then analyzed using the Delta 2D software (v 3.6). The spots that were never expressed above 100 ppm of the total spots were first filtered out. Then, significantly-varying spots were selected on the ba-sis of their Student's T-test p-value between the treated and the control groups. Spots showing a p-value lower than 0.05
Open Access Article. Published on 20 September 2019. Downloaded on 10/10/2019 5:37:27 PM.
This article is licensed under a
were selected. This strategy is used to avoid the use of arbi-trary thresholds, which can result in discarding statistically-valid relevant changes and including non-statistically-valid changes.60 The false positive concern was taken into account using sev-eral approaches such as the Benjamini Hochberg approach,61 the sequential goodness of fit approach62and the sequential Fisher test approach.63Furthermore, we checked that all the spots that we found through the T-test also had a p< 0.05 in a non-parametric Mann–Whitney U-test.
For the global analysis of the spot abundance data, we used directly the spot abundance data as provided by the gel analysis software. The software directly normalizes each spot abundance by the sum of all spot abundances detected on the gel. These relative abundance data were used directly for global analysis using the PAST software suite64 without any transformation. No limitation in the number of principal components was implemented in the principal component analysis.
2.10.5 Mass spectrometry. The spots selected for identifi-cation were excised from silver-stained gels and destained with ferricyanide/thiosulfate on the same day as silver staining in order to improve the efficiency of the identifica-tion process.65,66In-gel digestion was performed with an au-tomated protein digestion system, MassPrep Station (Waters, Milford, USA). The gel plugs were washed twice with 50μL of 25 mM ammonium hydrogen carbonate (NH4HCO3) and 50
μL of acetonitrile. The cysteine residues were reduced by 50 μL of 10 mM dithiothreitol at 57 °C and alkylated by 50 μL of 55 mM iodoacetamide. After dehydration with acetonitrile, the proteins were cleaved in the gel with 10 μL of 12.5 ng μL−1modified porcine trypsin (Promega, Madison, WI, USA)
in 25 mM NH4HCO3. The digestion was performed overnight
at room temperature. The generated peptides were extracted with 30μL of 60% acetonitrile in 0.1% formic acid. Acetoni-trile was evaporated under vacuum before nanoLC-MS/MS analysis.
NanoLC-MS/MS analysis was performed using a nano-ACQUITY Ultra-Performance-LC (Waters Corporation, Mil-ford, USA) coupled to a Synapt™ High Definition Mass Spectrometer™ (Waters Corporation, Milford, USA), or to a TripleTOF 5600 (Sciex, Ontario, Canada).
The nanoLC system was composed of an ACQUITY UPLC® CSH130 C18 column (250 mm × 75 μm with a 1.7 μm particle size, Waters Corporation, Milford, USA) and a symmetry C18 precolumn (20 mm × 180 μm with a 5 μm particle size, Waters Corporation, Milford, USA). The sol-vent system consisted of 0.1% formic acid in water (solsol-vent A) and 0.1% formic acid in acetonitrile (solvent B). 4μL of the sample were loaded into the enrichment column over 3 min at 5 μL min−1 with 99% of solvent A and 1% of sol-vent B. Elution of the peptides was performed at a flow rate of 300 nL min−1 with a 8–35% linear gradient of sol-vent B in 9 minutes.
The Synapt™ High Definition Mass Spectrometer™ (Wa-ters Corporation, Milford, USA) was equipped with a Z-spray ion source and a lock mass system. The system was fully
con-trolled by MassLynx 4.1 SCN639 (Waters Corporation, Mil-ford, USA). The capillary voltage was set at 2.8 kV and the cone voltage at 35 V. Mass calibration of the TOF was achieved using fragment ions from Glu-fibrino-peptide B in the [50;2000] m/z range. Online correction of this calibration was performed with Glu-fibrino-peptide B as the lock-mass. The ion (M + 2H)2+at m/z 785.8426 was used to calibrate MS data and the fragment ion (M + H)+at m/z 684.3469 was used to calibrate MS/MS data during the analysis.
For tandem MS experiments, the system was operated with automatic switching between the MS (0.5 s per scan in the m/z range [150;1700]) and MS/MS mode (0.5 s per scan in the m/z range [50;2000]). The two most abundant peptides (intensity threshold 20 counts per s), preferably doubly and triply charged ions, were selected in each MS spectrum for further isolation and CID fragmentation using a collision en-ergy profile. Fragmentation was performed using argon as the collision gas.
Mass data collected during analysis were processed and converted into .pkl files using ProteinLynx Global Server 2.3 (Waters Corporation, Milford, USA). Normal background sub-traction was used for both MS and MS/MS with a 5% thresh-old and polynomial correction of order 5. Smoothing was performed on MS/MS spectra (Savitzky–Golay, 2 iterations, window of 3 channels). Deisotoping was applied for MS (me-dium deisotoping) and for MS/MS (fast deisotoping).
The TripleTOF 5600 (Sciex, Ontario, Canada) was oper-ated in positive mode, with the following settings: ion spray voltage floating (ISVF) 2300 V, curtain gas (CUR) 10, inter-face heater temperature (IHT) 150, ion source gas 1 (GS1) 2, declustering potential (DP) 80 V. The information-dependent acquisition (IDA) mode was used with Top 10 MS/MS scans. The MS scan had an accumulation time of 250 ms in the m/z [400;1250] range and the MS/MS scans 100 ms in the m/z [150;1800] range in high sensitivity mode. Switching criteria were set to ions with a charge state of 2–4 and an abundance threshold of more than 500 counts; the exclusion time was set at 4 s. The IDA rolling collision energy script was used for automatically adapting the CE. Mass calibration of the analyser was achieved using peptides from digested BSA. The complete system was fully controlled by AnalystTF 1.7 (Sciex). Raw data collected were processed and converted with MSDataConverter in the .mgf peak list format.
For protein identification, the MS/MS data were inter-preted using a local Mascot server with the MASCOT 2.4.1 algorithm (Matrix Science, London, UK) against UniProtKB/SwissProt (version 2016_01, 550 299 sequences). The research was carried out in all species. Spectra were searched with a mass tolerance of 15 ppm for MS and 0.05 Da for MS/MS data, allowing a maximum of one trypsin missed cleavage. Carbamidomethylation of cysteine residues and oxidation of methionine residues were speci-fied as variable modifications. Protein identifications were validated with at least two peptides with a Mascot ion score above 30.
Open Access Article. Published on 20 September 2019. Downloaded on 10/10/2019 5:37:27 PM.
This article is licensed under a
2.11 Electron microscopy
J774 macrophage cells were grown on coverslips and treated with AgNPs as described above. Cells were allowed to recover for 72 hours before being fixed with 2.5% glutaraldehyde in 0.1 M cacodylate buffer (pH 7.4) for 2 hours at room tempera-ture. Cells were then washed with buffer, post fixed with 1% osmium tetroxide in the same buffer for 1 hour at 4°, and washed with water. Cells were then dehydrated through a se-ries of graded alcohol (30–60–90–100–100–100%) and infil-trated with a mix of 1/1 epon/alcohol (100%) for 1 hour be-fore several baths of fresh epon (Fluka) for 3 hours. Finally, a capsule full of epon was placed on the surface of the cells and the resin was allowed to polymerise for 72 h at 60 °C. The polymerised bloc was then detached from the coverslip with HF (48%) over 1 hour. Ultrathin sections of the cell monolayer were cut with an ultramicrotome (Leica). For transmission electron microscopy (TEM) observation, the sec-tions were post-stained with 5% uranyl acetate and 0.4% lead citrate and observed with a transmission electron microscope at 80 kV (JEOL 1200EX). Images were acquired with a digital camera at magnification ranging from 15k to 50k (Veleta, Olympus). For scanning transmission electron microscopy observation (STEM) and energy dispersive spectroscopic anal-ysis (EDS), the sections were not post-stained. They were coated with a thin layer of carbon and observed and analyzed with an OSIRIS microscope (TECNAI) operating at 200 kV.
3. Results
3.1 Silver accumulation upon treatment with silver nanoparticles and after recovery
First, the effect of silver nanoparticles and soluble silver on cell viability was assayed, and the results are shown in Fig. 1. For all the subsequent experiments, a dose of 20μg ml−1was selected, corresponding to the lethal dose 20% (LD20). This dose ensures strong effects on cells while keeping cellular mortality at an ac-ceptable level for subsequent experiments. We also checked the presence of nanoparticles in cells by electron microscopy. Con-trol cells did not show any electron-dense materials (Fig. 2A and B), while cells exposed to Ag nanoparticles acutely showed some electron-dense particles located in large mem-brane compartments called macropinosomes (Fig. 2C and D). After the recovery period, these electron dense particles were still observed in the macropinosomes (Fig. 2E and F). Energy dispersive spectroscopic analysis of these electron-dense fea-tures confirmed that they contained Ag (Fig. 2G–I).
Silver accumulation in cells was measured by ICP-MS. The results are summarized in Table 1. They showed a strong ac-cumulation of silver in cells at the end of the 24 hour expo-sure followed by a moderate loss of total silver. The cells were able to cycle once during the 72 h recovery period, as shown by the increase in the protein amount in the extracts, which resulted in a further reduction of the cellular silver content. A moderate but detectable silver excretion was also evidenced. It should be also noted that the protein concentra-tion is used in toxicology as an indicator for cell number,67,68
3.2 Global analysis of the proteomic results
From the total protein expression data obtained from the gel analysis software, a subset of variable proteins (p< 0.25 in ei-ther the acute vs. control or the recovery vs. control compari-sons) was extracted. This allowed the noise brought by pro-teins that do not show a consistent variation in the biological phenomena under investigation to be decreased. This subset was then tested using the PAST statistical suite.64 As a first test, a hierarchical clustering was performed, and the results are shown in Fig. 3A. Clustering clearly separates the control group from the two silver-treated ones, but gives no informa-tion regarding which silver treatment condiinforma-tion is closer to the control. Principal component analysis gave a more valuable in-dication, as shown in Fig. 3B. The recovery group appeared to be in an intermediate position between the control and acute groups along component one, which carries most of the vari-ance. This is an expected position in a “return to normal” model during the recovery phase. However, the recovery group separated from both the control and the acute groups in com-ponent 2. This suggested that the three conditions were fairly different from each other. This was further confirmed by anal-ysis of similarities (ANOSIM), which gave the following results for the p-values of the pairwise comparisons:
Fig. 1 Dose response curve to silver nanoparticles and ionic silver. Cell viability was measured by dye exclusion. The cells were exposed to silver nanoparticles (panel A) or silver lactate (panel B) for 24 hours before measurement of cell viability (n = 3).
Open Access Article. Published on 20 September 2019. Downloaded on 10/10/2019 5:37:27 PM.
This article is licensed under a
p = 0.031 for the acute vs. control comparison
p = 0.032 for the recovery vs. control comparison
p = 0.027 for the acute vs. recovery comparison
These figures suggest that the recovery phase was a very ac-tive state, which did not represent just an intermediate state between the control and the acute stage, i.e. immediately af-ter exposure to silver nanoparticles. To further investigate this aspect, we extracted the intensity values for the spots that were significantly altered (p < 0.05) between the control group and at least one of the silver-treated groups. In order
Fig. 2 Ag distribution in macrophages. Control cells (A and B) or cells exposed to Ag nanoparticles (C–G) were imaged by transmission electron microscopy (A–F) or scanning transmission electron microscopy (G). Panels A and B: control cells; panels C and D: cells acutely exposed to Ag nanoparticles; panels E and F: recovering cells. A, C and E: High contrast images; B, D and F: low contrast images highlighting the presence of electron-dense materials, which are probably Ag nanoparticles or debris of Ag nanoparticles (*). Panel G is a HAADF image of a multilamellar body containing electron-dense materials. H and I: Chemical element distribution of the area of G delimited by the white square, analyzed by energy dispersive spectroscopy. Panel H shows the Ag distribution and panel I shows the EDS spectra of area1 (an intracellular region containing some Ag) and area2 (an intracellular region that does not contain any Ag) of H.
Table 1 Measurements of silver concentrations
Unexposed Exposed to 20μg ml−1AgNPs 72 h recovery after exposure to AgNPs Protein concentration in the cell extract (mg ml−1) 0.352 ± 0.02 0.322 ± 0.02 0.657 ± 0.04
Total silver concentration in the cell extract (μg l−1) 0 9794 ± 1159 8258 ± 1536 Soluble silver concentration in the cell extract (μg l−1) 0 39.86 ± 11.83 47.57 ± 3.11 Soluble silver concentration in culture medium (μg l−1) 457 ± 64a 142 ± 4 Normalized silver content (ng Ag mg−1protein) 0 30 608 ± 5055 12 530 ± 1984 Soluble silver fraction in cells 0 0.0041 ± 0.0014 0.0059 ± 0.001 Fraction of silver excretedb 0 ND 0.017 ± 0.003
aThis value contains both the soluble silver that is actively excreted by cells during the exposure and the soluble silver that arises from nanoparticle dissolution directly in the culture medium.bDefined as soluble silver in medium/total silver (i.e. silver in medium + silver in cells).
Open Access Article. Published on 20 September 2019. Downloaded on 10/10/2019 5:37:27 PM.
This article is licensed under a
to cope with the multiple testing issue, we used several ap-proaches such as the Benjamini Hochberg approach,61the se-quential goodness of fit approach62and the sequential Fisher test approach.63 All the selected spots showed a very low q-value for the condition for which they were variable com-pared to the control (Table S1†).
We then divided this dataset of 239 spots into lists (Table S2†). The first list, labelled as “returning spots”, contained the spots for which the amplitude of the change in abundance be-tween the recovery and control stages is lower than the ampli-tude of the change in abundance between the acute exposure and control stages. 135 spots belonged to this list. It was then divided into subsets. The first subset contained“fast returning spots”. It was defined as spots for which the quantitative change in the acute vs. control comparison shows an ampli-tude at least twice that in the recover vs. control comparison (i.e. more than 50% convergence). 44 spots belonged to this subset. The other subset of this list contained the 91 “slow returning spots”, for which the return-to-normal trend was lower than 50% in the 72 hour recovery period.
The other list, labelled as“diverging spots”, contained the 104 spots for which the amplitude of the change in abun-dance between the recovery and control stages is higher than the amplitude of the change in abundance between the acute exposure and control stages. This list was also divided into subsets. The“fast diverging spots” subset was defined as the spots for which the quantitative change in the recover vs. control comparison was at least 1.5 higher than the quantita-tive change in the acute vs. control comparison (i.e. more than 50% divergence). 53 spots belonged to this subset. The other subset of this list contained the 51 “slow diverging spots”, for which the diverging trend was lower than 50% in the 72 hour recovery period.
3.3 Detailed analysis of the proteomic results
In order to gain more precise insights, we investigated which proteins were significantly altered (p < 0.05) between the
control group and at least one of the silver-treated groups. The list of modulated proteins is given in Table 2 and the corresponding 2D gel images are shown in Fig. 4. As 2D gels separate protein forms, a variation in a spot does not neces-sarily mean that the whole amount of the protein is modu-lated. In fact, a single protein can be represented by various 2D gel spots, which do not necessarily all change upon the treatment with nanoparticles. To alleviate this problem, we systematically identified by mass spectrometry not only the modulated spots, but also the neighboring spots to check for such isoform issues. The quantitative results have been inte-grated in Table 2 and the mass spectrometry identification parameters are detailed in Table S3.† The results for some classes (apoptosis, cell fate and energy metabolism) are also shown in gel images in Fig. 4, and the results for the other classes are shown in Fig. S1–S5.† For global analysis of the modulated proteins, we used the DAVID annotation tool,69,70 available at https://david.ncifcrf.gov/, and the results are shown in Tables S4 and S5.† The results showed that some functional classes such as energy metabolism, cytoskeleton especially actin cytoskeleton, protein folding and quality con-trol (especially the ubiquitin/proteasome pathway), nucleo-tide and nucleic acid metabolism, cell signaling, oxidative stress response and detoxification proteins are strongly repre-sented among the modulated proteins. This prompted us to carry out validation experiments on some of these proteins or pathways.
3.4 Enzymatic activities
For some of the modulated proteins, we first checked whether their enzyme activities (Table 3), i.e. the relevant pa-rameter in terms of cell physiology, followed or not the trends observed via proteomics. There is no obvious infer-ence between the two parameters, as the activity may be mod-ulated by PTM and thus correlate with one or several spots, or with the sum of the spots representing the same protein. One good example is represented by malate dehydrogenase,
Fig. 3 Global analysis of proteomic data. Global data analysis was performed on the proteomic data to derive the relationships between the various samples used. Panel A: Hierarchical clustering. The Euclidean distance similarity index and Ward's algorithm were used for this analysis. C1– C4: Control (non-exposed) cells. A1–A4: Acutely exposed cells (24 hours). R1–R4: Recovering cells (72 hours post-exposure). Panel B: Principal component analysis. A representation displaying the first two principal components is shown. The PCA yielded 11 components, of which the first two, represented in the figure, explained 70% of the total variance (axis 1– 54%, axis 2 – 16%). Component 3 explained 7.5% of the variance, component 4 explained 6%, and the remaining components explained less than 4% of the variance each. Samples labelled as in panel A.
Open Access Article. Published on 20 September 2019. Downloaded on 10/10/2019 5:37:27 PM.
This article is licensed under a
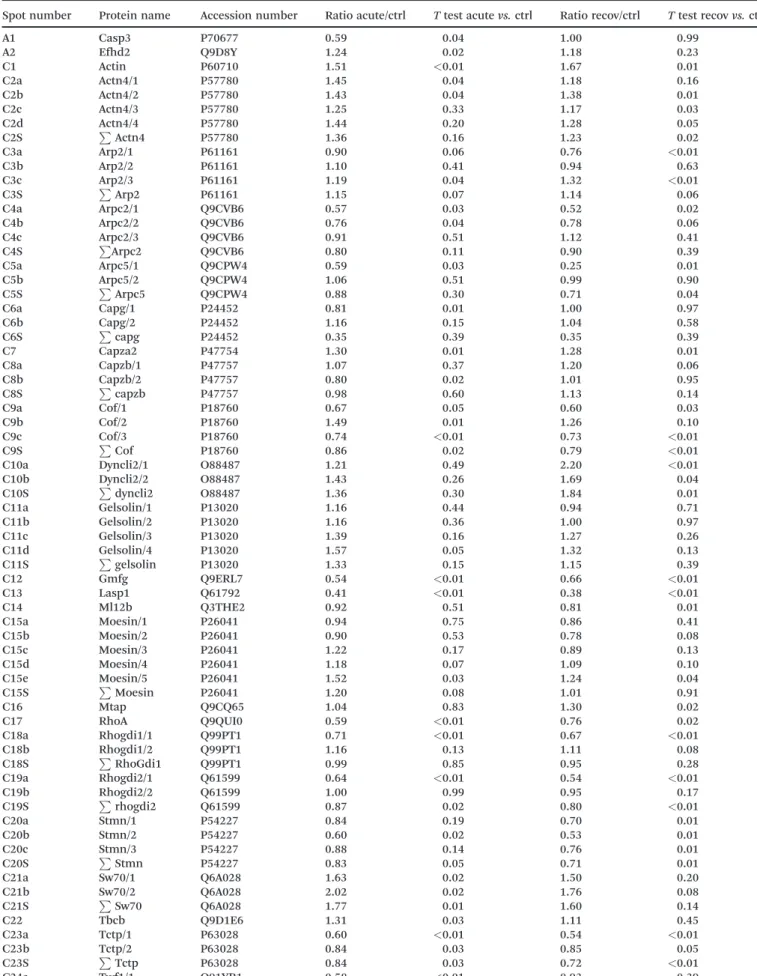
Table 2 Differentially-expressed proteins identified in the proteomic screen
Spot number Protein name Accession number Ratio acute/ctrl T test acute vs. ctrl Ratio recov/ctrl T test recov vs. ctrl A1 Casp3 P70677 0.59 0.04 1.00 0.99 A2 Efhd2 Q9D8Y 1.24 0.02 1.18 0.23 C1 Actin P60710 1.51 <0.01 1.67 0.01 C2a Actn4/1 P57780 1.45 0.04 1.18 0.16 C2b Actn4/2 P57780 1.43 0.04 1.38 0.01 C2c Actn4/3 P57780 1.25 0.33 1.17 0.03 C2d Actn4/4 P57780 1.44 0.20 1.28 0.05 C2S PActn4 P57780 1.36 0.16 1.23 0.02 C3a Arp2/1 P61161 0.90 0.06 0.76 <0.01 C3b Arp2/2 P61161 1.10 0.41 0.94 0.63 C3c Arp2/3 P61161 1.19 0.04 1.32 <0.01 C3S PArp2 P61161 1.15 0.07 1.14 0.06 C4a Arpc2/1 Q9CVB6 0.57 0.03 0.52 0.02 C4b Arpc2/2 Q9CVB6 0.76 0.04 0.78 0.06 C4c Arpc2/3 Q9CVB6 0.91 0.51 1.12 0.41 C4S PArpc2 Q9CVB6 0.80 0.11 0.90 0.39 C5a Arpc5/1 Q9CPW4 0.59 0.03 0.25 0.01 C5b Arpc5/2 Q9CPW4 1.06 0.51 0.99 0.90 C5S PArpc5 Q9CPW4 0.88 0.30 0.71 0.04 C6a Capg/1 P24452 0.81 0.01 1.00 0.97 C6b Capg/2 P24452 1.16 0.15 1.04 0.58 C6S Pcapg P24452 0.35 0.39 0.35 0.39 C7 Capza2 P47754 1.30 0.01 1.28 0.01 C8a Capzb/1 P47757 1.07 0.37 1.20 0.06 C8b Capzb/2 P47757 0.80 0.02 1.01 0.95 C8S Pcapzb P47757 0.98 0.60 1.13 0.14 C9a Cof/1 P18760 0.67 0.05 0.60 0.03 C9b Cof/2 P18760 1.49 0.01 1.26 0.10 C9c Cof/3 P18760 0.74 <0.01 0.73 <0.01 C9S PCof P18760 0.86 0.02 0.79 <0.01 C10a Dyncli2/1 O88487 1.21 0.49 2.20 <0.01 C10b Dyncli2/2 O88487 1.43 0.26 1.69 0.04 C10S Pdyncli2 O88487 1.36 0.30 1.84 0.01 C11a Gelsolin/1 P13020 1.16 0.44 0.94 0.71 C11b Gelsolin/2 P13020 1.16 0.36 1.00 0.97 C11c Gelsolin/3 P13020 1.39 0.16 1.27 0.26 C11d Gelsolin/4 P13020 1.57 0.05 1.32 0.13 C11S Pgelsolin P13020 1.33 0.15 1.15 0.39 C12 Gmfg Q9ERL7 0.54 <0.01 0.66 <0.01 C13 Lasp1 Q61792 0.41 <0.01 0.38 <0.01 C14 Ml12b Q3THE2 0.92 0.51 0.81 0.01 C15a Moesin/1 P26041 0.94 0.75 0.86 0.41 C15b Moesin/2 P26041 0.90 0.53 0.78 0.08 C15c Moesin/3 P26041 1.22 0.17 0.89 0.13 C15d Moesin/4 P26041 1.18 0.07 1.09 0.10 C15e Moesin/5 P26041 1.52 0.03 1.24 0.04 C15S PMoesin P26041 1.20 0.08 1.01 0.91 C16 Mtap Q9CQ65 1.04 0.83 1.30 0.02 C17 RhoA Q9QUI0 0.59 <0.01 0.76 0.02 C18a Rhogdi1/1 Q99PT1 0.71 <0.01 0.67 <0.01 C18b Rhogdi1/2 Q99PT1 1.16 0.13 1.11 0.08 C18S PRhoGdi1 Q99PT1 0.99 0.85 0.95 0.28 C19a Rhogdi2/1 Q61599 0.64 <0.01 0.54 <0.01 C19b Rhogdi2/2 Q61599 1.00 0.99 0.95 0.17 C19S Prhogdi2 Q61599 0.87 0.02 0.80 <0.01 C20a Stmn/1 P54227 0.84 0.19 0.70 0.01 C20b Stmn/2 P54227 0.60 0.02 0.53 0.01 C20c Stmn/3 P54227 0.88 0.14 0.76 0.01 C20S PStmn P54227 0.83 0.05 0.71 0.01 C21a Sw70/1 Q6A028 1.63 0.02 1.50 0.20 C21b Sw70/2 Q6A028 2.02 0.02 1.76 0.08 C21S PSw70 Q6A028 1.77 0.01 1.60 0.14 C22 Tbcb Q9D1E6 1.31 0.03 1.11 0.45 C23a Tctp/1 P63028 0.60 <0.01 0.54 <0.01 C23b Tctp/2 P63028 0.84 0.03 0.85 0.05 C23S PTctp P63028 0.84 0.03 0.72 <0.01 C24a Twf1/1 Q91YR1 0.58 <0.01 0.93 0.39
Open Access Article. Published on 20 September 2019. Downloaded on 10/10/2019 5:37:27 PM.
This article is licensed under a
Table 2 (continued)
Spot number Protein name Accession number Ratio acute/ctrl T test acute vs. ctrl Ratio recov/ctrl T test recov vs. ctrl C24b Twf1/2 Q91YR1 0.25 0.01 0.86 0.52 C24S PTwf1 Q91YR1 0.40 <0.01 0.89 0.47 C25 Twf2 Q9Z0P5 0.70 0.01 0.60 0.01 C26 Vime P20152 1.54 0.05 1.35 0.04 C27a Vinculin/1 Q64727 1.28 0.25 1.24 0.11 C27b Vinculin/2 Q64727 1.32 0.07 1.16 0.24 C27c Vinculin/3 Q64727 1.63 0.01 1.12 0.28 C27S PVinculin Q64727 1.39 0.07 1.18 0.16 D1 Cbx1 P83917 0.91 0.27 0.72 <0.01 D2a Ddb1/1 Q3U1J4 1.74 0.04 1.40 0.16 D2b Ddb1/2 Q3U1J4 0.93 0.65 0.78 0.21 D2S PDdb1 Q3U1J4 1.31 0.14 1.07 0.73 D3 Nt5c Q9JM14 1.18 0.08 1.39 0.03 D4a Pcna/1 P17918 0.57 <0.01 0.57 <0.01 D4b Pcna/2 P17918 0.82 0.02 0.80 0.03 D4c Pcna/3 P17918 1.00 0.92 0.98 0.73 D4S PPcna P17918 0.84 <0.01 0.82 0.02 D5 Ruvb2 Q9WTM5 1.46 0.06 1.42 0.04 E1a 6pgd/1 Q9DCD0 0.88 0.05 0.95 0.42 E1b 6pgd/2 Q9DCD0 1.05 0.32 1.01 0.90 E1S P6pgd Q9DCD0 0.98 0.45 0.99 0.82 E2a Aacs/1 Q9D2R0 1.79 0.11 1.39 0.52 E2b Aacs/2 Q9D2R0 3.12 0.01 2.56 <0.01 E2S PAacs Q9D2R0 2.17 0.01 1.73 0.16 E3 Acadl P51174 1.13 0.14 1.27 0.01 E4a Eno1a/1 P17182 0.99 0.96 0.89 0.28 E4b Eno1a/2 P17182 1.10 0.50 0.89 0.42 E4c Eno1a/3 P17182 1.18 0.10 1.21 0.10 E4d Eno1a/4 P17182 1.50 <0.01 1.42 <0.01 E4S PEno1A P17182 1.26 0.02 1.19 0.06 E5 GalK Q9R0N0 1.45 <0.01 1.50 0.03 E6 Gapdh P16858 0.56 <0.01 0.60 <0.01 E7 Gpd1L Q3ULJ0 2.27 <0.01 1.42 0.14 E8a Hxk3/1 Q3TRM8 1.91 0.02 1.80 0.03 E8b Hxk3/2 Q3TRM8 1.23 0.04 1.22 0.09 E8c Hxk3/3 Q3TRM8 1.52 0.02 1.52 0.02 E8S PHxk3 Q3TRM8 1.51 0.01 1.49 0.01 E9 Idhc O88844 1.24 0.02 1.19 <0.01 E10a Ldha/1 P06151 0.79 0.02 0.86 0.06 E10b Ldha/2 P06151 0.97 0.81 0.89 0.40 E10S PLdha P06151 0.89 0.26 0.88 0.21 E11a Mdhc/1 P14152 0.47 0.02 0.72 0.11 E11b Mdhc/2 P14152 0.83 0.01 0.84 0.01 E11c Mdhc/3 P14152 1.38 0.02 1.40 <0.01 E11S PMdhc P14152 1.01 0.91 1.05 0.20 E12 Pckgm Q8BH04 1.30 0.20 0.61 0.01 E13 Pfkap Q9WUA3 0.84 0.01 0.86 0.01 E14 Pfkl P12382 1.83 0.01 1.62 0.03 E15a Pgls/1 Q9CQ60 0.78 0.02 0.97 0.75 E15b Pgls/2 Q9CQ60 1.11 0.16 1.22 0.01 E16 Pgp Q8CHP8 1.37 0.02 1.60 0.05 E17a Taldo1 Q93092 0.80 0.02 0.66 <0.01 E17b Taldo/2 Q93092 1.17 0.12 1.18 0.08 E17c Taldo/3 Q93092 1.24 0.02 1.23 <0.01 E17d Taldo/4 Q93092 0.81 0.06 0.79 0.02 E17e Taldo/5 Q93092 1.22 0.06 1.36 0.02 E17S PTaldo Q93092 1.08 0.16 1.09 0.06 E18a Tpis/1 P17751 0.74 0.01 0.82 0.04 E18b Tpis/2 P17751 1.04 0.61 1.20 0.09 E18c Tpis/3 P17751 1.45 0.04 1.43 0.05 E18S PTpis P17751 1.09 0.29 1.16 0.17 F1 Cdk4 P30285 0.69 <0.01 0.71 <0.01 F2 Cdk6 Q64261 0.71 0.04 0.77 0.02 F3a Ndrg1/1 Q62433 1.32 0.09 1.52 0.04 F3b Ndrg1/2 Q62433 1.38 0.01 1.33 0.02 F3S Pndrg1 Q62433 1.34 0.02 1.44 0.03 F4 Pa2 g4 P50580 1.50 <0.01 1.31 0.01
Open Access Article. Published on 20 September 2019. Downloaded on 10/10/2019 5:37:27 PM.
This article is licensed under a
Table 2 (continued)
Spot number Protein name Accession number Ratio acute/ctrl T test acute vs. ctrl Ratio recov/ctrl T test recov vs. ctrl F5a Vma5a/1 Q99KC8 1.60 0.06 0.99 0.97 F5b Vma5a/2 Q99KC8 1.31 0.11 1.19 0.10 F5c Vma5a/3 Q99KC8 1.84 <0.01 1.59 0.02 F5S PVma5a Q99KC8 1.54 0.02 1.25 0.12 G1 GalE Q8R059 0.50 0.03 1.09 0.50 G2 Gnpda1 O88958 0.47 <0.01 0.63 0.01 G3 Gt25c Q8K297 1.53 0.01 1.48 0.01 G4 Mlec Q6ZQI3 1.49 0.02 1.79 <0.01 G5a Naga/1 Q8JZV7 1.19 0.07 1.19 0.06 G5b Naga/2 Q8JZV7 1.05 0.56 1.18 0.08 G5S PNaga Q8JZV7 1.12 0.16 1.19 0.06 H1 Adh5 P28474 0.72 0.09 0.74 0.11 H2a Aldr/1 P45376 0.57 0.01 0.66 0.01 H2b Aldr/2 P45376 0.84 0.09 0.73 0.04 H2c Aldr/3 P45376 1.18 0.04 1.25 0.01 H2S PAldr P45376 0.85 0.02 0.89 0.10 H3 Aldr2 P47738 1.16 0.08 1.23 <0.01 H4a Bvra/1 Q9CY64 0.54 0.02 0.62 0.03 H4b Bvra/2 Q9CY64 1.23 0.08 1.30 0.06 H4S PBvra Q9CY64 0.98 0.81 1.06 0.54 H5 Bvrb Q923D2 1.45 0.01 0.96 0.77 H6 Ca13 Q9D6N1 0.62 0.01 0.83 0.11 H7a Esd/1 Q9R0P3 0.56 <0.01 0.64 0.01 H7b Esd/2 Q9R0P3 0.78 <0.01 0.92 0.15 H7S PEsd Q9R0P3 0.73 <0.01 0.86 0.02 H8 Frih P09528 0.61 0.01 0.67 0.02 H9 Gclm O09172 1.32 0.01 0.98 0.86 H10 Hmox2 O70252 1.53 <0.01 1.03 0.69 H11a Lgul/1 Q9CPU0 0.80 0.04 0.77 0.05 H11b Lgul/2 Q9CPU0 1.10 0.24 1.10 0.16 H11S PLgul Q9CPU0 1.00 0.99 1.00 0.96 L1 Anxa1 P10107 0.78 0.02 1.11 0.06 L2a Anxa2/1 P07356 0.79 0.01 0.60 <0.01 L2b Anxa2/2 P07356 0.44 <0.01 0.56 <0.01 L2S PAnxa2 P07356 0.67 <0.01 0.59 <0.01 L3 Anxa3 O35639 1.34 0.01 1.30 0.02 L4 Anxa4 P97429 1.30 0.01 1.33 <0.01 L5a Anxa5/1 P48036 0.88 0.02 0.81 <0.01 L5b Anxa5/2 P48036 1.09 0.34 1.07 0.37 L5S PAnxa5 P48036 0.95 0.35 0.90 0.08 L6 Anxa6 P14824 1.54 0.02 1.80 <0.01 L7 Anxa7 Q07076 1.14 0.44 1.57 0.02 L8 Idi1 P58044 1.40 0.02 1.34 0.01 L9 Lypla2 Q9WTL7 1.07 0.28 1.22 0.02 L10 Mbd3 Q9Z2D8 1.52 0.02 1.77 <0.01 L11 Pipna P53810 1.22 0.11 1.32 0.01 L12 Ppt1 O88531 1.24 0.14 1.34 0.03 M1a Clic4/1 Q9QYB1 0.90 0.12 0.95 0.58 M1b Clic4/2 Q9QYB1 1.27 0.02 1.27 0.04 M1S PClic4 Q9QYB1 1.12 0.04 1.14 0.01 M2 Clybl Q8R4N0 1.80 0.03 1.41 0.19 M3 Gatm Q9D964 0.68 0.01 0.54 0.01 M4 Hmgcl P38060 0.61 <0.01 0.76 0.07 M5 Nduv2 Q9D6J6 1.24 0.01 1.49 0.05 M6 Oat P29758 1.30 0.05 1.50 0.01 M7 Odba P50136 1.54 0.02 1.28 0.12 M8 Phb P67778 1.12 0.16 1.18 0.05 M9 Tmem11 Q8BK08 1.78 0.04 1.46 0.41 M10 Vdac2 Q60930 0.63 0.02 0.72 0.05 M11a Atpb ac P56480 1.23 0.16 1.41 0.03 M11b Atpb bas P56480 1.60 0.04 1.58 <0.01 M11S PAtpb P56480 1.41 0.06 1.49 <0.01 M12 Clpp O88696 1.28 0.33 1.84 0.02 M13a Trap1/1 Q9CQN1 1.74 0.02 1.32 0.13 M13b Trap1/2 Q9CQN1 1.21 0.25 0.92 0.64 M13S PTrap1 Q9CQN1 1.47 0.03 1.11 0.51 N1a Aprt/1 P08030 0.52 <0.01 0.72 <0.01
Open Access Article. Published on 20 September 2019. Downloaded on 10/10/2019 5:37:27 PM.
This article is licensed under a
Table 2 (continued)
Spot number Protein name Accession number Ratio acute/ctrl T test acute vs. ctrl Ratio recov/ctrl T test recov vs. ctrl N1b Aprt/2 P08030 1.06 0.43 1.08 0.39 N1S PAprt P08030 0.92 0.19 0.99 0.85 N2 Bpnt1 Q9Z0S1 1.77 0.02 1.87 0.01 N3 Guaa Q3THK7 1.42 0.02 1.12 0.25 N4 Hint1 P70349 1.46 0.30 0.64 0.02 N5 Ndka P15532 0.42 0.03 0.75 0.22 N6 Paps1 Q60967 5.54 0.04 2.44 0.01 N7a Pnph/1 P23492 0.83 0.12 0.72 0.05 N7b Pnph/2 P23492 1.25 0.02 1.22 0.08 N7S PPnph P23492 1.08 0.17 1.02 0.76 N8a Prps1/1 Q9D7G0 0.69 0.01 0.92 0.48 N8b Prps1/2 Q9D7G0 0.57 <0.01 0.77 0.16 N8c Prps1/3 Q9D7G0 0.52 0.01 0.83 0.21 N8S PPrps1 Q9D7G0 0.60 <0.01 0.83 0.14 N9a Pur4/1 Q5SUR0 1.71 0.14 1.27 0.07 N9b Pur4/2 Q5SUR0 2.53 0.01 2.01 0.01 N9c Pur4/3 Q5SUR0 1.15 0.53 1.25 0.22 N9S PPur4 Q5SUR0 1.65 0.07 1.43 0.01 N10 Pur9 Q9CWJ9 1.16 0.27 1.23 0.01 N11 Nt5c3b Q3UFY7 1.55 <0.01 1.64 0.01 O1 Prx1ox P35700 0.58 0.02 0.70 0.04 O2a Prx3/1 P20108 0.93 0.69 1.13 0.08 O2b Prx3/2 P20108 1.23 0.06 1.32 0.01 O2S PPrx3 P20108 1.16 0.22 1.27 0.01 O3 Prx4 O08807 0.75 0.06 0.56 0.01 O4a Prx6/1 O08709 0.56 0.02 0.45 0.01 O4b Prx6/2 O08709 1.05 0.64 0.97 0.76 O4S PPrx6 O08709 0.96 0.63 0.87 0.23 P1 Aars Q8BGQ7 1.65 0.01 1.18 0.20 P2a Eef2/1 P58252 0.77 0.02 0.63 <0.01 P2b Eef2/2 P58252 1.06 0.41 0.96 0.39 P2c Eef2/3 P58252 0.84 0.07 0.90 0.20 P2d Eef2/4 P58252 0.99 0.88 0.98 0.61 P2e Eef2/5 P58252 1.39 0.01 1.29 0.01 P2S PEef2 P58252 1.02 0.72 0.97 0.43 P3 If3g Q9Z1D1 0.77 0.31 0.56 0.03 P4a If5a/1 P63242 0.54 <0.01 0.62 <0.01 P4d If5a/2 P63242 1.07 0.26 1.03 0.58 P4S PIf5a P63242 0.86 0.04 0.87 0.04 P5 If4a1 P60843 1.55 0.01 1.51 0.01 P6 If4a3 Q91VC3 1.27 0.05 1.09 0.28 P7 Rla0 P14869 1.28 0.07 1.33 0.04 P8 Rs4y1 P62702 0.50 0.04 0.62 0.07 P9a Sars/1 P26638 1.42 0.03 1.05 0.59 P9b Sars/2 P26638 1.52 0.04 1.10 0.42 P9S PSars P26638 1.48 0.02 1.08 0.46 Q1a Dpp3/1 Q99KK7 1.28 0.22 1.75 <0.01 Q1b Dpp3/2 Q99KK7 1.55 0.04 1.84 <0.01 Q1S PDpp3 Q99KK7 1.40 0.09 1.79 <0.01 Q2a Hsp74/1 Q61316 0.77 0.22 0.77 0.23 Q2b Hsp74/2 Q61316 1.33 0.08 1.18 0.23 Q2c Hsp74/3 Q61316 1.31 0.09 1.14 0.29 Q2d Hsp74/4 Q61316 1.26 0.15 1.31 <0.01 Q2S PHsp74 Q61316 1.07 0.58 1.03 0.80 Q3a Hyou1/1 Q9JKR6 1.18 0.25 0.83 0.20 Q3b Hyou1/2 Q9JKR6 1.38 0.01 1.18 0.03 Q3c Hyou1/3 Q9JKR6 1.35 0.01 1.21 0.05 Q3d Hyou1/4 Q9JKR6 0.80 0.23 0.79 0.11 Q3S PHyou1 Q9JKR6 1.04 0.67 0.93 0.27 Q4 Lxn P70202 0.98 0.80 1.26 <0.01 Q5 Pfd2 O70591 0.72 0.01 0.70 0.01
Q6a Ppce/1 Q9QUR6 1.40 0.15 1.78 0.01 Q6b Ppce/2 Q9QUR6 1.58 0.04 1.66 0.01 Q6S PPpce Q9QUR6 1.50 0.07 1.71 0.01 Q7a Ppia/1 P17742 0.68 0.11 0.57 0.05 Q7b Ppia/2 P17742 0.80 0.21 0.79 0.21 Q7c Ppia/3 P17742 0.81 0.09 0.99 0.97
Open Access Article. Published on 20 September 2019. Downloaded on 10/10/2019 5:37:27 PM.
This article is licensed under a
Table 2 (continued)
Spot number Protein name Accession number Ratio acute/ctrl T test acute vs. ctrl Ratio recov/ctrl T test recov vs. ctrl Q7S PPpia P17742 0.78 0.09 0.83 0.21 Q8a Spb6/1 Q60854 1.66 0.02 1.49 0.01 Q8b Spb6/2 Q60854 1.43 0.01 1.42 0.01 Q8S PSpb6 Q60854 1.57 0.01 1.46 <0.01 Q9 Stip1 Q60864 1.72 <0.01 0.94 0.67 Q10 Tcpa P11983 1.55 0.02 1.09 0.55 R1a Btf3/1 Q64152 0.56 0.01 0.50 0.01 R1b Btf3/2 Q64152 0.76 0.05 0.76 0.05 R1S PBtf3 Q64152 0.66 0.02 0.64 0.01 R2 Dcps Q9DAR7 1.30 <0.01 1.20 0.02 R3 Ddx39a Q8VDW0 1.64 0.03 1.31 0.02 R4 Ddx39b Q9Z1N5 1.59 0.03 1.35 0.11 R5 Mgn P61327 0.96 0.60 0.56 0.01 R6a Sf3b2/1 Q3UJB0 1.03 0.91 0.87 0.49 R6b Sf3b2/2 Q3UJB0 1.16 0.44 1.32 <0.01 R6c Sf3b2/3 Q3UJB0 1.26 0.38 1.80 <0.01 R6S PSf3b2 Q3UJB0 1.13 0.54 1.27 0.03 R7 ExoS4 Q921I9 0.88 0.42 0.51 0.02 R8 ExoS6 Q8BTW3 1.50 0.02 1.53 0.01 S1a 14-3-3 gam/1 P61982 0.85 0.28 0.67 0.02 S1b 14-3-3 gam/2 P61982 0.83 0.06 0.91 0.24 S1S P14-3-3 gam P61982 0.84 0.10 0.82 0.07 S2 14-3-3 th P68254 1.31 0.01 1.19 0.04 S3 Cab39 Q06138 0.70 0.03 0.62 <0.01 S4 Fam49b Q921M7 1.47 0.02 1.59 0.05 S5 Gbb1 P62874 1.17 0.03 1.18 0.03 S6a Gnai2/1 P08752 1.33 0.06 1.42 0.05 S6b Gnai2/2 P08752 1.51 <0.01 1.67 0.01 S6S PGnai2 P08752 1.45 0.01 1.59 0.02 S7 Gnb2L1 P68040 0.89 0.02 0.81 <0.01 S8 Grb2 Q60631 1.06 0.83 1.46 0.02 S9 Igbp1 Q61249 1.36 0.06 1.36 0.04 S10 In35 Q9D8C4 1.25 0.04 1.21 0.14 S11 Inpp P49442 2.46 0.01 1.76 0.17 S12 Ppp1ca P62137 1.17 0.07 1.27 0.02 S13a Ppp1r7/1 Q3UM45 0.30 0.02 0.38 0.04 S13b Ppp1r7/2 Q3UM45 0.67 0.02 0.73 0.08 S13c Ppp1r7/3 Q3UM45 0.90 0.51 0.94 0.72 S13S PPpp1r7 Q3UM45 0.61 0.03 0.68 0.06 S14 Ppp6 O00743 1.48 0.03 1.04 0.82 S15a Snd1/1 Q78PY7 0.65 0.03 0.66 0.04 S15b Snd1/2 Q78PY7 0.59 0.02 0.50 0.01 S15c Snd1/3 Q78PY7 0.89 0.34 0.78 0.18 S15d Snd1/4 Q78PY7 1.11 0.34 0.91 0.47 S15S PSnd1 Q78PY7 0.79 <0.01 0.70 0.01 U1 Chip Q9WUD1 0.59 <0.01 0.73 0.11 U2 Csn4 O88544 1.34 0.03 1.37 0.03 U3a Prs8/1 P62196 0.60 <0.01 0.65 <0.01 U3b Prs8/2 P62196 0.85 0.04 0.85 0.22 U3S PPrs8 P62196 0.31 0.33 0.32 0.34 U4a Psa2/1 P49722 0.58 <0.01 0.58 <0.01 U4b Psa2/2 P49722 1.15 0.12 1.28 0.07 U4S PPsa2 P49722 0.86 0.04 0.92 0.36 U5a Psa5/1 Q9Z2U1 0.80 0.01 0.84 0.11 U5b Psa5/2 Q9Z2U1 0.92 0.33 0.99 0.83 U5S PPsa5 Q9Z2U1 0.86 0.07 0.92 0.22 U6 Psb10 O35955 0.73 0.12 0.43 0.02 U7a Psb2/1 Q9R1P3 0.67 0.02 0.76 0.14 U7b Psb2/2 Q9R1P3 0.90 0.36 1.01 0.91 U7S PPsb2 Q9R1P3 0.82 0.09 0.92 0.50 U8 Psb3 mod Q9R1P1 0.47 0.01 0.65 <0.01 U9a Psb4/1 P99026 0.74 0.05 0.69 0.03 U9b Psb4/2 P99026 0.98 0.71 0.94 0.25 U9S PPsb4 P99026 0.90 0.05 0.86 0.01 U10 Psmd14 O35593 1.03 0.61 1.32 <0.01 U11a Psmd2/1 Q8VDM4 0.82 0.22 1.12 0.24 U11b Psmd2/2 Q8VDM4 1.10 0.11 1.09 0.02
Open Access Article. Published on 20 September 2019. Downloaded on 10/10/2019 5:37:27 PM.
This article is licensed under a
which is known to be up-regulated by acetylation.71 In our case, the activity correlated with the amount of the acidic, modified spots and not with the total amount of the protein. For other activities, e.g. lactate dehydrogenase, triose phos-phate isomerase and purine phosphorylase, the activity corre-lated with the total protein amount and not with a single spot. For several other enzymes such as enolase, hexokinase, pyridoxal kinase and isocitrate dehydrogenase, we detected an increase of the protein amount by proteomics and a stable or decreased enzyme activity.
3.5 Mitochondrial potential and glucose consumption Several mitochondrial proteins appeared modulated upon ex-posure of macrophages to silver nanoparticles, among which are a few subunits of the respiratory complexes (NDUV2 and ATPB), some components of the mitochondrial protein
qual-ity control (TRAP1 and CLPP) and an antioxidant protein (PRX3). As this may suggest perturbations in the mitochon-drial functions, we investigated the mitochonmitochon-drial transmem-brane potential. The results, shown in Fig. 5, indicated that all viable cells accumulated rhodamine 123 and thus had a strong mitochondrial transmembrane potential. However, the amount of accumulated rhodamine 123 and thus the level of the mitochondrial transmembrane potential were lower for the acute condition and went back to normal after 72 hours of recovery. As a lower transmembrane potential is indicative of a less efficient oxidative phosphorylation chain, we investi-gated the global metabolism under the three experimental conditions.
We thus measured the glucose consumption during the last 36 hours of the experiments by measuring the remaining glucose in the culture medium at the end of the experiment. The initial medium contained 4.1 g of glucose per liter due
Table 2 (continued)
Spot number Protein name Accession number Ratio acute/ctrl T test acute vs. ctrl Ratio recov/ctrl T test recov vs. ctrl U11c Psmd2/3 Q8VDM4 1.39 0.02 1.13 0.17 U11S PPsmd2 Q8VDM4 1.03 0.70 1.12 0.12 U12 Psmd7 P26516 0.68 0.03 0.68 0.02 U13 Psme1 P97371 1.40 <0.01 1.40 <0.01 U14a Psme2/1 P97372 1.00 0.98 0.71 <0.01 U14b Psme2/2 P97372 1.22 <0.01 1.07 0.34 U14S PPsme2 P97372 1.15 <0.01 0.96 0.50 U15 Ubl7 Q91W67 0.41 0.02 0.88 0.55 V1 Asna1 O54984 1.29 0.09 1.46 <0.01 V2 Chm2a Q9DB34 0.83 <0.01 0.92 0.09 V3 CopE O89079 1.35 0.01 1.41 0.07 V4 Emc2 Q9CRD2 0.56 0.01 0.84 0.07 V5 Erp29 P57759 0.78 0.12 0.68 0.05 V6 Mss4 Q91X96 0.52 0.04 0.64 0.10 V7 Nsf1c Q9CZ44 1.55 0.01 1.51 0.01 V8 Pef1 Q8BFY6 0.64 0.05 0.50 0.02 V9 Snaa Q9DB05 1.53 <0.01 1.99 0.05 V10 Snap23 O09044 0.53 0.02 0.34 0.01 V11 Stxb2 Q64324 2.07 <0.01 1.30 0.09 V12a Tera/1 Q01853 1.31 0.13 1.18 0.16 V12b Tera/2 Q01853 1.49 0.02 1.06 0.38 V12c Tera/3 Q01853 1.39 0.02 1.29 0.04 V12d Tera/4 Q01853 1.48 0.10 1.35 <0.01 V12S PTera Q01853 1.43 0.02 1.25 0.01 V13 Tpd52 Q62393 1.42 0.04 1.31 0.10 V14 Vat1 Q62465 1.48 0.01 1.22 0.15 V15 Vps29 Q9QZ88 1.30 0.05 1.29 0.08 V16a Vps35/1 Q9EQH3 2.44 0.16 2.33 <0.01 V16b Vps35/2 Q9EQH3 1.80 0.17 2.03 0.01 V16c Vps35/3 Q9EQH3 1.53 0.33 2.25 <0.01 V16S PVps35 Q9EQH3 1.79 0.18 2.20 <0.01 V17 Vta1 Q9CR26 2.84 0.01 2.97 0.02 X1 Pdxk Q8K183 1.29 <0.01 1.45 0.02 X2 Spee Q64674 1.55 0.02 1.43 0.07 X3 Sps1 Q8BH69 1.49 0.02 1.95 0.01 X4a Ran/1 P62827| 0.83 0.04 0.87 0.12 X4b Ran/2 P62827| 1.18 0.08 1.11 0.17 X4S PRan P62827| 1.03 0.62 1.00 0.98 Y1 CatD P18242 1.38 0.01 1.48 <0.01 Y2 CatZ Q9WUU7 1.79 0.04 1.08 0.85 Y3 Ncf4 P97369 1.15 0.02 1.19 0.01
P: sum of the different spots identified for the same protein.
Open Access Article. Published on 20 September 2019. Downloaded on 10/10/2019 5:37:27 PM.
This article is licensed under a
to the dilution brought by the addition of fetal serum to ob-tain the complete medium. In the untreated, control cells,
1.8 ± 0.2 g of glucose per liter remained in the culture medium after 36 hours of culture. In contrast, 1 ± 0.05 g of glucose and 0.9 ± 0.04 g of glucose remained in the medium for the acute and recovery conditions, respectively. These differences were statistically significant (Mann Whitney U test, p< 0.05).
The increased glucose consumption in the acute exposure condition could be correlated with the less efficient mito-chondria via a Warburg effect. However, this correlation did not hold for the recovery condition, in which the mitochon-dria appear as efficient as those of the control cells. This may suggest that the silver expulsion process that takes place dur-ing the recovery period consumes a lot of energy.
3.6 Glutathione levels
One of the proteins that is induced after acute exposure to silver nanoparticles is GCLM, i.e. the regulatory subunit of the enzyme involved in the first step of glutathione biosyn-thesis, which is the limiting step of the pathway.72We thus investigated the levels of free glutathione, as studies on pri-mary macrophages had shown that treatment with silver nanoparticles decreased the levels of free glutathione.23This result may be due to the formation of silver–glutathione com-plexes.73We thus measured by flow cytometry the proportion of cells with high levels of reduced glutathione, and the level of glutathione in this population. The results, shown in Fig. 6, indicated that the glutathione level is only 70% of the normal one just after the exposure to silver nanoparticles, and is 85% of the normal after 3 days of recovery. Thus, here again, the increase in GCLM amount can be interpreted as a cellular mechanism to compensate for the decrease of free glutathione caused by silver.
3.7 Actin cytoskeleton and phagocytosis
Cytoskeletal proteins, especially proteins implicated in the actin cytoskeleton dynamics, were among the most important classes emerging from the proteomic screen. Of note, many of these proteins have activities that are modulated by phosphorylation, such as cofilin74,75or Rho-GDIs.76,77As the regulation patterns
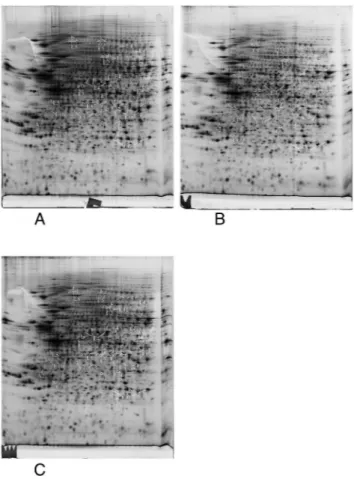
Fig. 4 Proteomic analysis of total cell extracts by 2D electrophoresis. Total cell extracts of RAW274.7 cells were separated by two-dimensional gel electrophoresis. The first dimension covered a 4–8 pH range and the second dimension a 15–200 kDa range. Total cellular proteins (150 μg) were loaded on the first dimension gel. A: Gel obtained from control cells. B: Gel obtained from cells treated for 24 hours with 20μg ml−1 sil-ver nanoparticles. C: Gel obtained from cells treated for 24 hours with 20μg ml−1silver nanoparticles and left to recover for 72 hours. Only the proteins involved in apoptosis (A), energy metabolism (E) and control of cell fate and proliferation (F) are shown in this figure.
Table 3 Enzyme activities
Enzyme Control Acute Recov Ctrl + silver ion LDH 74.4 ± 2.75 68.9 ± 1.14* 73.8 ± 4.13 ND MDH 37.4 ± 0.95 31.3 ± 2.85* 31.7 ± 2.36* ND TPIS 70.7 ± 8.75 76.6 ± 5.58 76.3 ± 7.80 ND BVR 0.67 ± 0.04 0.53 ± 0.1* 0.79 ± 0.06* ND PDXK 7.4 ± 0.95 5.9 ± 0.6* 7.5 ± 0.68* ND GAPDH 157.12 ± 14.5 144.25 ± 9.77 157.44 ± 5.91 ND 6PGDH 30.69 ± 3.17 39.37 ± 4.92* 38.75 ± 1.24* ND PNPH 8.97 ± 1.17 9.12 ± 1.6 9.06 ± 0.77 ND HXK 23.4 ± 3.04 16.3 ± 4* 23.3 ± 2.45 (1μM) 14.2 ± 2.93 ENO 214.5 ± 13.6 166.4 ± 28.1* 184 ± 41 (10μM) 167 ± 12.4 IDHC 16.37 ± 1.48 17.62 ± 2.79 23.75 ± 2.97** (5μM) 8.06 ± 1.09 All the activities are expressed in nmol substrate converted per min per mg total protein. Statistical significance of the results in the Student T test: *p < 0.05. ND: not determined. Abbreviations: LDH: lactate dehydrogenase; MDH: malate dehydrogenase; TPIS: triose phosphate isomerase; BVR: biliverdine reductase; PDXK: pyridoxal kinase; GAPDH: glyceraldehyde phosphate dehydrogenase; 6PGDH: 6-phosphogluconate dehydrogenase; PNPH: purine nucleoside phosphorylase; HXK: hexokinase; ENO: enolase; IDHC: NADPH-dependent isocitrate dehydrogenase.
Open Access Article. Published on 20 September 2019. Downloaded on 10/10/2019 5:37:27 PM.
This article is licensed under a
that emerged from the proteomic screen for these proteins were very complex, with some spots modulated while others were constant, we directly examined the consequences on the actin cytoskeleton. The results, shown in Fig. 7, indicated a strong vesicularization of the cells during the recovery period.
Phagocytosis is one of the specialized functions of the macrophages that is highly dependent on the actin cytoskele-ton. We thus tested the phagocytic activity of the cells. The results, shown in Fig. 8, indicated that the proportion of phagocytic cells does not change upon treatment with silver nanoparticles. However, the number of internalized particles per cell, as described by the mean fluorescence, slightly de-creased immediately after exposure to nanoparticles and went back to quasi-normal values after 72 hours of recovery. 3.8 NO and cytokine production, redox balance
Production of nitric oxide and pro-inflammatory cytokines such as IL-6 and TNF upon stimulation is another specialized
function of macrophages. We thus investigated their produc-tion after treatment of macrophages with silver nanoparticles under two schemes: either after treatment with nanoparticles only, or after treatment with nanoparticles and lipopolysac-charide (LPS) for the last 24 hours of culture. The first scheme investigated the intrinsic pro-inflammatory action of the nanoparticles, while the second one investigated the interference of nanoparticles with a standard pro-inflammatory response induced by a bacterial stimulus. The results, shown in Fig. 9, indicated that silver nanoparticles have a weak but significant intrinsic pro-inflammatory effect, as detected from NO and TNF production, which returned to normal values after the recovery period. The situation was however very different for the combined nanoparticle–LPS treatment. In this case, the acute exposure condition did not differ significantly from the control cells (exposed to LPS only), while the cytokine and NO production were signifi-cantly lower after the recovery period. As the NO production
Fig. 5 Mitochondrial transmembrane potential analysis. The rhodamine 123 accumulation method was used. Panel A: Proportion of rhodamine123-positive cells in the viable cell population. Panel B: Mean rhodamine 123 fluorescence (in the viable cell population only). Symbols indicate the statis-tical significance (Student's T-test): *: p < 0.05. ctrl: Non exposed cells. acute: Cells exposed for 24 hours to silver nanoparticles (20 μg ml−1). recov: Recovering cells (72 hours post exposure to silver nanoparticles). Symbols indicate the statistical significance (Student's T-test): *: p < 0.05.
Fig. 6 Free glutathione levels. The chlorobimane (mCB) conjugation method was used. Panel A: Proportion of GSH-positive cells in the viable cell population. Panel B: Mean GSH-mCB conjugate fluorescence (in the viable cell population only). Symbols indicate the statistical significance (Stu-dent's T-test): ***: p < 0.001. ctrl: Non exposed cells. acute: Cells exposed for 24 hours to silver nanoparticles (20 μg ml−1). recov: Recovering cells (72 hours post exposure to silver nanoparticles).
Open Access Article. Published on 20 September 2019. Downloaded on 10/10/2019 5:37:27 PM.
This article is licensed under a
is NADPH-dependent, we investigated the NADP–NADPH levels after treatment with nanoparticles. The results, shown in Table 4, indicated that both the total NADP + NADPH and NADPH levels were similar for the three conditions tested.
4. Discussion
Silver nanoparticles are usually produced through a wet route and need to be stabilized as soon as prepared to avoid irre-versible aggregation. Stabilization of AGNPs is usually achieved through interaction with complex ions such as cit-rate, or by polymers such as polyethylene glycol or
poly-vinylpyrrolidone (PVP). As such, PVP-coated silver nano-particles are industrial products used in several applications including as antibacterial compounds,78conductive inks,79–81 and sensors,82 and in electromechanics.83 In the course of their use, nanoparticles can be aerosolized. In this case they can contaminate living organisms without being modified. In the specific case of inhalation contamination, the nano-particles reach the alveolae where there will be internalized by the lung macrophages, which is the reason why we made the choice to use this cell type in this study. Regarding other environmental dispersion routes, PVP-coated silver nano-particles have been shown to be the most resistant in fresh-water environments,84and thus recommended for ecotoxico-logical testing.84 The PVP-coated silver nanoparticles, therefore, appear to be relevant for assessing the toxicity of silver nanoparticles.
Most of the toxicological studies on nanoparticles use an acute exposure scheme; they expose cells to a high, but non-lethal dose. Such a scheme does not represent chronic daily exposure under, for example, occupational conditions, but may represent the dose following an accidental exposure. To fully evaluate the toxicity of AgNPs, it is therefore important to know not only the acute effects post exposure, but also how cells recover from such exposures to high dosages of AgNPs. To accomplish this, a ternary comparison must be made between cells before and immediately after treatment and also between cells at the end of a recovery period. In this experimental frame, the acute exposure point is not the pri-mary focus of attention. We therefore decided not to investi-gate in detail the role of silver ions in the acute response, based on the fact that the rather large silver nanoparticles used in this study dissolve to a very low extent,23producing free silver ion concentrations that are far below the LD20 ob-served for silver ions. Furthermore, this aspect has been in-vestigated in numerous studies (e.g. in ref. 8, 15, 59 and 85) and the general outcome of these studies is that the mecha-nisms observed for silver nanoparticles cannot be explained by silver ions, at least for large nanoparticles.15
In this frame, the proteomic approach is of interest be-cause it can be used to explore not only a few parameters, as
Fig. 7 Confocal imaging of the F-actin cytoskeleton. Only one confo-cal plane inside the cells is shown (going through the cell nucleus). A: Unexposed cells. B: Acutely-exposed cells. C: Recovering cells. Silver-treated cells show an important vesicularization, compatible with the presence of nanoparticles within the cell phagosomes.
Fig. 8 Phagocytosis. The phagocytic capacity was assessed by fluorescent latex bead internalization. Panel A: Proportion of positive cells in the viable cell population. Panel B: Mean cellular fluorescence (in the viable cell population only). ctrl: Non exposed cells. acute: Cells exposed for 24 hours to silver nanoparticles (20μg ml−1). recov: Recovering cells (72 hours post exposure to silver nanoparticles).
Open Access Article. Published on 20 September 2019. Downloaded on 10/10/2019 5:37:27 PM.
This article is licensed under a
targeted approaches do, but also can be used to investigate a few hundred parameters at the same time, i.e. the abun-dances of the various proteins analyzed in a proteomic screen. In this respect, the use of a 2D gel-based proteomic approach may appear as a medium scale approach, compared to deep shotgun proteomic approaches. However, compared to shotgun proteomics, 2D gels have the unique ability to separate protein forms, without the requirement that they ap-pear as a single product. With growing recognition of the
im-portance of post-translational modifications, the ability to do this is biologically relevant. Indeed, we have shown both in this study and in previous ones53,86that some enzyme activi-ties correlate with a single protein form and not with the sum of all the protein forms, showing the relevance of this parameter.
First, we performed a global analysis of the proteomic re-sults. Both the principal component analysis and the analysis of similarity (ANOSIM) indicated that the recovery state was
Fig. 9 NO and cytokine production. NO, TNF-alpha and IL-6 production were measured under the different cell culture conditions, with and with-out further exposure to LPS. ctrl: Non exposed cells. acute: cells exposed for 24 hours to silver nanoparticles (20μg ml−1). recov: Recovering cells (72 hours post exposure to silver nanoparticles). Symbols indicate the statistical significance (Student's T-test): *: p < 0.05 ; **: p < 0.01 ; ***: p < 0.001. A and B: NO production, without (panel A) and with (panel B) exposure to LPS. C and D: TNF-alpha production, without (panel C) and with (panel D) exposure to LPS. E: IL-6 production with exposure to LPS. IL-6 is undetectable under the three culture conditions tested when the cells are not exposed to LPS.
Open Access Article. Published on 20 September 2019. Downloaded on 10/10/2019 5:37:27 PM.
This article is licensed under a