EUROPEAN ORGANISATION FOR NUCLEAR RESEARCH (CERN)
Submitted to: JHEP CERN-EP-2017-175
14th August 2017
Evidence for the H → b ¯b decay with the ATLAS
detector
The ATLAS Collaboration
A search for the decay of the Standard Model Higgs boson into a b¯b pair when produced in association with a W or Z boson is performed with the ATLAS detector. The analysed data, corresponding to an integrated luminosity of 36.1 fb−1, were collected in proton–proton collisions in Run 2 of the Large Hadron Collider at a centre-of-mass energy of 13 TeV. Final states containing zero, one and two charged leptons (electrons or muons) are considered, targeting the decays Z → νν, W → `ν and Z → ``. For a Higgs boson mass of 125 GeV, an excess of events over the expected background from other Standard Model processes is found with an observed significance of 3.5 standard deviations, compared to an expectation of 3.0 standard deviations. This excess provides evidence for the Higgs boson decay into b-quarks and for its production in association with a vector boson. The combination of this result with that of the Run 1 analysis yields a ratio of the measured signal events to the Standard Model expectation equal to 0.90 ± 0.18(stat.)+0.21−0.19(syst.). Assuming the Standard Model production cross-section, the results are consistent with the value of the Yukawa coupling to b-quarks in the Standard Model.
c
2017 CERN for the benefit of the ATLAS Collaboration.
Reproduction of this article or parts of it is allowed as specified in the CC-BY-4.0 license.
Contents
1 Introduction 3
2 ATLAS detector 4
3 Dataset and simulated event samples 5
4 Object and event selection 7
4.1 Object reconstruction 7
4.2 Event selection and categorisation 10
4.2.1 Zero-lepton selection 13
4.2.2 One-lepton selection 14
4.2.3 Two-lepton selection 14
4.3 Selection for the dijet-mass analysis 15
5 Multivariate analysis 16
6 Estimation of the multi-jet background 16
6.1 0-lepton channel 17
6.2 1-lepton channel 18
6.3 2-lepton channel 19
7 Systematic uncertainties 19
7.1 Experimental uncertainties 19
7.2 Simulated background uncertainties 20
7.3 Multi-jet background uncertainties 24
7.4 Signal uncertainties 24
8 Statistical analysis 26
8.1 Analysis of the 13 TeV data 26
8.2 Dijet-mass analysis 28
8.3 Diboson analysis 28
8.4 Combination with Run 1 data 29
9 Results 30
9.1 Results of the SM Higgs boson search at √s= 13 TeV 31
9.2 Results of the dijet-mass analysis 37
9.3 Results of the diboson analysis 39
9.4 Results of the combination with Run 1 40
1 Introduction
The Higgs boson, predicted more than 50 years ago [1–4], was discovered in 2012 by the ATLAS and CMS Collaborations [5,6], analysing the results of proton–proton (pp) collisions produced by the Large Hadron Collider (LHC) [7]. The properties of the discovered particle have been measured using the Run 1 dataset, collected at centre-of-mass energies of 7 TeV and 8 TeV, and were found to be compatible with those predicted by the Standard Model (SM) within uncertainties, typically of the order of ±20% [8–
11]. The Run 2 dataset at an energy of 13 TeV provides an opportunity to increase the precision of such measurements, and to challenge theory predictions further. While analyses of Higgs bosons decaying into vector bosons are entering an era of detailed differential measurements, direct evidence for the coupling of the Higgs boson to fermions was established only via the observation of the decay into τ-leptons through the combination of ATLAS and CMS Run 1 results [11], and, more recently, through the combination of CMS Run 1 and Run 2 results [12]. Although the gluon–gluon fusion production mode provides indirect evidence for the coupling of the Higgs boson to top quarks, there is currently no direct observation of the coupling of the Higgs boson to quarks.
The decay of the SM Higgs boson into pairs of b-quarks is expected to have a branching ratio of 58% for mH = 125 GeV [13], the largest among all decay modes. Accessing H → b¯b decays is therefore crucial
for constraining, under fairly general assumptions [14,15], the overall Higgs boson decay width. At the LHC, the very large backgrounds arising from multi-jet production make an inclusive search extremely challenging. The most sensitive production modes for probing H → b¯b decays are those where the Higgs boson is produced in association with a W or Z boson [16]; their leptonic decay modes lead to clean signatures that can be efficiently triggered on, while rejecting most of the multi-jet backgrounds.
Searches for a Higgs boson in the b¯b decay mode were conducted at the Tevatron by the CDF and D0 Collaborations. They reported an excess of events in V H associated production (where V is used to denote Wor Z) in the mass range of 120 GeV to 135 GeV, with a global significance of 3.1 standard deviations, and a local significance of 2.8 standard deviations at a mass of 125 GeV [17]. ATLAS and CMS reported results from Run 1 each using approximately 25 fb−1 of integrated luminosity [18, 19]. Excesses of events consistent with a Higgs boson with a mass of 125 GeV were observed in V H associated production with significances of 1.4 and 2.1 standard deviations by ATLAS and CMS, respectively. Searches for the Higgs boson decay into b¯b have been also performed for the vector-boson fusion (VBF) [20,21] and t¯tH[22,23] production modes, but with sensitivities smaller than for V H production. The combination of the Run 1 ATLAS and CMS analyses resulted in observed and expected significances of 2.6 and 3.7 standard deviations for the H → b¯b decay mode, respectively [11].
This article reports on the search for the SM Higgs boson in the V H production mode and decaying into a b¯b pair with the ATLAS detector in Run 2 of the LHC, using an integrated luminosity of 36.1 fb−1. Three main signatures are explored, ZH → ννb¯b, W H → `νb¯b and ZH → ``b¯b. The respective analysis categories that target these decay modes are referred to as the 0-, 1- and 2-lepton channels, based on the number of selected charged leptons. In this article, the term "lepton", unless modified by a qualifier, refers to electron and muon. A b-tagging algorithm is used to identify the jets consistent with originating from a H → b¯b decay. In order to maximise the sensitivity to the Higgs boson signal, a set of observables encoding information about event kinematics and topology is combined into a multivariate discriminant. A binned maximum-likelihood fit, referred to as the global likelihood fit, is applied to data simultaneously across the three channels in multiple analysis regions. The likelihood fit uses the multivariate discriminant as the main fit observable, in order to extract the signal yield and normalisations of the main backgrounds. The signal extraction method is validated with two other analyses: the dijet-mass analysis, where the
signal yield is extracted using the mass of the dijet system of b-tagged jets as the main fit observable, and the diboson analysis, where the nominal multivariate analysis is modified to extract the (W/Z)Z diboson process, with the Z boson decaying into b¯b. The combination of the results of the Higgs boson search with those of the previously published analysis of the Run 1 dataset [18] is also presented.
2 ATLAS detector
ATLAS [24] is a general-purpose particle detector covering nearly the entire solid angle1 around the collision point. It consists of an inner tracking detector surrounded by a thin superconducting solenoid, electromagnetic and hadronic calorimeters, and a muon spectrometer incorporating three large supercon-ducting toroidal magnets.
The inner tracking detector (ID or inner detector in the rest of the article), located within a 2 T axial mag-netic field generated by the superconducting solenoid, is used to measure the trajectories and momenta of charged particles. The inner layers, consisting of high-granularity silicon pixel detectors, instrument a pseudorapidity range |η| < 2.5. A new innermost silicon pixel layer, the insertable B-layer [25] (IBL), was added to the detector between Run 1 and Run 2. The IBL improves the ability to identify displaced vertices and thereby significantly improves the b-tagging performance [26]. Silicon strip detectors cov-ering |η| < 2.5 are located beyond the pixel detectors. Outside the strip detectors and covcov-ering |η| < 2.0, there are straw-tube tracking detectors, which also provide measurements of transition radiation that are used in electron identification.
The calorimeter system covers the pseudorapidity range |η| < 4.9. Within the region |η| < 3.2, electro-magnetic calorimetry is provided by barrel (|η| < 1.475) and endcap (1.375 < |η| < 3.2) high-granularity lead/liquid-argon (LAr) electromagnetic calorimeters, with an additional thin LAr presampler covering |η| < 1.8 to correct for energy loss in material upstream of the calorimeters. Hadronic calorimetry is provided by a steel/scintillator-tile calorimeter, segmented into three barrel structures within |η| < 1.7, and two copper/LAr hadronic endcap calorimeters extend the coverage to |η| = 3.2. The solid angle cov-erage for |η| between 3.2 and 4.9 is completed with copper/LAr and tungsten/LAr calorimeter modules optimised for electromagnetic and hadronic measurements, respectively.
The outermost part of the detector is the muon spectrometer, which measures the curved trajectories of muons in the field of three large air-core toroidal magnets. High-precision tracking is performed within the range |η| < 2.7 and there are chambers for fast triggering within the range |η| < 2.4.
A two-level trigger system [27] is used to reduce the recorded data rate. The first level is a hardware implementation that makes use of only a subset of the total available information to make fast decisions to accept or reject an event, aiming to reduce the rate to approximately 100 kHz, and the second level is the software-based high-level trigger that provides the remaining rate reduction to approximately 1 kHz.
1ATLAS uses a right-handed coordinate system with its origin at the nominal interaction point (IP) in the centre of the detector
and the z-axis coinciding with the axis of the beam pipe. The x-axis points from the IP towards the centre of the LHC ring, and the y-axis points upward. Cylindrical coordinates (r,φ) are used in the transverse plane, φ being the azimuthal angle around
the z-axis. The pseudorapidity is defined in terms of the polar angle θ as η= − ln tan(θ/2). The distance in (η,φ) coordinates,
∆R = p(∆φ)2+ (∆η)2, is also used to define cone sizes. Transverse momentum and energy are defined as p
T = p sin θ and
3 Dataset and simulated event samples
The data used in this analysis were collected at a centre-of-mass energy of 13 TeV during the 2015 and 2016 running periods, and correspond to integrated luminosities of 3.2 ± 0.1 fb−1 and 32.9 ± 1.1 fb−1, respectively [28]. They were collected using missing transverse momentum (EmissT ) triggers for the 0-and 1-lepton channels 0-and single-lepton triggers for the 1- 0-and 2-lepton channels. Events are selected for analysis only if they are of good quality and if all the relevant detector components are known to be in good operating condition. In the combined dataset, the recorded events have an average of 25 inelastic ppcollisions (the collisions other than the hard scatter are referred to as pile-up).
Monte Carlo (MC) simulated events are used to model the SM background and V H, H → b¯b signal pro-cesses. All simulated processes are normalised using the most accurate theoretical predictions currently available for their cross-sections. Data-driven methods are used to estimate the multi-jet background from strong interactions (QCD) for the 1-lepton channel, as discussed in Section6. This background is negligible in the other channels, as a result either of the high EmissT requirement and dedicated selection criteria (0-lepton channel) or of the two lepton selection (2-lepton channel).
All samples of simulated events were passed through the ATLAS detector simulation [29] based on GEANT 4 [30] and are reconstructed with the standard ATLAS reconstruction software. The effects of
pile-up from multiple interactions in the same and nearby bunch crossings were modelled by overlaying minimum-bias events, simulated using the soft QCD processes of Pythia 8.186 [31] with the A2 [32] set of tuned parameters (tune) and MSTW2008LO [33] parton distribution functions (PDF). For all samples of simulated events, except for those generated using Sherpa [34], the EvtGen v1.2.0 program [35] was used to describe the decays of bottom and charm hadrons. A summary of all the generators used for the simulation of the signal and background processes is shown in Table1.
Simulated events for qq → V H plus zero or one jet production at next-to-leading order (NLO) were generated with the Powheg-Box v2 + GoSam + MiNLO generator [37,40–42] (named Powheg+MiNLO in the rest of the article). The contribution from gg → ZH (gluon-induced) production was simulated using the leading-order (LO) Powheg-Box v2 matrix-element generator. An additional scale factor is applied to the qq → V H processes as a function of the vector boson’s transverse momentum to account for electroweak (EW) corrections at NLO. This makes use of the V H differential cross-section computed with Hawk [71, 72]. The samples of simulated events include all final states where the Higgs boson decays into b¯b and the vector boson to a leptonic final state, including those with a τ-lepton. The analysis has only a small acceptance for other Higgs boson production and decay modes which are therefore neglected. The mass of the Higgs boson was fixed at 125 GeV and the H → b¯b branching fraction was fixed at 58%. The inclusive pp → V H cross-sections [43–49] were calculated at next-to-next-to-leading order (NNLO) (QCD) and NLO (EW). Electroweak corrections include the photon-induced contributions, which are of the order of 5% for the W H → `νb¯b process and 1% for the ZH → ``b¯b process. For the gluon-induced ZH production, the cross-section is calculated at next-to-leading order and next-to-leading-logarithm accuracy (NLO+NLL) in QCD [50–54]. This is then subtracted from the inclusive pp → ZH production cross-section to estimate the quark-induced contribution to the cross-section.
For the generation of tt at NLO, the Powheg-Box v2 generator [55] was used. Single top quark events in the Wt-, s- and t-channels were generated using the Powheg-Box v1 generator [58,64]. The top quark mass was set to 172.5 GeV. Events were filtered such that at least one W boson in each event decays leptonically. The overall yield predicted for the tt process is rescaled according to the NNLO cross-section, including the resummation of soft gluon emission at next-to-next-to-leading-logarithm accuracy
Table 1: The generators used for the simulation of the signal and background processes. If not specified, the order
of the cross-section calculation refers to the expansion in the strong coupling constant (αS). The acronyms ME,
PS and UE stand for matrix element, parton shower and underlying event, respectively. (?) The events were
gen-erated using the first PDF in the NNPDF3.0NLO set and subsequentially reweighted to PDF4LHC15NLO set [36]
using the internal algorithm in Powheg-Box v2. (†) The NNLO(QCD)+NLO(EW) cross-section calculation for the
pp → ZHprocess already includes the gg → ZH contribution. The qq → ZH process is normalised using the
NNLO(QCD)+NLO(EW) cross-section for the pp → ZH process, after subtracting the gg → ZH contribution.
Process ME generator ME PDF PS and UE model Cross-section
Hadronisation tune order
Signal
qq → W H Powheg-Box v2 [37]+ NNPDF3.0NLO(?)[38] Pythia8.212 [31] AZNLO [39] NNLO(QCD)+
→`νb¯b GoSam [40]+ MiNLO [41,42] NLO(EW) [43–49]
qq → ZH Powheg-Box v2 + NNPDF3.0NLO(?) Pythia8.212 AZNLO NNLO(QCD)(†)+
→ννb¯b/``b¯b GoSam + MiNLO NLO(EW)
gg → ZH Powheg-Box v2 NNPDF3.0NLO(?) Pythia8.212 AZNLO NLO+
→ννb¯b/``b¯b NLL [50–54]
Top quark
t¯t Powheg-Box v2 [55] NNPDF3.0NLO Pythia8.212 A14 [56] NNLO+NNLL [57] s-channel Powheg-Box v1 [58] CT10 [59] Pythia6.428 [60] P2012 [61] NLO [62]
t-channel Powheg-Box v1 [58] CT10f4 Pythia6.428 P2012 NLO [63]
Wt Powheg-Box v1 [64] CT10 Pythia6.428 P2012 NLO [65]
Vector boson+ jets
W →`ν Sherpa 2.2.1 [34,66,67] NNPDF3.0NNLO Sherpa 2.2.1 [68,69] Default NNLO [70] Z/γ∗→``
Sherpa 2.2.1 NNPDF3.0NNLO Sherpa 2.2.1 Default NNLO
Z →νν Sherpa 2.2.1 NNPDF3.0NNLO Sherpa 2.2.1 Default NNLO
Diboson
WW Sherpa 2.1.1 CT10 Sherpa 2.1.1 Default NLO
WZ Sherpa 2.2.1 NNPDF3.0NNLO Sherpa 2.2.1 Default NLO
ZZ Sherpa 2.2.1 NNPDF3.0NNLO Sherpa 2.2.1 Default NLO
(NNLL) as available in Top++2.0 [57]. The overall yields predicted for single top quark production in the s-, t-, and Wt-channels are rescaled according to their respective NLO cross-sections [62,63,65]. Events containing W or Z bosons with jets (V+ jets) were simulated using the Sherpa 2.2.1 generator. Matrix elements were calculated for up to two partons at NLO and four partons at LO using the Open-Loops [66] and Comix [67] matrix-element generators. The number of expected V+jets events is rescaled using the NNLO cross-sections [70].
Diboson WZ and ZZ (referred to as VZ) processes were generated using Sherpa 2.2.1, which calculates up to one additional parton at NLO and up to three additional partons at LO. The WW process was generated using Sherpa 2.1.1, which calculates the inclusive production at NLO, and up to three additional partons at LO. The cross-section from Sherpa at NLO are used to normalise the events.
Samples produced with alternative generators are used to estimate systematic uncertainties in the event modelling, as described in Section7.
4 Object and event selection
Events with two jets tagged as containing b-hadrons and with either zero, one or two charged leptons (electrons or muons) are selected in this analysis. In the following, the physics objects and the event selection for each channel are described.
4.1 Object reconstruction
Interaction vertices are reconstructed [73] from tracks measured by the inner detector. The vertex with the highest sum of squared transverse momenta of all associated tracks is selected as the primary vertex, whereas all others are considered to be pile-up vertices.
Electrons are reconstructed [74,75] by applying a sliding-window algorithm to noise-suppressed clusters of energy deposited in the calorimeter and matching to a track in the inner detector. Their energy cal-ibration is based primarily on a data sample of Z → e+e−events [76]. Electron candidates are required to satisfy criteria for the shower shape, track quality and track-to-cluster match, corresponding to either the loose or tight likelihood-based requirements, denoted “LooseLH” and “TightLH” in Ref. [74]. All electrons are required to have pT > 7 GeV and |η| < 2.47. Non-prompt and pile-up tracks are rejected
by requiring small transverse (IPrφ) and longitudinal (IPz) impact parameters, defined with respect to the
primary vertex position:2 tracks must have |IPrφ|/σIPrφ < 5 and |IPz| < 0.5 mm, with σIPrφ representing the uncertainty in the transverse impact parameter. A loose isolation requirement is applied: the electron track must be isolated from other tracks reconstructed in the inner detector, based on a variable cone size with∆Rmax = 0.2, with a requirement that is tuned to yield a constant 99% efficiency as a function of
electron pT. Tight electrons are also required to pass a more stringent calorimeter-based isolation
require-ment, where the sum of the transverse energy of all the clusters of calorimeter cells, not associated with the electron candidate but found within a cone of∆R = 0.2 around the electron track, is required to be below 3.5 GeV.
Muons are reconstructed [77, 78] as tracks in the inner detector matched to tracks in the muon spectro-meter up to |η|= 2.5. Some acceptance is gained up to |η| = 2.7 using the muon spectrometer alone, and within the region |η| < 0.1 of limited muon-chamber acceptance, using tracks reconstructed in the inner detector that do not have a full matching track in the muon spectrometer, but have deposited energy in the calorimeter that is consistent with the energy loss of a muon. Two selection categories are defined: looseand medium, based on the respective muon identification criteria defined in Ref. [78]. All muon candidates are required to have pT> 7 GeV, and not to be matched to an inner detector track that is likely
to arise from a non-prompt muon or from pile-up, by applying impact parameter requirements similar to those for the electron selection: |IPrφ|/σIPrφ < 3 and |IPz| < 0.5 mm. A loose isolation requirement
is applied, based on the momenta of tracks in the inner detector which lie within a variable-size cone, with∆Rmax = 0.3, around the muon track; analogously to the electron case, the requirement is tuned to
yield a 99% efficiency for any value of pT. For medium quality muons, a stringent track-based isolation
requirement is applied, where the sum of the pTof all the tracks found within a cone of∆R = 0.2 around
the muon track is required to be below 1.25 GeV.
Jets are reconstructed from noise-suppressed energy clusters in the calorimeter [79] with the anti-kt
al-gorithm [80,81] with radius parameter R= 0.4. The energies of the jets are calibrated using a jet energy
scale correction (JES) derived from both simulation and in situ calibration using data [82,83]. Jet clean-ing criteria are applied to find jets arisclean-ing from non-collision sources or noise in the calorimeters and any event containing such a jet is removed [84,85]. Jets with pT below 60 GeV and with |η| < 2.4 have to
pass a requirement on the jet vertex tagger (JVT) [86], a likelihood discriminant that uses track and vertex information in order to suppress jets originating from pile-up activity. Jets in the central region (|η| < 2.5) are required to have pT > 20 GeV. For jets in the forward region (2.5 ≤ |η| < 4.5), thus outside the
acceptance of the inner detector, a stricter requirement of pT > 30 GeV is applied in order to suppress jets
from pile-up activity.
Jets in the central region can be tagged as containing b-hadrons by using a multivariate discriminant (MV2c10) [87, 88] that combines information from an impact-parameter-based algorithm, from the explicit reconstruction of a secondary vertex and from a multi-vertex fitter that attempts to reconstruct the full b- to c-hadron decay chain. A significantly improved algorithm, which also profits from the addition of the IBL detector, was developed for Run 2 [88]. At the chosen working point, the improved algorithm provides nominal light-flavour (u,d,s-quark and gluon) and c-jet misidentification efficiencies of 0.3% and 8.2%, respectively, for an average 70% b-jet tagging efficiency, as estimated from simulated t¯t events for jets with pT > 20 GeV and |η| < 2.5. The flavour tagging efficiencies in simulation are corrected
separately for b-, c- and light-flavour jets, based on the respective data-based calibration analyses. The ratio of the efficiencies in data and simulation is close to unity for b-jets, while more significant corrections are needed for c- and light-flavour jets, up to ≈ 1.4 and ≈ 2, respectively.
Simulated jets are labelled according to which hadrons with pT > 5 GeV are found within a cone of size
∆R = 0.3 around the jet axis. If a b-hadron is found the jet is labelled as a b-jet. If no b-hadron is found, but a c-hadron is present, then the jet is labelled as a c-jet. Otherwise the jet is labelled as a light (i.e., u,d,s-quark, or gluon) jet. Simulated V + jets events are categorised depending on the generator-level truthlabels of the jets in the event that are selected to form the Higgs boson candidate: V + bb, V + bc, V+ cc, V + bl, V + cl, V + ll where b, c, l stand for b-jet, c-jet and light-jet respectively. An inclusive V+ heavy flavour (V + HF) category is defined as containing the first four: V + bb, V + bc, V + cc, V + bl. The V+ bb component is dominant: its fraction ranges from 70% to 90% of V + HF events, depending on the channel and analysis region.
Hadronically decaying τ-leptons are reconstructed [89,90] as jets from noise-suppressed energy clusters, using the anti-kt algorithm with radius parameter R = 0.4. They are required to have exactly one or
three matching tracks in the inner detector within a cone of size∆R = 0.2 around the jet axis, to have pT > 20 GeV and |η| < 2.5, and to be outside the transition region between the barrel and endcap
calor-imeters (1.37 < |η| < 1.52). To reject jets being reconstructed and identified as τ-leptons, a multivariate approach using boosted decision trees is employed, based on information from the calorimeters and from the tracking detectors; and the medium quality criteria described in Ref. [90] are applied. Hadronically decaying τ-leptons are only used in the analysis in the overlap removal procedure described at the end of this subsection. This has an impact on the determination of the event’s jet multiplicity.
The uncertainty in the expected number of events depends on the size of the samples of simulated events. The combination of processes with large production cross-section and small selection efficiencies can make the production of samples exceeding the integrated luminosity of the data challenging. For cases where the small selection efficiency is due to the high rejection achieved by the application of b-tagging, a method called parameterised tagging is applied. Unlike when explicitly applying the b-tagging algorithm (direct tagging), in parameterised tagging all jets are kept but the event is weighted by the expected probability for a jet with a certain flavour label (b, c or light) to be tagged as a b-jet. These probabilities are parameterised as a function of jet kinematics (pT and η) based on a large sample of simulated t¯t
events. Parameterised tagging is used for the V+ cc, V + cl, V + ll and WW samples, which simulate small background contributions (< 2% of the total background). For all other samples, direct tagging is applied.
In addition to the JES correction, two more corrections are applied to b-tagged jets. The muon-in-jet correction is applied when a medium quality muon with pT > 5 GeV is found within ∆R = 0.4 of a jet,
to account for the presence of b- and c-hadron decays into muons which do not deposit their full energy in the calorimeter. Unlike in the lepton selection introduced previously, no isolation criteria are applied. When more than one muon is found, the one closest to the jet axis is chosen. The muon four-momentum is added to that of the jet, and the energy deposited by the muon in the calorimeter is removed. To further improve the jet response, a second correction, denoted PtReco, is applied as a function of jet pT.
This correction is based on the residual difference in jet response expected from the signal simulation between the reconstructed b-jets (with all corrections previously applied) and the corresponding truth jets (formed by clustering final-state particles taken from the Monte Carlo truth record, including muons and neutrinos). This correction increases the energy of jets with pT ∼ 20 GeV by 12% and the energy of those
with pT > 100 GeV by 1%. A larger correction is applied in case a muon or electron is identified within
∆R = 0.4 of the jet axis, to account for the missing neutrino energy.
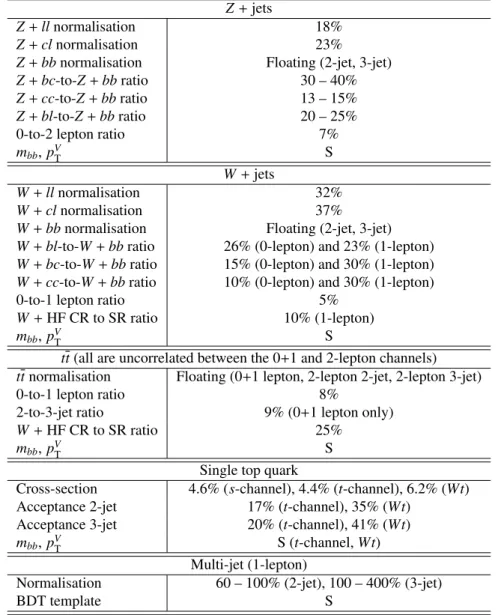
In the 2-lepton channel, where the ZH → ``b¯b event kinematics can be fully reconstructed, a per-event kinematic likelihood fit, described in more detail in Ref. [18], is used to improve the estimate of the energy of the two b-jets, in place of the PtReco correction. These corrections result in an improved mbb
mass distribution in the region of the Higgs boson signal, as illustrated in Figure1; the central value is moved closer to its nominal value, and the resolution is improved by up to about 40%.
[GeV]
bb
m
20 40 60 80 100 120 140 160 180
Arbitrary units / 5 GeV
0 0.2 0.4 0.6 0.8 1 1.2 1.4 1.6 1.8 2 ATLAS Simulation -1 = 13 TeV, 36.1 fb s b b -l + l → Powheg MINLO SM ZH 150 GeV ≥ Z T p
2 leptons, 2 jets, 2 b-tags
Std. σ )/ σ - Std. σ ( σ
Standard Jet Calibration (Std.) -in-jet Correction
µ
Std. +
-in-jet + PtReco Correction
µ
Std. +
-in-jet + Kinematic Likelihood Fit
µ Std. + 15.2 GeV 0 % 13.2 GeV 13 % 12.4 GeV 18 % 8.8 GeV 42 %
Figure 1: Comparison of the mbb distributions as additional corrections are applied to the jet energy scale, shown
for simulated events in the 2-lepton channel in the 2-jet and pZT > 150 GeV region. A fit to a Bukin function [91]
is superimposed on each distribution, and the resolution values and improvements are reported in the legend.
The presence of neutrinos can be inferred by measuring the momentum imbalance in the event. This is measured by the missing transverse momentum EmissT , defined as the negative vector sum of the transverse
momenta of electrons, muons and jets3associated with the primary vertex. A soft term [92–94] is added
to include well-reconstructed tracks matched to the primary vertex that are not already matched to any of the physics objects.
The object reconstruction and identification algorithms do not always result in unambiguous identifica-tions. An overlap removal procedure is therefore applied, with the following actions taken in sequence. Any hadronically decaying τ-lepton reconstructed closer than ∆R = 0.2 to an electron or muon is re-moved, except in cases where the muon is deemed to be of low quality. If a reconstructed muon shares an electron’s ID track, the electron is removed. Jets within a cone of size∆R = 0.2 around an electron are removed, since a jet is always expected from clustering an electron’s energy deposits in the calorimeter. Any electrons reconstructed within∆R = min(0.4, 0.04 + 10 GeV/pelectronT ) of the axis of any surviving jet are removed. Such electrons are likely to originate from semileptonic b- or c-hadron decays. If a jet is reconstructed within∆R = 0.2 of a muon and the jet has fewer than three associated tracks or the muon energy constitutes most of the jet energy then the jet is removed. Muons reconstructed within a cone of size∆R = min(0.4, 0.04 + 10 GeV/pmuonT ) around the jet axis of any surviving jet are removed. Jets that are reconstructed within a cone of size∆R = 0.2 around the axis of a hadronically decaying τ-lepton are removed.
4.2 Event selection and categorisation
The online event selection relies on either the EmissT or the single-charged-lepton triggers. Events passing the trigger selection and satisfying basic quality requirements are then categorised according to the charged lepton multiplicity, the vector boson’s transverse momentum, and jet multiplicity. Events are assigned to the 0-, 1- and 2-lepton channels depending on the number of charged leptons `, targeting the ZH → vvb¯b, WH → `νb¯b and ZH → ``b¯b signatures, respectively. Although τ-leptons from vector-boson decays are not targeted explicitly, they pass the selection with reduced efficiency through leptonic decays of the τ-lepton into muons and electrons. All events are required to have at least two jets, and exactly two must pass the b-tagging requirement. The Higgs boson candidate is reconstructed from the two b-tagged jets and the highest-pT(leading) b-tagged jet is required to have pT> 45 GeV.
The analysis covers the phase space at large Higgs boson (and equivalently vector boson) transverse momentum, which has the highest signal-to-background ratio. For the same reason, events are categorised according to the reconstructed vector boson’s transverse momentum pVT. This observable corresponds to ETmissin the 0-lepton channel, to the size of the vectorial sum of EmissT and the charged lepton’s transverse momentum in the 1-lepton channel, and the transverse momentum of the 2-lepton system in the 2-lepton channel. In the 0- and 1-lepton channels a single region is defined, with pVT> 150 GeV. In the 2-lepton channel two regions are considered, 75 GeV < pVT < 150 GeV and pVT > 150 GeV.
Events are further split into two categories according to jet multiplicity. In the 0- and 1-lepton channels, events are considered with exactly two or exactly three jets. Events with four or more jets are rejected in these channels to reduce the large background arising from t¯t production. In the 2-lepton channel, extra sensitivity is gained by accepting events with higher jet multiplicity due to the lower level of the tt background, thus the categories become either exactly two jets or three or more jets. For simplicity, these two selection categories are referred to as the 2- and 3-jet categories for all three lepton channels.
3Hadronically decaying τ-leptons are treated as jets in the measurement of the Emiss
The event selection criteria for the three channels are detailed below and summarised in Table2. The 1-and 2-lepton selections are both divided into two sub-channels depending on the flavour of the leptons: either electron or muon. There are small differences between these two sub-channels and these are men-tioned when appropriate. The two sub-channels are merged to form the single 1- and 2-lepton channels used for the statistical analysis. The statistical analysis uses eight signal regions (SRs) and six control regions (CRs). Multivariate discriminants are used as the main observables to extract the signal, as de-scribed in Section5.
The predicted cross-sections times branching ratios for (W/Z)H with W → `ν, Z → ``, Z → νν, and H → bb, as well as the acceptances in the three channels after full selection are given in Table3. The non-negligible acceptance for the W H process in the 0-lepton channel is mostly due to events with hadronically decaying τ-leptons produced in the W decay, and the larger acceptance for the gg → ZH process with respect to qq → ZH is due to the harder pVT distribution from the gluon-induced process.
T able 2 : Summary of the ev ent selection in the 0-, 1-and 2-lepton channels. Selection 0-lepton 1-lepton 2-lepton e sub-channel µ sub-channel T rigger E miss T Single lepton E miss T Single lepton Leptons 0 loose leptons 1 tight electron 1 medium muon 2 loose leptons with pT > 7 Ge V with pT > 7 Ge V pT > 27 Ge V pT > 25 Ge V ≥ 1 lepton with pT > 27 Ge V E miss T > 150 Ge V > 30 Ge V – – m`` – – 81 Ge V < m`` < 101 Ge V Jets Exactly 2 or 3 jets Exactly 2 or ≥ 3 jets Jet pT > 20 Ge V b -jets Exactly 2 b -tagged jets Leading b -tagged jet pT > 45 Ge V HT > 120 (2 jets), > 150 Ge V (3 jets) – – min[ ∆ φ( E miss T ,jets )] > 20 ◦ (2 jets), > 30 ◦ (3 jets) – – ∆ φ( E miss T ,b b ) > 120 ◦ – – ∆ φ( b1 ,b2 ) < 140 ◦ – – ∆ φ( E miss T ,E miss T,trk ) < 90 ◦ – – p V T re gions > 150 Ge V (75, 150] Ge V, > 150 Ge V Signal re gions X mbb ≥ 75 Ge V or mtop ≤ 225 Ge V Same-fla v our leptons Opposite-sign char ge (µµ sub-channel) Control re gions – mbb < 75 Ge V and mtop > 225 Ge V Di ff erent-fla v our leptons
Table 3: The cross-section times branching ratio (B) and acceptance for the three channels at √s= 13 TeV. The qq-and gg-initiated ZH processes are shown separately. The branching ratios are calculated considering only decays to muons and electrons for Z → ``, decays to all three lepton flavours for W → `ν and decays to all neutrino flavours for Z → νν. The acceptance is calculated as the fraction of events remaining in the combined signal and control regions after the full event selection.
mH= 125 GeV at
√
s= 13 TeV
Process Cross-section × B [fb] Acceptance [%]
0-lepton 1-lepton 2-lepton
qq → ZH →``b¯b 29.9 < 0.1 < 0.1 7.0 gg → ZH → ``b¯b 4.8 < 0.1 < 0.1 15.7 qq → W H →`νb¯b 269.0 0.2 1.0 – qq → ZH →ννb¯b 89.1 1.9 – – gg → ZH → ννb¯b 14.3 3.5 – – 4.2.1 Zero-lepton selection
The online event selection relies on an EmissT trigger. The threshold for this trigger was 70 GeV for the 2015 data, and it was initially raised to 90 GeV and then to 110 GeV during 2016. In the offline analysis events are required to have no loose leptons and EmissT > 150 GeV. When compared to the offline selection, the EmissT trigger is fully efficient for EmissT > 180 GeV, and it is 85 − 90% efficient at ETmiss = 150 GeV, depending on the data taking period. The trigger efficiency is measured in W + jets and t¯t events in data using an orthogonal set of single-muon triggers; these measurements are utilised to determine data-over-simulation scaling factors, used to correct the data-over-simulation. The scaling factors are within 5% of unity and parameterised as a function of EmissT . A selection based on the scalar sum of the transverse momenta of the jets in the event, HT, is used to remove a marginal region of phase space in which the trigger efficiency
exhibits a small dependence on the jet multiplicity. For 2-jet events the requirement is HT > 120 GeV,
and HT> 150 GeV is required for 3-jet events.
In order to suppress the multi-jet background, which is mostly due to jets mismeasured in the calorimeters, four angular selection criteria are applied:
• ∆φ(EmissT , EmissT,trk) < 90◦, • ∆φ(b1, b2) < 140◦, • ∆φ(EmissT , bb) > 120◦,
• min[∆φ(EmissT , jets)] > 20◦for 2 jets, > 30◦for 3 jets.
Here∆φ(a, b) indicates the difference in azimuthal angle between objects a and b; b1 and b2 are the
two b-tagged jets forming the Higgs boson candidate’s dijet system bb; EmissT,trkis defined as the missing transverse momentum calculated from the negative vector sum of the transverse momenta of tracks re-constructed in the inner detector and identified as originating from the primary vertex. The final selection is a requirement on the azimuthal angle between the EmissT vector and the closest jet.
4.2.2 One-lepton selection
For the electron sub-channel, events are selected using a logical OR of single-electron triggers with pT
thresholds of 24 GeV, 60 GeV and 120 GeV for the 2015 data and with increased thresholds of 26 GeV, 60 GeV and 140 GeV in 2016. The lowest-threshold trigger in 2016 includes isolation and identification requirements that are looser than any of the isolation and identification requirements applied in the ana-lysis. These requirements are removed or relaxed for the higher-threshold triggers. The muon sub-channel uses the same EmissT triggers as the 0-lepton channel. Since muons are not included in the ETmisscalculation at trigger level, in events where a muon is present this trigger is in effect selecting events based on pV
T,
and is therefore fully efficient for values of pVT above 180 GeV. This trigger is preferred because it has an overall signal efficiency (with respect to the offline selection) of 98%, compared to ∼ 80% efficiency for the combination of single-muon triggers, which is due to the limited muon trigger chamber coverage in the central |η| region of the detector. Events are required to contain exactly one tight electron with pT
above 27 GeV (electron sub-channel) or one medium muon with pT above 25 GeV (muon sub-channel),
and no additional loose leptons. In the electron sub-channel, where multi-jet production is a significant background, an additional selection of EmissT > 30 GeV is applied.
Control regions enhanced in the W + HF background are defined for both the 2- and 3-jet categories. These are obtained by applying two additional selection requirements beyond the respective nominal selection criteria: mbb < 75 GeV and mtop > 225 GeV. To calculate the reconstructed top quark mass,
mtop, an estimate of the four-momentum of the neutrino from the W boson decay is required. The vector
EmissT is assumed to give an estimate of the neutrino’s transverse momentum components and then pνzcan
be determined up to a possible two-fold ambiguity by constraining the mass of the lepton-plus-neutrino system to be the W boson mass.4 The top quark is then reconstructed by considering the reconstructed W boson and one of the two b-tagged jets. The combination of b-tagged jet and pνz resulting in mtopclosest
to 172.5 GeV is selected. The requirement on the reconstructed top quark mass significantly reduces the contamination from t¯t and single-top-quark events in the W+ HF CRs. The events in the control regions are removed from the corresponding signal regions. In the W + HF CRs, between 75% and 78% of the events are expected to be from W+ HF production.
4.2.3 Two-lepton selection
Events are selected in the electron sub-channel using the same single-electron triggers as for the 1-lepton channel. For the muon sub-channel a logical OR of single-muon triggers with pT thresholds of 20 GeV
and 40 GeV is used for 2015 data, and 24–26 GeV and 40–50 GeV for 2016 data, with the increase of the thresholds applied to cope with the increasing instantaneous luminosity. The lowest-threshold triggers include an isolation requirement that is removed for the higher-threshold triggers. The trigger efficiency with respect to the offline selection ranges from 97% to 99.5% for the electron sub-channel and from 87% to 90% for the muon sub-channel, depending on the pVT region. To ensure that the trigger efficiency reached its plateau, the lepton that triggered the event is required to have pT > 27 GeV. Exactly two
loose leptons of the same flavour are required. In dimuon events, the two muons are required to have opposite-sign charge. This is not used in the electron sub-channel, where the charge misidentification rate is not negligible. The invariant mass of the dilepton system must be consistent with the Z boson mass:
4In the case of negative discriminant in the quadratic equation, the Emiss
T vector is shifted such that the discriminant becomes
81 GeV < m`` < 101 GeV. This requirement suppresses backgrounds with non-resonant lepton pairs,
such as t¯t and multi-jet production.
Control regions are defined to be very pure in t¯t and Wt background by applying the nominal selection but requiring an eµ lepton flavour combination instead of ee or µµ, and with no opposite-charge requirement. The t¯t and Wt events in these control regions are kinematically identical to those in the signal region, except for slight differences in acceptance between electrons and muons. These regions are called eµ CR in the following. In the eµ CRs, more than 99% of the events are expected to be from t¯t and single top quark production, and between 88% and 97% from t¯t production alone.
4.3 Selection for the dijet-mass analysis
To validate the result of the multivariate analysis, a second analysis is performed where the multivariate discriminants are replaced by the dijet invariant mass of the two b-tagged jets, mbb. This second analysis
adopts the same objects and event selection criteria as described in Table2, with the additional selection criteria shown in Table4. With respect to the pV
T regions described earlier, the events with p V
T > 150 GeV
are further split into two categories: 150 GeV < pVT ≤ 200 GeV and pVT > 200 GeV. Events with pVT ≤ 150 GeV are rejected if∆R(b1, b2) > 3.0, where∆R(b1, b2) is the separation of the two b-tagged
jets in the (η, φ) plane. For 150 GeV < pVT ≤ 200 GeV, the events are rejected if∆R(b1, b2) > 1.8. For
pVT> 200 GeV events are rejected if ∆R(b1, b2) > 1.2.
In the 1-lepton channel, since the low mbbrange in the dijet mass spectrum provides sufficient information
to constrain the W + HF background normalisation, no dedicated W + HF control region is defined. Also, a requirement on the W boson’s transverse mass mWT< 120 GeV is used to suppress events from t¯tbackground. The W boson’s transverse mass is defined as mWT =
q
2p`TEmissT (1 − cos(∆φ(`, EmissT ))), where p`Tis the lepton’s transverse momentum.
In the 2-lepton channel, the t¯tbackground is suppressed thanks to the additional requirement EmissT /√ST <
3.5√GeV, where ST is defined as the scalar sum of the transverse momenta of all jets and leptons in the
event. Events with pVT> 150 GeV in the eµ CR are used inclusively in pVT.
Table 4: Summary of the event selection criteria in the 0-, 1- and 2-lepton channels for the dijet-mass analysis,
applied in addition to those described in Table2for the multivariate analysis.
Channel
Selection 0-lepton 1-lepton 2-lepton
mWT - < 120 GeV
-EmissT /√ST - - < 3.5
√ GeV
pVT regions
pVT (75, 150] GeV (150, 200] GeV (200, ∞) GeV
(2-lepton only)
5 Multivariate analysis
Multivariate discriminants making use of boosted decision trees (BDTs) are constructed, trained and evaluated in each lepton channel and analysis region separately. Two versions of the BDTs, using the same input variables, are trained. The nominal version is designed to separate the V H, H → b¯b signal from the sum of the expected background processes, and is referred to as BDTV H. A second one, which
is used to validate the analysis, aims at separating the VZ, Z → b¯b diboson process from the sum of all other expected background processes (including V H), and is referred to as BDTVZ.
The input variables used for the BDTs are chosen in order to maximise the separation in the V H search. Starting from the dijet mass (mbb), additional variables describing the event kinematics and topology are
tried one at a time and the one yielding the best separation gain is added to the list. This procedure is repeated until adding more variables results in a negligible performance gain. The final selections of variables for the different channels are listed in Table5. The b-tagged jets are labelled in decreasing pT
as b1and b2, and |∆η(b1, b2)| is their separation in pseudorapidity. In 3-jet events, the third jet is labelled
as jet3 and the mass of the 3-jet system is denoted mbb j. The azimuthal angle between the vector boson
and the system of b-tagged jets is denoted ∆φ(V, bb), and their pseudorapidity separation is denoted |∆η(V, bb)|. In the 0-lepton channel, meff is defined as the scalar sum of the transverse momenta of all jets and EmissT (meff = HT+ ETmiss). In the 1-lepton channel, the angle between the lepton and the closest
b-tagged jet in the transverse plane is denoted min[∆φ(`, b)]. In the 1-lepton channel, two variables are used to improve the rejection of the t¯t background: the rapidity difference between the W and Higgs boson candidates, |∆Y(V, bb)| and, assuming that the event is t¯t, the reconstructed top quark mass, mtop.
To construct the |∆Y(V, bb)| variable, the four-vector of the neutrino in the W boson decay is estimated as explained in Section 4.2.2for mtop. The distributions of input variables of the BDTs are compared
between data and simulation, and good agreement is found within the uncertainties.
The Toolkit for Multivariate Data Analysis, TMVA [95], is used to train the BDTs, with values of the training parameters similar to those described in Ref. [18]. In order to make use of the complete set of simulated MC events for the BDT training and evaluation in an unbiased way, the MC events are split into two samples of equal size, A and B. The performance of the BDTs trained on sample A (B) is evaluated with sample B (A) in order to avoid using identical events for both training and evaluation of the same BDT. Half of the data are analysed with the BDTs trained on sample A, and the other half with the BDTs trained on sample B. At the end, the output distributions of the BDTs trained on samples A and Bare merged for both the simulated and data events. A dedicated procedure is applied to transform the BDT output distributions to obtain a smoother distribution for the background processes and finer binning in the regions with the largest signal contribution, whilst ensuring that the statistical uncertainty of the simulated background is less than 20% in each bin. The binning procedure is described in more detail in Ref. [18].
6 Estimation of the multi-jet background
The MC samples summarised in Section3are used to model background processes with W or Z boson decays into leptons; these are defined as electroweak (EW) backgrounds in the following. Multi-jet backgrounds are produced with large cross-sections and thus, despite not providing genuine leptonic signatures, have the potential to contribute a non-negligible background component. In the following this background contribution is discussed channel by channel.
Table 5: Variables used for the multivariate discriminant in each of the categories.
Variable 0-lepton 1-lepton 2-lepton
pVT ≡ ETmiss × × EmissT × × × pb1 T × × × pb2 T × × × mbb × × × ∆R(b1, b2) × × × |∆η(b1, b2)| × ∆φ(V, bb) × × × |∆η(V, bb)| × meff × min[∆φ(`, b)] × mWT × m`` × mtop × |∆Y(V, bb)| ×
Only in 3-jet events pjet3
T × × ×
mbb j × × ×
6.1 0-lepton channel
As described in Section4, specific criteria are applied in the event selection to suppress the multi-jet back-grounds. A data-driven method is used to estimate the residual contribution. After removing the selection applied to the min[∆φ(Emiss
T , jets)] variable, a fit to this distribution in the 3-jet category is performed to
extract the multi-jet contribution while allowing the t¯t and Z + jets background normalisations to float. In multi-jet background events, a fake EmissT can arise from a jet energy fluctuation, and it is expected that its direction is close to the direction of the poorly measured jet. Therefore, the min[∆φ(EmissT , jets)] variable is very effective in suppressing the multi-jet contribution, which is confined to low values of x = min[∆φ(EmissT , jets)] and is parameterised with a falling exponential (exp (−x/c)). The parameter c is determined in the fit itself, while the templates for the other backgrounds are taken directly from sim-ulation. After the nominal selection criteria are applied, the residual multi-jet contamination within an 80 GeV < mbb < 160 GeV mass window is found to be ∼ 10% of the signal contribution and negligible
(< 0.1%) with respect to the total background. The BDT distribution for the multi-jet background is estimated from the data at low min[∆φ(Emiss
T , jets)], and found to have a shape similar to the one expected
for the sum of the remaining backgrounds. The small multi-jet contribution is therefore absorbed in the floating normalisation factors of the EW backgrounds in the global likelihood fit. The same data-driven estimation technique cannot be used in the 2-jet region, where events at low values of min[∆φ(Emiss
T , jets)]
are removed by the other selection requirements. A multi-jet Pythia8 MC sample generated with the A14 tune and NNPDF2.3LO PDFs is used to extrapolate the data-driven estimate from the 3- to the 2-jet re-gion, with the extrapolation factor derived after removing any b-tagging requirement. The contribution in the 2-jet region is found to be negligible. Multi-jet production in the 0-lepton channel is therefore found to be a small enough background that it can be neglected in the global likelihood fit.
6.2 1-lepton channel
Both the electron and muon sub-channels have contributions from multi-jet events. The dominant contri-bution to this background stems from real muons or electrons from heavy-flavour hadrons that undergo semileptonic decays. In the electron sub-channel a second contribution arises from γ → e+e−conversions of photons produced in the decay of neutral pions in jets, or directly from π0 Dalitz decays. Although those leptons are not expected to be isolated, a small but non-negligible fraction passes the lepton isola-tion requirements. This background is estimated separately in the electron and muon sub-channels, and in the 2- and 3-jet categories, using similar procedures.
In each signal region, a template fit to the W boson candidate’s transverse mass (mW
T) distribution is
performed in order to extract the multi-jet yield. The variable mWT is chosen as it offers the clearest discrimination between the multi-jet and EW processes. The template used for the multi-jet contribution is obtained from data in a control region after subtraction of the residual EW contribution, based on MC predictions, while the template for the EW contribution in the signal region is obtained directly from MC predictions. The control region is enriched in multi-jet events that are kinematically close to the corresponding signal region but not overlapping with it, and is defined by applying the nominal selection but inverting the tight isolation requirement. To increase the statistical precision of the data-driven estimate, the number of required b-tags is reduced from two to one. The template fit determines the normalisation of the multi-jet contribution in the signal region, while the shape of the BDT discriminant (or of other relevant observables) is obtained analogously to the mWT template. Both the normalisation and shape derived for the BDT discriminant are then used in the global likelihood fit.
Since the efficiency of the tight isolation requirement on multi-jet events depends in general on lepton kinematics, and on the composition of the multi-jet background, the control regions that are based on inverting such a requirement provide biased estimators for the multi-jet templates in the corresponding signal regions. The templates are therefore corrected for such a bias, by applying event-by-event extrapol-ation factors that depend on lepton pT and η, and, in the electron sub-channel, also on the value of ETmiss.
These extrapolation factors are derived in additional control regions where the 2- and 3-jet requirements of the nominal selection are replaced by a 1-jet requirement, and the b-tagging requirement is removed. The extrapolation factors are computed as the ratio of the number of events with an isolated lepton to the number of events with a non-isolated lepton, after removing the MC-predicted EW background contribu-tion.
The estimate of the normalisations of the W + jet and top quark (t¯t and single top quark) background contributions in the signal region provided by Monte Carlo simulations is subject to significant uncertain-ties. In addition, the mWT distributions of the W + jet and top quark backgrounds are sufficiently different that a common normalisation factor induces a bias in the multi-jet estimate. The normalisation of these two backgrounds is therefore left free to be determined in the template fit used to extract the multi-jet contribution. In order to improve their relative separation, the fit to the mWT distribution in the signal region is performed together with a fit to the overall yield in the corresponding W + HF control region. Furthermore, in order to improve the statistical precision in the determination of the W+ jet and top quark background normalisation factors, the multi-jet template fit is performed simultaneously in the electron and muon sub-channels. This corresponds to performing separate fits for the two sub-channels, but with common W+ jet and top quark background normalisation factors.
The multi-jet contribution in the 2-jet region is found to be 4.8% (4.6%) of the total background contri-bution in the electron (muon) sub-channel, while in the 3-jet region it is found to be 0.3% (0.5%). These
estimates are subject to sizeable systematic uncertainties, which are described in Section7.
6.3 2-lepton channel
Requiring two isolated leptons with a dilepton invariant mass compatible with that of the Z boson strongly suppresses the contributions from multi-jet events. The residual contribution is estimated using a fit to the dilepton mass distribution in a sample of events where the two lepton candidates have the same charge. The fit model includes expected contributions from EW backgrounds from simulation and an exponential model for the multi-jet background. An estimate is then made of the fraction of the background in a mass window around the Z boson peak in the signal region that could be attributed to multi-jet events based on the assumption that the numbers of opposite-charge and same-charge events are equal for the multi-jet background. Inside a mass window 81 GeV < m`` < 101 GeV the fraction of the background in the
signal region coming from multi-jet events is estimated to be 0.03% and 0.2% for the muon and electron sub-channels, respectively. The residual multi-jet contamination within a 100 GeV < mbb < 140 GeV
mass window is found to be ∼ 8% of the signal contribution, without an mbbresonant shape, and found to
have a BDT shape similar to the one expected for the sum of the remaining backgrounds. The multi-jet contamination is also extracted in the eµ control region and found to be 0.3% of the total background. The multi-jet contribution in the 2-lepton channel is thus small enough to have a negligible impact on the signal extraction and is therefore not included in the global likelihood fit.
7 Systematic uncertainties
The sources of systematic uncertainty can be broadly divided into four groups: those of experimental nature, those related to the modelling of the simulated backgrounds, those related to the multi-jet back-ground estimation, and those associated with the Higgs boson signal simulation. The finite size of the simulated background samples is also an important source of systematic uncertainty, and, whenever pos-sible, generator-level filters are employed to enhance the amount of simulated events in the phase-space region that is most relevant for the analysis.
7.1 Experimental uncertainties
The dominant experimental uncertainties originate from the flavour-tagging simulation-to-data efficiency correction factors, from the jet energy scale corrections and the modelling of the jet energy resolution. Flavour-tagging simulation-to-data efficiency correction factors are derived [87] separately for b-jets, c-jets and light-flavour jets. All three correction factors depend on jet pT (or pT and |η|) and have
un-certainties estimated from multiple sources. These are decomposed into uncorrelated components which are then treated independently, resulting in three uncertainties for b-jets and for c-jets, and five for light-flavour jets. The approximate size of the uncertainty in the tagging efficiency is 2% for b-jets, 10% for c-jets and 30% for light jets. Additional uncertainties are considered in the extrapolation of the b-jet ef-ficiency calibration above pT = 300 GeV and in the misidentification of hadronically decaying τ-leptons
as b-jets. The uncertainties in the jet energy scale and resolution are based on their respective measure-ments in data [83,96]. The many sources of uncertainty in the jet energy scale correction are decomposed into 21 uncorrelated components which are treated as independent. An additional specific uncertainty is considered that affects the energy calibration of b- and c-jets.
Uncertainties in the reconstruction, identification, isolation and trigger efficiencies of muons [78] and electrons [75], along with the uncertainty in their energy scale and resolution, are estimated based upon 13 TeV data. These are found to have only a small impact on the result. The uncertainties in the energy scale and resolution of the jets and leptons are propagated to the calculation of ETmiss, which also has additional uncertainties from the scale, resolution and efficiency of the tracks used to define the soft term [93], along with the modelling of the underlying event. An uncertainty is assigned to the simulation-to-data EmissT trigger scale factors to account for the statistical uncertainty in the measured scale factors and differences between the scale factors determined from W + jets and t¯t events. The uncertainty in the luminosity is 2.1% for the 2015 data and 3.4% for the 2016 data, resulting in an uncertainty of 3.2% for the combined dataset. It is derived, following a methodology similar to that detailed in Ref. [28], from a preliminary calibration of the luminosity scale using x–y beam-separation scans performed in 2015 and 2016. The average number of interactions per bunch crossing is rescaled by 9% to improve the agreement between simulation with data, and an uncertainty, as large as the correction, is included.
7.2 Simulated background uncertainties
Modelling uncertainties are derived for the simulated backgrounds and broadly cover three areas: nor-malisation, acceptance differences that affect the relative normalisation between analysis regions with a common background normalisation, and the differential distributions of the most important kinematic variables. These uncertainties are derived either from particle-level comparisons between nominal and al-ternative samples using the RIVET [97] framework, or from comparisons to data in control regions. The particle-level comparisons are cross-checked with detector-level simulations whenever these are avail-able, and good agreement is found. When acceptance uncertainties are estimated all the nominal and alternative samples are normalised using the same production cross-section. Such uncertainties are es-timated by adding the differences between the nominal and alternative samples in quadrature. Shape uncertainties are considered in each of the analysis regions separately, with the samples scaled to have the same normalisation in each region. In this case, the uncertainty is taken from the alternative generator which has the largest shape difference compared to the nominal sample. Shape uncertainties are only derived for the mbb and pVT variables, as it was found that it is sufficient to only consider the changes
induced in these variables by an alternative generator to cover the overall shape variation of the BDTV H
discriminant. The systematic uncertainties affecting the modelling of the background samples are repor-ted in Tables6and7, and the specific details of how the uncertainties are estimated are provided below for each simulated background sample.
V+ jets production The V +jets backgrounds are subdivided into three different components based upon the jet flavour labels of the two b-tagged jets in the event. The main background contributions (V+ bb, V+ bc, V + bl and V + cc) are jointly considered as the V + HF background. Their overall normalisation, separately in the 2- and 3-jet categories, is free to float in the global likelihood fit, as detailed in Section8. The remaining flavour components, V+ cl and V + ll, make up less than ∼ 1% of the background in each analysis region, so only uncertainties in the normalisation of these backgrounds are included.
Acceptance uncertainties are estimated for the relative normalisations of the different regions that share a common floating normalisation parameter. In the case of the W + HF background, this includes the uncertainties in the ratio of the event yield in the 0-lepton channel to that in the 1-lepton channel and, in the 1-lepton channel, in the ratio of the event yield in the W+HF control region to that in the signal region. For the Z+ HF background, there is an uncertainty in the ratio of the event yield in the 0-lepton channel
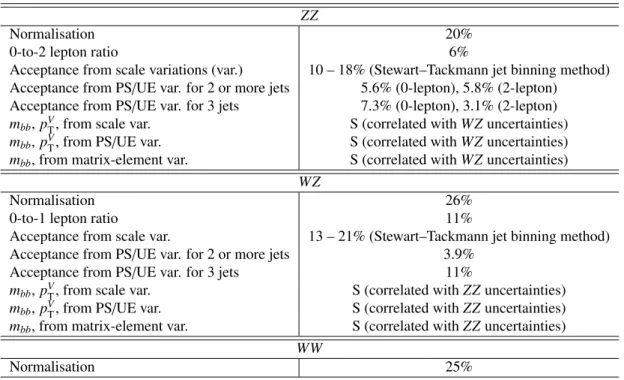
Table 6: Summary of the systematic uncertainties in the background modelling for Z+ jets, W + jets, tt, single top quark and multi-jet production. An “S” symbol is used when only a shape uncertainty is assessed. The regions for which the normalisations float independently are listed in brackets.
Z+ jets
Z+ ll normalisation 18%
Z+ cl normalisation 23%
Z+ bb normalisation Floating (2-jet, 3-jet)
Z+ bc-to-Z + bb ratio 30 – 40%
Z+ cc-to-Z + bb ratio 13 – 15%
Z+ bl-to-Z + bb ratio 20 – 25%
0-to-2 lepton ratio 7%
mbb, pVT S
W + jets
W+ ll normalisation 32%
W+ cl normalisation 37%
W+ bb normalisation Floating (2-jet, 3-jet)
W+ bl-to-W + bb ratio 26% (0-lepton) and 23% (1-lepton)
W+ bc-to-W + bb ratio 15% (0-lepton) and 30% (1-lepton)
W+ cc-to-W + bb ratio 10% (0-lepton) and 30% (1-lepton)
0-to-1 lepton ratio 5%
W+ HF CR to SR ratio 10% (1-lepton)
mbb, pVT S
tt(all are uncorrelated between the 0+1 and 2-lepton channels)
ttnormalisation Floating (0+1 lepton, 2-lepton 2-jet, 2-lepton 3-jet)
0-to-1 lepton ratio 8%
2-to-3-jet ratio 9% (0+1 lepton only)
W+ HF CR to SR ratio 25%
mbb, pVT S
Single top quark
Cross-section 4.6% (s-channel), 4.4% (t-channel), 6.2% (Wt)
Acceptance 2-jet 17% (t-channel), 35% (Wt)
Acceptance 3-jet 20% (t-channel), 41% (Wt)
mbb, pVT S (t-channel, Wt)
Multi-jet (1-lepton)
Normalisation 60 – 100% (2-jet), 100 – 400% (3-jet)
Table 7: Summary of the systematic uncertainties in the background modelling for diboson production. “PS/UE”
indicates parton shower/ underlying event. An “S” symbol is used when only a shape uncertainty is assessed.
When determining the (W/Z)Z diboson production signal strength, the normalisation uncertainties in ZZ and WZ production are removed.
ZZ
Normalisation 20%
0-to-2 lepton ratio 6%
Acceptance from scale variations (var.) 10 – 18% (Stewart–Tackmann jet binning method)
Acceptance from PS/UE var. for 2 or more jets 5.6% (0-lepton), 5.8% (2-lepton)
Acceptance from PS/UE var. for 3 jets 7.3% (0-lepton), 3.1% (2-lepton)
mbb, pVT, from scale var. S (correlated with WZ uncertainties)
mbb, pVT, from PS/UE var. S (correlated with WZ uncertainties)
mbb, from matrix-element var. S (correlated with WZ uncertainties)
WZ
Normalisation 26%
0-to-1 lepton ratio 11%
Acceptance from scale var. 13 – 21% (Stewart–Tackmann jet binning method)
Acceptance from PS/UE var. for 2 or more jets 3.9%
Acceptance from PS/UE var. for 3 jets 11%
mbb, pVT, from scale var. S (correlated with ZZ uncertainties)
mbb, pVT, from PS/UE var. S (correlated with ZZ uncertainties)
mbb, from matrix-element var. S (correlated with ZZ uncertainties)
WW
Normalisation 25%
to that in the 2-lepton channel. These ratio uncertainties act as effective extrapolation uncertainties from one region to another.
Uncertainties are also estimated in the relative normalisation of the four heavy-flavour components that make up the V+ HF background. These are taken as uncertainties in the bc, cc and bl yields compared to the dominant bb yield and are estimated separately for the 0- and 1-lepton channels in the case of W+ HF and separately for the 0-lepton, 2-lepton 2-jet and 2-lepton 3-jet regions in the case of Z+ HF.
The normalisation and acceptance uncertainties are all calculated by adding the differences between the nominal Sherpa 2.2.1 sample and its associated systematic variations in quadrature, including a variation of (i) the renormalisation scale by factors of 0.5 and 2; (ii) the factorisation scale by factors of 0.5 and 2; (iii) the CKKW merging scale from 30 GeV to 15 GeV; (iv) the parton-shower/resummation scale by factors of 0.5 and 2. In addition, the difference between the Sherpa 2.2.1 nominal sample and an alternative sample produced with a different matrix-element generator is added in quadrature to the rest to yield the total uncertainty. The alternative sample is produced with Madgraph5_aMC@NLO v2.2.2 [98], with up to four extra partons at LO, and interfaced to Pythia 8.212; the A14 tune is used together with the NNPDF2.3LO PDF set.
Uncertainties in the shapes of the mbb and pVT distributions are estimated for Z+ HF by comparing the
Z+ jets background to data in signal-depleted regions with a very high Z + jets purity, specifically the 1-and 2-tag regions of the 2-lepton channel, with the mbbregion around the Higgs boson mass excluded in
the 2-tag case. In order to remove most of the residual t¯t contamination, a selection requirement is made on EmissT /√ST < 3.5 √GeV as done for the dijet-mass analysis.
For the W+ HF background, due to the limited number of events in the dedicated control region, shape uncertainties are based on the same systematic uncertainty sources as for the normalisation and acceptance uncertainties; in all event categories, since scale variations are found to have a minor effect on the shapes of the distributions, the systematic uncertainties are dominated by the comparison of the nominal Sherpa 2.2.1 sample with Madgraph5_aMC@NLO v2.2.2.
t t production Uncertainties are derived from comparing the nominal sample (Powheg+Pythia8) to al-ternative samples with different parton-shower generation (Powheg+Herwig7 [99,100]), matrix-element generation (Madgraph5_aMC@NLO+Pythia8) and settings of the nominal generator designed to in-crease or dein-crease the amount of radiation. Due to the significantly different regions of phase space probed, the tt background in the 0- and 1-lepton channels (jointly referred to as 0+1 lepton in the fol-lowing) is considered independently from the tt background in the 2-lepton channel; different overall floating normalisation factors are considered, and acceptance uncertainties are derived separately and taken as uncorrelated between the 0+1 and 2-lepton channels. For the 0+1 lepton channels, uncertainties are considered in the normalisation ratios of the 3-jet and 2-jet regions, the W + HF control region and signal region, and the 1-lepton and 0-lepton channels. These uncertainties are estimated by comparing the difference between the ratios of the yields in the two regions under consideration in the alternative tt samples and those measured in the nominal sample. The differences between the nominal and each of the alternative samples are summed in quadrature to provide an overall uncertainty. For the 2-lepton channel, the normalisations in the 2- and 3-jet regions are both left floating, and are effectively determ-ined in their respective eµ control regions. Uncertainties in the shapes of the pVT and mbbdistributions are
estimated in the 0+1 and 2-lepton channels separately. The difference between the nominal sample and Madgraph5_aMC@NLO provides by far the largest variation, and is therefore considered as a systematic uncertainty in the shapes of these distributions.
Single top quark production In the Wt and t-channels, uncertainties are derived in the normalisation, acceptance and shapes of the mbb and pVT distributions. The s-channel only has a normalisation
uncer-tainty derived as its contribution is negligible overall.
For the t-channel, the nominal samples (Powheg+Pythia6) are compared to alternative samples, which are similar to those used in the tt case using different parton-shower generation (Powheg+Herwig++), and matrix-element generation (Madgraph5_aMC@NLO+Herwig++). For the Wt channel, uncertain-ties related to the interference between the Wt and t¯t production processes are assessed by using a diagram subtraction scheme instead of the nominal diagram removal scheme [64,101]. For both the t- and Wt-channels, the settings of the nominal generator are varied so as to maximise or minimise the amount of radiation. The normalisation uncertainties take into account variations of the renormalisation and factor-isation scales, αSand PDFs. Uncertainties in the acceptance in both the 2- and 3-jet regions are derived
by comparing the alternative generators and summing the differences with respect to the nominal sample in quadrature. Shape uncertainties are derived for the mbband pVT distributions. These uncertainties cover
all the differences in the shapes of the kinematic distributions investigated by comparing nominal and alternative samples.
Diboson production The diboson backgrounds are composed of three distinct processes, WZ, WW and ZZproduction. Given the small contribution from WW production (< 0.1% of the total background) only a normalisation uncertainty is assigned. The more important contributions from the WZ and ZZ back-grounds have uncertainties derived for the overall normalisation, the relative acceptance between regions and for the mbb and pVT shapes. Uncertainties are derived by comparing the nominal sample (Sherpa
2.2.1) to the alternative samples with varied factorisation, renormalisation and resummation scales, and using the Stewart–Tackmann method [102] to estimate scale variation uncertainties for the acceptance