Fading temperature sensitivity of Alpine tree growth
at its Mediterranean margin and associated effects
on large-scale climate reconstructions
Ulf Büntgen&David Frank&Thomas Neuenschwander&Jan Esper
Received: 20 October 2009 / Accepted: 23 January 2012 / Published online: 24 March 2012 # Springer Science+Business Media B.V. 2012
Abstract A millennium-long tree-ring width chronology of living and dead larch (Larix decidua Mill.) specimens from the Maritime French Alps was introduced 35 years ago. This record has been included in various large-scale temperature reconstructions, though recent analyses revealed only weak associations with regional summer temperatures. Calibration and verification trials against instrumental measurements were, however, limited by the original record’s early ending in 1974. Here we introduce an update of this widely consid-ered chronology until 2007 and back into medieval times. A total of 297 new larch samples from high-elevation settings in the southern French Alps were included, and the combined 398 measurement series allowed effects of tree-ring detrending and chronology development to be explored. Comparisons with meteorological temperature, precipitation and drought indices revealed weak and temporally inconsistent climate sensitivity. To further place these local findings in a biogeographic context, we used >3,000 larch trees from 61 locations across the Alpine arc. This unique network approach confirmed fading temperature sensi-tivity with decreasing latitude, and thus questioned the overall reliability of ring width-based temperature reconstructions in the Mediterranean region. Our results further emphasize the pending need to develop chronologies from maximum latewood densities and stable isotope ratios across the lower latitudes, and to carefully evaluate ecological site conditions and methodological data restrictions prior to compiling local data into global networks.
U. Büntgen (*)
:
D. FrankSwiss Federal Research Institute WSL, Zuercherstrasse 111, 8903 Birmensdorf, Switzerland e-mail: [email protected]
U. Büntgen
:
D. FrankOeschger Centre for Climate Change Research, Erlachstrasse 9a, 3012 Bern, Switzerland T. Neuenschwander
University of Bern, Hallerstrasse 12, 3012 Bern, Switzerland J. Esper
1 Introduction
Annually-resolved and millennium-long temperature reconstructions that cover larger parts of the Northern Hemisphere are primarily derived from a limited set of tree-ring width (TRW) chronologies (e.g., Esper et al.2002). The relative importance of individual local records integrated in these compilations significantly increases back in time, as only a few of them extend prior to the Little Ice Age (LIA; ~1300–1850 AD). Due to the limited number of such site chronologies, reconstructions capable of estimating conditions during the putative Medieval Climate Anomaly (MCA; ~900–1300 AD), thus have substantial overlap in predictors (Fig. 1)— ‘we currently do not have sufficient widespread, high-resolution proxy data to soundly conclude on the spatial extent of the warmth during medieval times’ (Esper and Frank2009a).
From this perspective, the Torneträsk record, which was originally introduced by Schweingruber et al. (1988), reused by Briffa et al. (1992), updated by Grudd (2008), and discussed by Büntgen et al. (2008a), considerably impacts our understanding of the MCA, as it has been included in almost every palaeoclimatic large-scale collection (Büntgen et al.
2011a) (Fig. 1). These reconstruction approaches are also spatially weighted towards the
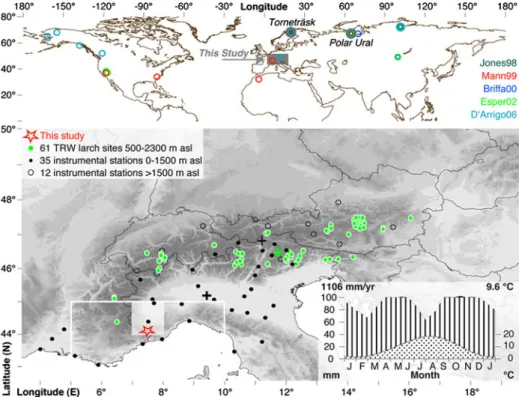
Fig. 1 Location of millennium-long TRW site chronologies that were included in Northern Hemisphere temperature reconstructions (i.e., Jones et al.1998; Mann et al.1999; Briffa2000; Esper et al.2002; D’Arrigo et al.2006). Lower panel shows the location of this study together with a network of 61 larch sites (green circles), and the 35 lower elevation southwestern Alpine stations and the 12 high-elevation stations (black dots and circles) in the European Alps. White square and frame denote the area covered by the 0.5° and 5°CRU grid-boxes. Black crosses highlight the geographic centers of the southwestern and high-elevation stations (bold and thin), whereas the green cross indicates the geographic center of the 61 larch sites. Inset graph shows the seasonal course of 20th century temperature and precipitation data (CRUTS2.1)
higher northern latitudes (D’Arrigo et al.2009), from where most of the proxies originate. This geographic constraint further amplifies the relative role of millennium-long proxy records from the expanded lower latitudes in network attempts to capture hemispheric to global climate change. Assessment of the spatial and perhaps temporal signature of the MCA relative to the LIA (Esper and Frank 2009a), as well as the long-term amplitude of pre-industrial to pre-industrial climate variability, therefore continues to be challenging (Esper et al.
2005). This is particularly critical, since the number of independent proxy archives and associated methodological exercises remains insufficient, especially prior to ~1400 AD and in the light of low-frequency preservation, respectively (D’Arrigo et al.2006).
On the European-scale, only a handful of temperature sensitive TRW chronologies from northern Scandinavia (see Linderholm et al.2009for a review), and the Central Alpine arc (Büntgen et al.2005,2009a) extend back to 1000 AD, and at the same time, reach into the 21st century (Tegel et al. 2010; Büntgen et al. 2011b; Büntgen and Tegel 2011). The existence of such records ultimately ceases towards the Mediterranean region (Büntgen et al. 2010a), which ironically has been identified as a key region of past, present, and projected climate change (Giorgi2006; Gao and Giorgi2008; Büntgen et al.2010b).
In this regard, a millennium-long TRW chronology that was initially introduced 35 years ago by Serre (1978) became an important estimator for past environmental changes. This unique record covers the 933–1974 AD period on the basis of living and dead larch trees, and has been included in regional (Serre-Bachet 1994), continental (Guiot et al.2005), and even hemispheric-scale (Mann et al.1999) temperature reconstructions. The original data, however, have been suggested to be precipitation sensitive, and the final record appeared not skillful in reconstructing lower frequency climate information due to the detrending applied (Esper et al. 2004). More recent network analyses that integrated the Serre (1978) chronology confirmed weak relationships with summer temperature (Frank and Esper2005a; Büntgen et al.2008b). However, further calibration tests beyond the record’s
early ending in 1974 are still required to ultimately define the palaeoclimatic value of this and other TRW proxies from the southern Alpine arc, and to further assess their performance under the most recent temperature increase (Büntgen et al.2006a,b; Büntgen and Tegel2011).
Here we address this issue by introducing a substantial update of the original Serre (1978) record. Newly collected TRW samples from living and dead larch trees from the same area in the Maritime French Alps significantly increased replication prior to 1500 AD, and also considerably extended the chronology until 2007. We apply a number of tree-ring detrend-ing, chronology development and data splitting techniques, and systematically explore the temperature, precipitation and drought sensitivity of the resulting TRW chronologies. We also compare the growth trends and climate responses from this setting in the southern French Alps with Alpine-wide evidence from 61 larch site chronologies. Uncertainties are discussed in light of the sampling design, tree-ring standardization and chronology devel-opment used, as well as the target data employed. Local- to regional-scale effects of insect defoliation, plant physiology and climate variability itself are further pondered, and their combined consequences for large-scale climate reconstructions are stressed.
2 Material and methods
2.1 Tree-ring data, detrending, and chronology development
Increment cores from a total of 297 living and dead European larch (Larix decidua Mill.) trees were newly collected at three sites (1, 2, 3) within the same ecological context as the
original site 4 (Serre 1978). All data derive from the upper treeline ecotone in the ‘Mercantour Massif’ that is ~50 km north of Nice (Fig.1). Sites are characterized by generally thin soil layers on top of the granite/gneiss bedrock (Table1), and surrounded by mountain peaks ranging from 2,500 to 3,000 masl. All four sampling sites represent the species’ southern distribution limit in the Maritime French Alps (~44.05 °N and ~07.28 °E, >2,100 masl) (Fig.1). The combined dataset (hereinafter ALL) covers the 946–2007 AD period (Fig. 2), and represents the so far best replicated and longest collection of living and dead high-elevation larch trees that have been sampled in situ at their Mediterranean margin.
The number of samples ranges from 32 to 141 series among the four sites (Table2). Mean segment length of the combined dataset is 264 years, and varies from 186 to 422 years among the individual sites. Tree age differs from 23 to 995 years, indicating that this is one of the oldest European conifer forests so far considered for dendroclimatological analyses. Average growth rate of all trees is 0.66 mm/year, and varies from 0.35 at site 4 to 0.83 at site 3. Pith-offset estimates, i.e., the number of rings missing between the theoretical pith and the innermost part of a core/disc sample, were recorded for a subset of 196 trees out of the updated sites 1, 2, and 3. Theoretical curvatures of a transparent screen, i.e., concentric circles, were visually compared with curvatures of the innermost rings of a sample, and thus used to estimate the pith-offset. This procedure, even though not free of uncertainty, appears to be simple and straightforward, and was supplemented by comparing different cores from one tree. No pith-offset information is available for the original data from site 4, making our update even more important. The existing pith-offset estimates, however, indicate no association with tree age (R200.0), which could otherwise affect the detrending process (Esper et al.2003).
A unique network >3000 TRW series from 61 locations distributed over the Austrian, Swiss, Slovenian, Italian, and French Alps (see Büntgen et al.2008afor details) was utilized for an Alpine-wide comparison of larch growth responses to variations in summer temper-ature (Fig.1). The geographical mean of this exceptional Alpine-wide collection is centered over the Italian Dolomites (46.63 °N, 11.86 °E and 1,667 m asl).
The combined ALL dataset, as well as the various subsets created from this compilation, including site splitting (1–4), splitting according to tree ages (<200 years, 200– 299 years, >300 years), and subsets of living and dead material (see Table 2 for details), were detrended using (i) individual cubic smoothing splines with 50% frequency-response cutoff equal 150 years and 300 years (Cook and Peters 1981), (ii) negative exponential functions, and (iii) regional curve standardization (RCS; Esper et al. 2003), with and without consideration of pith-offset estimates. The different detrending techniques were further applied to both raw and power-transformed measurements (Cook and Peters 1997). The resulting TRW chronologies that contain variability on inter-annual to multi-centennial time-scales were created using a bi-weight robust mean and their variance was stabilized by the MEANr
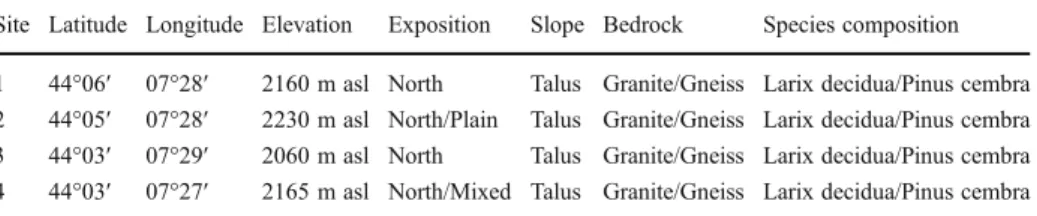
Table 1 Characteristics of the three new larch (Larix decidua Mill.) sites (1–3) in comparison to the initial Serre (1978) site (4)
Site Latitude Longitude Elevation Exposition Slope Bedrock Species composition 1 44°06′ 07°28′ 2160 m asl North Talus Granite/Gneiss Larix decidua/Pinus cembra 2 44°05′ 07°28′ 2230 m asl North/Plain Talus Granite/Gneiss Larix decidua/Pinus cembra 3 44°03′ 07°29′ 2060 m asl North Talus Granite/Gneiss Larix decidua/Pinus cembra 4 44°03′ 07°27′ 2165 m asl North/Mixed Talus Granite/Gneiss Larix decidua/Pinus cembra
correction (Frank et al. 2007b). This technique adjusts changes in variance of the mean chronology based on a time dependent ‘100-year moving window’ approach, which considers temporal changes in both, sample replication and inter-series corre-lation. All chronologies were truncated at a minimum sample replication of five series as a compromise between allowing maximum time span and ensuring sufficient signal strength. The inter-series correlation (Rbar) and the Expressed Population Signal
Fig. 2 Replication bar plots of the four site chronologies that separate between series from living and dead trees (grey and black), and emphasize their corresponding pith-offset estimates (red). The updated sites (1, 2, 3) extend until 2007, whereas the original site (4) ends in 1974
Table 2 Chronology characteristics of ALL data and various subsets (after power-transformation and 300-year spline detrending)
Code Series Trees Start End Start End >5 MSL AGR Rbar EPS Lag-1 T-corr 1 124 53 1356 2007 1386 2007 186 0.684 0.51 0.98 0.33 0.37 2 32 17 1446 2007 1700 2007 257 0.721 0.50 0.96 0.43 0.35 3 141 70 946 2007 1060 2007 220 0.831 0.48 0.98 0.43 0.32 4 101 38 933 1974 969 1974 422 0.354 0.49 0.99 0.26 0.32 Living 330 155 988 2007 1186 2007 250 0.686 0.42 0.99 0.31 0.35 Dead 68 23 933 1963 969 1939 331 0.505 0.50 0.93 0.16 0.32 <200 yr 158 90 1009 2007 1733 2007 109 0.881 0.45 0.94 0.42 0.32 200-299 yr 133 82 1031 2007 1680 2007 253 0.606 0.38 0.98 0.38 0.31 >300 yr 107 59 933 2007 969 2007 505 0.384 0.46 0.99 0.20 0.37 ALL 398 178 933 2007 969 2007 264 0.655 0.41 0.99 0.29 0.35 VM>200 yr 240 121 933 2007 969 2007 365 0.507 0.41 0.99 0.29 0.35 Rbar, EPS (averaged from 13 values of 30 years lagged by 15 years), and first year autocorrelation (Lag-1) were computed over the 1733–1939 period. Correlations (T-corr) were computed against June–July mean temperatures of the 35 southwestern Alpine stations and over the 1760–1939 common period
(EPS) calculated over 30-year windows lagged by 15 years, were used to estimate common variance and signal strength of the final timeseries (Wigley et al. 1984).
2.2 Instrumental grid-box and station data
Monthly temperature, precipitation and drought data were used for growth-climate response analysis (CRUTS2.1; Mitchell and Jones2005). We considered 0.5° resolution grid-box data that cover the 44–45 °N and 7–8 °E region and span the 1901–2002 period (Fig.1). Lower resolution temperature data (1850–2007) from one 5.0° grid-box centered over 42.5 °N and 7.5 °E (HadCRUT3v; Brohan et al.2006), as well as temperature measurements from two subsets of Alpine high-elevation and lower elevation southwestern instrumental stations (HISTALP LSS Tm-08; Auer et al. 2007) were additionally used to assess Alpine temperature variability back to 1760 AD (Fig. 1). The twelve high-elevation stations are located >1,500 m asl with their mean at 2,366 m asl over the Central Alps (46.87 ° N, 11.26 °E), and covering the 1818–2007 period. In contrast, 35 southwestern stations are located at elevations <1,500 m asl with their mean at 301 m asl centered over northern Italy (45.10 °N, 9.36 °E), and reaching back to 1760 AD. See Fig. 3
for a visual comparison of the instrumental temperature readings.
3 Results
3.1 Growth trends
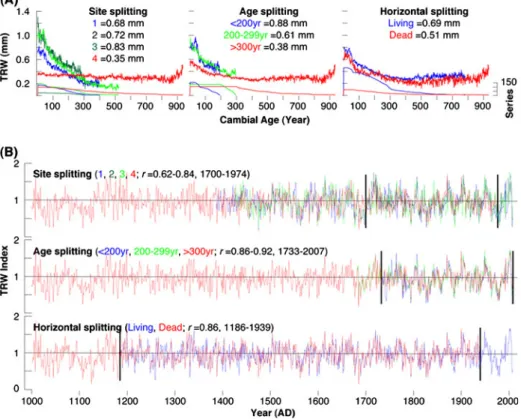
The mean of the age-aligned series, the so-called Regional Curve (RC; Esper et al.2003) reveals varying growth trends when splitting the data according to site location, tree age, and living/dead material (Fig.4a). Largest variation in growth trends is found between faster
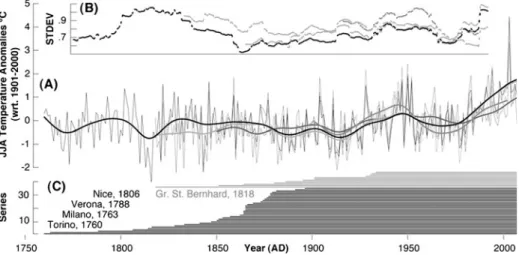
Fig. 3 a Summer (June–August) temperature variability of the four different sources: southwestern and high-elevation Alps (1760- and 1818–2007) both (HISTALP; Auer et al.2007), HadCRUT2v (1850–2007) (Brohan et al.2006), and CRUTS2.1 (1901–2002) (Mitchell and Jones2005). Bold curves are 30-year low-pass filters. Mean correlation (1901–2002) between the original and smoothed summer temperature records is 0.83 and 0.32, respectively. b Moving 31-year standard deviation of the four mean temperature records, and c length of the individual HISTALP (southwestern black and high-elevation grey) stations
growing (mainly younger) trees from the three updated sites and relatively slow growing trees from the original site 4. While the RC of this site indicates a fairly flat trend, the RCs of the other three sites similarly describe the shape of negative exponential functions. A smaller but systematic offset exists between the slower growing old trees (>300 years) and the faster growing young trees (<200 and <300 years). Differences in RCs are not visible between living trees and dead material. Growth trend comparison indicated that some exceptionally old individuals of site 4, which span nearly the full last millennium, have substantially lower growth rates in comparison to our updated specimens. This offset in growth level appears to be most distinct during periods of juvenile tree growth (Fig. 4a). In summary, different growth rates and trends between the various subsets mainly display diverse tree longevity and thus sampling strategies, i.e., inclusion versus exclusion of younger age-classes (see also Esper et al.2008for details).
3.2 Chronology characteristics
Spline chronologies composed for each subset exhibit strong agreement at inter-annual to decadal time-scales (Fig.4b). The living and dead material correlates significantly at 0.86, and extremely high correlations between site chronologies vary from 0.62 to 0.84 (p< 0.001). Even higher correlations occurred among the different age-classes (0.86–0.92), which are likely inflated by the inclusion of trees from the same locations in comparison
Fig. 4 a Regional curves (RCs) after series splitting according to site location, tree age, and living/dead material. b Corresponding 300-year spline subset chronologies. Vertical lines indicate common periods of overlap used for cross-subset correlation analysis
to the more rigorous geographic (site) and horizontal (living/dead) subsets. The varying replications of the chronologies further impact the correlation coefficients obtained. Increased sample size equals higher coherency.
A difference series that was calculated between two RCS chronologies with and without pith-offset information shows no trend (R200.0), and correlation of the two RCS chronol-ogies with and without pith-offset is 0.99. A suite of ten differently detrended mean chronologies integrating all 398 series describes highly similar variations over most of the last millennium (Fig. 5b). Sufficient internal signal strength of the ALL compilation is expressed by EPS values constantly above the widely accepted quality threshold of 0.85 back until 985 AD (Fig.5a). Rbar values fluctuate around a mean of 0.43. Variance between the individual records, however, rapidly inflates during the last decades of the 20th century, and slowly increases from ~1400 AD backwards. Superimposed on the constantly decreas-ing sample size back in time are replication changes ~1100, 1400, 1700, and in 1974 (Fig.5c). The first three steps are related to the dropout of dead samples from site 3, the rather abrupt beginnings of sites 1 and 3, and the parallel inclusion of living trees from sites 1, 2 and 3, respectively (Fig.2a). The early ending of site 4 in the mid-1970s caused the most severe decline in modern sample size.
3.3 Climate sensitivity and trends
The main climatic driver of larch growth in the Maritime French Alps is warm season temperature variability averaged over April-August (Fig.6). Positive correlations of 0.42 are obtained with June temperature and the ALL chronology after RCS detrending. Generally lower correlations (0.31–0.37) are derived from the different subset chronologies as well as from the ALL chronology after spline detrending (Table2). These values are indicative for
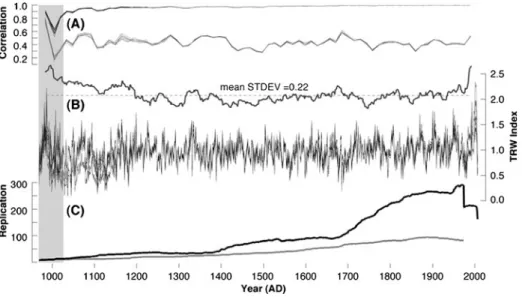
Fig. 5 a EPS (black) and Rbar (grey) values of b the ALL chronologies using ten different detrending/ chronology combinations (individual negative exponential, 150 year and 300 year spline, and composite RCS and RCS plus pith-offset/with and without power-transformation), and their moving 31-year STDEV. c Chronology replication ranging from 8 (969 AD) to 292 (1970 AD) series (with the grey line referring to the initial replication of site 4). The grey vertical shading denotes the record’s early portion of decreasing signal strength, increasing variance, and low sample replication
the high degree of internal signal strength within the dataset, but also highlight the impor-tance of frequency preservation during the detrending process. Negative correlations with precipitation and drought are mostly non-significant, and previous year climate appears to have little effect on TRW formation at these sites.
Spatial correlation analysis between the ALL record and high-resolution gridded summer temperatures revealed temporally changing patterns between the early and late 20th century (Fig.7). While a significant amount of variance is explained over the central Mediterranean area (30–45 °N and 5 °W to 15 °E) after 1954, a smaller region of lower correlations is found before 1953. Moving correlation analysis between the ALL chronology and southwestern summer temperature variability also retains temporal instability in the growth-climate relationship, and correlations of 0.56–0.86 after 10–60 year low-pass filtering collapse to −0.19 when using the early period (not shown). Nevertheless, caution is advised when interpreting these growth-climate response patterns as some degree of ‘noise’ is likely associated to the proxy as well as target data (Gershunov et al. 2001; Büntgen et al.
2006b). Hence, simply the best tree-ring proxy records together with carefully homogenized instrumental targets should be used to draw spatiotemporal conclusions on growth-climate relationships (Büntgen et al.2008b,2010b; Esper and Frank2009b).
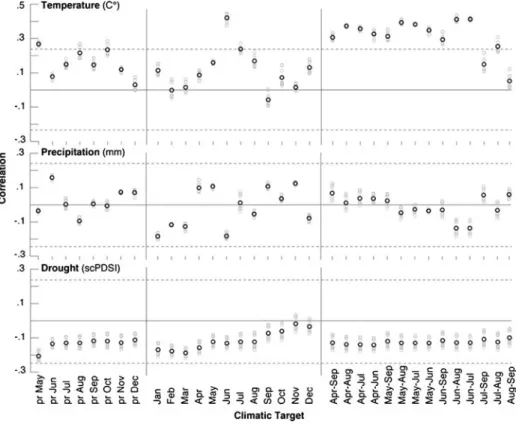
Fig. 6 Growth response of ten ALL chronologies (grey) and their mean (black) computed against 20th century climate data from previous year May to current year December, and 14 seasonal means between April and September. The meteorological target (1901–2002) data were selected from the gridded CRUTS2.1 dataset of 0.5° resolution, averaged over the 44–45 °N and 7–8 °E region. Dashed lines refer to the 95% significance levels after correcting for the mean first order autocorrelation among the individual proxy/target timeseries
Utilization of different meteorological sources for the greater Alpine region indicated the importance of choosing the proper climatic target (Frank et al.2007a; Büntgen et al.2010a). Overall highest correlations are obtained with the summer June–August interval (Fig.8a), whereas lower correlations are found towards the growing season end from August– September (see Moser et al.2010for details on intra-annual growth variability). While the highest correlation of 0.53 is gained from the HISTALP southwest subset, significantly lower correlation of 0.27 originates from the low-resolution HadCRUT3v data (Brohan et al.
2006), both against June–August temperature means. This order maintains amongst all 14 seasonal windows: highest agreement with the nearby southwestern measurements and lowest agreement with the coarse 5.0° grid-box. Temporal overlap of the various monthly means lowers the significance of the proxy/target relationship. Interpretation of the obtained growth responses to temperature should therefore consider the dependence among the various June–August temperature targets. As an interesting side point, cross-correlation analysis (1901–2002) of the four different target sources indicates lowest coherency of the large-scale HadCRUT3v compilation with all other data ranging from 0.75 to 0.78 (Fig.8b). In contrast, highest correlation is found between the two HISTALP subsets (r00.93). See
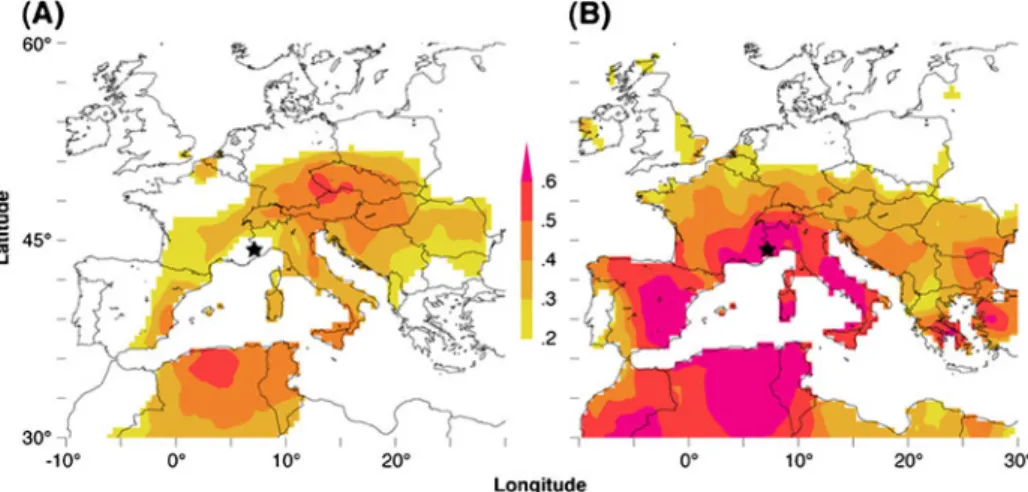
Fig. 7 Spatial field correlations between the ALL chronology (black star) and June–August temperatures (CRU TS3) computed over the a early 1901–1953 and b late 1954–2006 period
Fig. 8 a Correlations (1901–2002) between the ALL chronology and summer temperatures of 14 different warm season means and considering four different sources (HE0 high-elevation Alpine stations, SW 0 lower elevation stations in the southwestern Alps). b Correlations between June-August temperatures of the four different sources
also Böhm et al. (2001) and Auer et al. (2007) for a critical assessment of climate variability across the greater Alpine region.
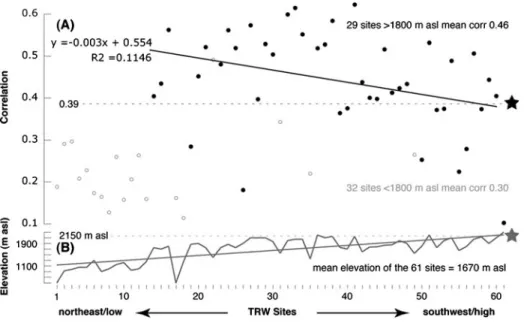
To assess species-specific climate sensitivity at the biome level, 61 larch TRW site chronologies from across the Alpine cordillera were correlated against warm season tem-perature means over the common period 1911–1950 (Fig. 9a). This network approach revealed diminishing proxy/target coherency with decreasing latitude, regardless of the generally increasing mean site elevation (Fig. 9b). As expected, the lowest sites located towards the network’s northeastern edge (in the Austrian Alps) correlated non-significantly with temperature, and sites >1,500 m asl (across the Central Alps) revealed overall signif-icant correlations (p<0.001). A decline in temperature sensitivity, however, was obvious towards the species’ southern distribution limit (in the French Alps). While this pattern closely matches previously reported evidence for increasing summer temperature control upon larch growth with increasing elevation (Frank and Esper2005a; Büntgen et al.2008a), a tendency for fading climate sensitivity when approaching the Mediterranean biome margin, is now, for the first time, emphasized along the entire Alpine arc, and further matches observations from the Pyrenees (Büntgen et al.2010b).
4 Discussion
Potential sources of uncertainty in the herein described growth-climate response patterns may include the sampling design, the detrending methodology, the chronology development technique and the instrumental target data, as well as influences of insect defoliation and associated plant physiological responses, or a combination thereof (4.1). Moreover, it should
Fig. 9 a Maximum temperature response (1911–1950) of 61 Alpine larch chronologies (ordered from northeast to southwest), with the star (and line) indicating the ALL chronology (this study). Data were detrended using 300-year splines after power-transformation. Black (grey) circles describe site chronologies above (below) 1,800 masl, and the black line the linear trend in decreasing sensitivity with decreasing latitude. b Site elevation of the 61 Alpine larch chronologies, with the star (and dashed line) indicating the elevation of the ALL chronology
be noted that climate variability itself could further contribute to spatiotemporal variations in alpine tree growth and thus possibly add uncertainty upon its observed climate sensitivity (4.2).
4.1 Remaining uncertainties
Site selection was driven by the species’ southern distribution limit, the need for the upper treeline, as well as the co-existence of in situ living and dead wood extending back into medieval times, as initially documented by Serre (1978). A constant decrease in sample size during the first half of the last millennium is still evident. This replication decline seems strong enough to bias any climatic interpretation, even though high agreement between the various subsets was found. Enhanced growth coherency among the individual subsets most likely relates to increased sample size, and is in line with recent findings that demonstrated the ability of a massive series replication to overcome low signal-to-noise ratios (Frank et al.2007b), for example in compensating weaker signals associated with juvenile growth (Esper et al. 2008), or with insect defoliation (Büntgen et al. 2009a).
Detrending uncertainty is mainly restricted to the records’ past and present ends, whereas almost no impact was found from ~1200–1900 (Fig.5b). Recent index inflation, commonly known as the‘end-effect problem’ is restricted to chronologies that have been developed using ratios instead of residuals after power-transformation for index calculation (Cook and Peters1997; Frank et al.2009). Offset between chronologies that were either individually or RCS detrended, however, primarily accounts for differences before ~1200 AD (Esper et al.
2007b). Low TRW values during the MCA between ~1000–1100 AD derived from the RCS detrending, and most likely reflect the dominance of old and slow growing trees from site 4. Collecting more dead wood pre-dating the LIA would be essential to improve understanding of this early period. Pith-offset, however, has no effect on the resulting chronologies. This finding is independent of the data and detrending, and confirms work from other regions and different species (Esper et al.2003; Büntgen et al.2005).
A more detailed view on the relationship between larch TRW formation in the southern Alps and warm season temperature fluctuations obtained from different (meteorological) sources indicates the importance of choosing the proper (well homogenized and located) climatic target data (Fig.8). In fact, observational temperature readings can contain several non-climatic biases caused by station relocation, changes in instruments and their screens, changes in recording times and observers, algorithms for the calculation of means, and other changes at the site of measurement, for instance. Complex biases from these sources are often neither randomly distributed in time nor in sign (see Frank et al.2007afor a review). Defoliation-induced growth depressions caused by cyclic larch budmoth (Zeiraphera diniana) outbreaks (Esper et al. 2007a) might also affect the relationship between tree growth and climate change. Associated influences are most relevant at inter-annual time-scales, thus possibly contributing to overall lower correlations in the higher frequency domain. Effects on decadal and lower time-scales, however, appear to be rather small. During periods of Alpine-wide irregular and low-intensity population outbreaks (Büntgen et al.2009b), these sites might even be less affected due to their extreme setting >2,100 masl and the prevailing open forest structure on steep talus slopes. Additional tree-ring parame-ters, such as maximum latewood density (Esper et al.2007a) and/or stable isotopes (Kress et al. 2009), as well as analyses of non-host species and application of refined outbreak detection methods (Büntgen et al. 2009b) might be necessary to better understand long-term insect defoliation patterns in the Maritime French Alps.
It is well known that TRW, for instance, integrates previous year climatic and ecological influences affecting signal-to-noise ratios on inter-annual to multi-decadal time-scales (Frank et al.2007a). So-called carry-over effects on earlywood cell formation might amplify lower frequency variability in the TRW chronologies (Frank et al. 2007a). First order autocorrelations of the subset chronologies after 300-year spline detrending (Table2) range from 0.16 to 0.43. These values increase 0.44–0.59 after RCS detrending, indicating the greater fraction of low-frequency information preserved when applying this composite technique (Esper et al. 2003). On the other hand, autocorrelations (lagged by 1 year) of 0.00, 0.27 and 0.45 are reflected in the June–August precipitation, temperature and drought records, respectively. Even though these obvious differences in first order autocorrelation are suggestive for a‘true’ relationship between TRW and drought, possible biotic biases remain a matter of concern. Physiological-induced autocorrelation reflects the utilization of abun-dant carbohydrates stored towards the end or even after the growing season. Effects on climate sensitivity might follow severe conditions, particularly when trees have not fully recovered from external forcing and use carbohydrate reserves for purposes other than radial expansion. A reasonable improvement of the high-frequency climate signal reflected by the updated ALL dataset could be gained via additional measurements of maximum latewood density, a parameter that has successfully been used to capture variations in Alpine summer temperature (Büntgen et al.2006a; Frank and Esper2005a,b).
4.2 Climate-induced uncertainty
Climate in treeline environments in the southern French Alps is characterized by annual temperature means of ~9°C and precipitation sums >1,100 mm with maxima in spring (April–June) and autumn/winter (September–December) (Fig.1). Site conditions are further influenced by intensive precipitation events, which are mainly related to the ‘Genoa cy-clone’, driven by energetic convective air masses over the Mediterranean Sea. Additional uncertainty in the calculation of climate signals might emerge from the general tendency of underestimating precipitation in higher elevation environments and particularly the Mediterranean area where synoptic modes and topography further complicate regional significance of instrumental station data that generally derive from lower elevations (Luterbacher et al.2006). The commonly low correlation coefficients between larch growth and summer temperature as herein observed, might, at least in the higher frequency domain, be partly caused by fairly high absolute temperature means, elevated sunshine duration due to lower (higher) latitude (altitude), and an extended vegetation period (Carrer and Urbinati
2006).
Temporal instability in tree growth responses to regional climate fluctuations might also be caused by changing climate itself (Frank et al.2008). However, intervals during which temperature control on TRW is lowered, are not in any way compensated by increased precipitation or drought sensitivities, for instance. Strong temperature sensitivity during recent decades parallels modern warming and refutes underlying mechanisms of threshold-induced drought stress (Büntgen et al.2006b). At this stage, we are unable to link the observed fluctuations in climate sensitivity with plausible physiological and physical factors. Higher correlations between tree growth and summer temperature after the 1970s are potentially biased by similar positive trends in both proxy and target timeseries, as revealed by the agreement between the updated and RCS detrended TRW data versus the well-homogenized summer temperature readings after low-pass filtering. The spline-detrended chronologies are restricted in preserving lower frequency information, and generally show lower correlations with climate. For a review of methodological- and data-induced
‘divergence pitfalls’ that might be encountered when processing and analyzing tree-ring proxy and instrumental target records, we herein refer to Esper and Frank (2009b).
5 Conclusions
A total of 398 series from living and dead larch trees samples along ecotones near the upper treeline >2,100 masl at the species’ southern distribution limit in the Maritime French Alps was utilized to update (933–2007 AD) a millennium-long TRW chronology that originally ended in 1974 and was weakly replicated before ~1500 AD. Various tree-ring detrending and chronology development techniques revealed a considerable degree of internal signal strength over most of the last millennium. June–August temperatures were found to be most important for TRW formation. Nevertheless, reconstruction trials failed, because inter-annual growth responses to a single climatic factor were not robust over time and space. We believe that measurements of additional tree-ring parameters, such as maximum late-wood density and isotopic composition, in tandem with more complex climatic target data ranging from locally constraint soil moisture indices to atmospheric pressure patterns, might be helpful when reconstructing Mediterranean climate variability.
Acknowledgments R. Böhm made the HISTALP data available (Austrian FWF, P16076-N06), and spatial field correlations were generated using the KNMI Climate Explorer (http://climexp.knmi.nl). Supported by the EC project MILLENNIUM (#017008-GOCE), and the SNF through the National Centre for Competence in Climate Research (NCCR-Climate).
References
Auer I, 31 co-authors (2007) HISTALP—Historical instrumental climatological surface time series of the greater Alpine region 1760–2003. Int J Climatol 27:17–46
Böhm R, Auer I, Brunetti M, Maugeri M, Nanni T, Schöner W (2001) Regional temperature variability in the European Alps: 1760–1998 from homogenized instrumental time series. Int J Climatol 21:1779–1801 Briffa KR (2000) Annual climate variability in the Holocene—interpreting the message from ancient tree.
Quat Sci Rev 19:87–105
Briffa KR, Jones PD, Bartholin TS, Eckstein D, Schweingruber FH, Karlén W, Zetterberg P, Eronen M (1992) Fennoscandian summers from AD 500: temperature changes on short and long timescales. Clim Dyn 7:111–119
Brohan P, Kennedy JJ, Harris I, Tett SFB, Jones PD (2006) Uncertainty estimates in regional and global observed temperature changes: a new dataset from 1850. J Geophys Res 111. doi:10.1029/2005JD006548
Büntgen U, Tegel W (2011) European tree-ring data and the Medieval Climate Anomaly. PAGES 19:14–15 Büntgen U, Esper J, Frank DC, Nicolussi K, Schmidhalter M (2005) A 1052-year tree-ring proxy for Alpine
summer temperatures. Clim Dyn 25:141–153
Büntgen U, Frank DC, Nievergelt D, Esper J (2006a) Summer temperature variations in the European Alps, AD 755–2004. J Clim 19:5606–5623
Büntgen U, Frank DC, Schmidhalter M, Neuwirth B, Seifert M, Esper J (2006b) Growth-climate response shift in a long subalpine spruce chronology. Trees 20:99–110
Büntgen U, Frank DC, Grudd H, Esper J (2008a) Long-term summer temperature variations in the Pyrenees. Clim Dyn 31:615–631
Büntgen U, Frank D, Wilson R, Carrer M, Urbinati C, Esper J (2008b) Testing for tree-ring divergence in the European Alps. Glob Change Biol 14:2443–2453
Büntgen U, Frank DC, Carrer M, Urbinati C, Esper J (2009a) Improving Alpine summer temperature reconstructions by increasing sample size. In: Malik I et al (eds) Tree rings in archaeology, climatology and ecology. TRACE 7:36–43
Büntgen U, Frank DC, Liebhold A, Johnson D, Carrer M, Urbinati C, Grabner M, Nicolussi K, Levanic T, Esper J (2009b) Three centuries of insect outbreaks across the European Alps. New Phyto 182:929–941
Büntgen U, Franke J, Frank D, Wilson R, Gonzales-Rouco F, Esper J (2010a) Assessing the spatial signature of European climate reconstructions. Clim Res 41:125–130
Büntgen U, Frank D, Trouet V, Esper J (2010b) Diverse climate sensitivity of Mediterranean tree-ring width and density. Trees 24:261–273
Büntgen U, Raible C, Frank D, Helama S, Cunningham L, Hofer D, Nievergelt D, Verstege A, Stenseth N, Esper J (2011a) Causes and consequences of past and projected Scandinavian summer temperatures, 500– 2100 AD. PLoS One 6(9):e25133. doi:10.1371/journal.pone.0025133
Büntgen U, Tegel W, Nicolussi K, McCormick M, Frank D, Trouet V, Kaplan J, Herzig F, Heussner U, Wanner H, Luterbacher J, Esper J (2011b) 2500 years of European climate variability and human susceptibility. Science 331:578–582
Carrer M, Urbinati M (2006) Long-term change in the sensitivity of tree-ring growth to climate forcing in Larix decidua. New Phytol 170:861–872
Cook ER, Peters K (1981) The smoothing spline: a new approach to standardizing forest interior tree-ring width series for dendroclimatic studies. Tree-Ring Bull 41:45–53
Cook ER, Peters K (1997) Calculating unbiased tree-ring indices for the study of climatic and environmental change. Holocene 7:361–370
D’Arrigo R, Wilson R, Jacoby GC (2006) On the long-term context for late 20th century warming. J Geophys Res 111. doi:10.1029/2005JD006352
D’Arrigo R, Jacoby G, Buckley BM, Sakulich J, Frank D, Wilson R, Curtis A, Anchukaitis KJ (2009) Tree growth and inferred temperature variability at the North American Arctic treeline. Glob Plan Change 65:71–82
Esper J, Frank DC (2009a) The IPCC on a heterogeneous Medieval Warm Period. Clim Change 94:267–273 Esper J, Frank DC (2009b) Divergence pitfalls in tree-ring research. Clim Change 94:261–266
Esper J, Cook ER, Schweingruber FH (2002) Low-frequency signals in long tree-ring chronologies for reconstructing past temperature variability. Science 295:2250–2252
Esper J, Cook ER, Krusic PJ, Peters K, Schweingruber FH (2003) Tests of the RCS method for preserving low-frequency variability in long tree-ring chronologies. Tree-Ring Res 59:81–98
Esper J, Frank DC, Wilson RJS (2004) Low frequency ambition, high frequency ratification. Eos 85:113–120 Esper J, Wilson RJS, Frank DC, Moberg A, Wanner H, Luterbacher J (2005) Climate: past ranges and future
changes. Quat Sci Rev 24:2164–2166
Esper J, Büntgen U, Frank DC, Nievergelt D, Liebhold A (2007a) 1200 years of regular outbreaks in alpine insects. Proc R Soc B 274:671–679
Esper J, Frank D, Büntgen U, Verstege A, Luterbacher J, Xoplaki E (2007b) Long-term drought severity variations in Morocco. Geophy Res Lett 34:L17702. doi:10.1029/2007GL030844
Esper J, Niederer R, Bebi P, Frank DC (2008) Climate signal age effects—evidence from young and old trees in the Swiss Engadin. For Ecol Manag 255:3783–3789
Frank D, Esper J (2005a) Characterization and climate response patterns of a high-elevation, multi-species tree-ring network for the European Alps. Dendrochronologia 22:107–121
Frank D, Esper J (2005b) Temperature reconstructions and comparisons with instrumental data from a tree-ring network for the European Alps. Int J Climatol 25:1437–1454
Frank D, Büntgen U, Böhm R, Maugeri M, Esper J (2007a) Warmer early instrumental measurements versus colder reconstructed temperatures: shooting at a moving target. Quat Sci Rev 26:3298–3310
Frank D, Esper J, Cook E (2007b) Adjustment for proxy number and coherence in a large-scale temperature reconstruction. Geophys Res Lett 34. doi:10.1029/2007GL030571
Frank D, Bouriaud O, Wilson R, Battipaglia G, Büntgen U, Fonti P, Treydte K, Trouet V, Esper J (2008) A challenge for spatially explicit reconstructions: the climate response of trees is a function of climate. In: Elferts D et al (eds) Tree rings in archaeology, climatology and ecology. TRACE 6:31–36
Frank D, Büntgen U, Esper J (2009) Response to Late 20th century growth acceleration in greek firs (Abies cephalonica) from Cephalonica Island, Greece: A CO2 fertilization effect? Dendrochronologia 27:223–227
Gao XJ, Giorgi F (2008) Increased aridity in the Mediterranean region under greenhouse gas forcing estimated from high-resolution simulations with a regional climate model. Glob Planet Change 62:195–209
Gershunov A, Schneider N, Barnett T (2001) Low frequency modulation of the ENSO-Indian monsoon rainfall relationship: signal or noise. J Clim 14:2486–2492
Giorgi F (2006) Climate change hot-spots. Geophys Res Lett 33. doi:10.1029/2006GL025734
Grudd H (2008) Torneträsk tree-ring width and density AD 500–2004: a test of climatic sensitivity and a new 1500-year reconstruction of northern Fennoscandian summers. Clim Dyn 31:843–857
Guiot J, Nicault A, Rathgeber C, Edouard JL, Guibal F, Pichard G, Till C (2005) Last-millennium summer-temperature variations in western Europe based on proxy data. Holocene 15:489–500
Jones PD, Briffa KR, Barnett TP, Tett SFB (1998) High-resolution palaeoclimatic records for the past millennium: interpretation, integration and comparison with general circulation model control-run tem-peratures. Holocene 8:455–471
Kress A, Saurer M, Büntgen U, Treydte K, Bugmann H, Siegwolf R (2009) Summer temperature dependency of larch budmoth outbreaks revealed by Alpine tree-ring isotope chronologies. Oecologia 160:353–365 Linderholm HW, Björklund J, Seftigen K, Gunnarson BE, Drobyshev I, Jeong J-H, Stridbeck P, Liu Y (2009)
Dendroclimatology in Fennoscandia from past accomplishments to future potentials. Clim Past Discus 5:1415–1461
Luterbacher J, 48 co-authors (2006) Mediterranean climate variability over the last centuries: a review. In: Lionello P, Malanotte-Rizzoli P, Boscolo R (eds) The Mediterranean Climate: an overview of the main characteristics and issues. Elsevier, Amsterdam, pp 27–148
Mann ME, Bradley RS, Hughes MK (1999) Northern Hemisphere temperatures during the past millennium— inferences, uncertainties, and limitations. Geophys Res Lett 26:759–762
Mitchell TD, Jones PD (2005) An improved method of constructing a database of monthly climate observa-tions and associated high-resolution grids. Int J Climatol 25:693–712
Moser L, Fonti P, Büntgen U, Franzen J, Esper J, Luterbacher J, Frank D (2010) Timing and duration of European larch growing season along altitudinal gradients in the Swiss Alps. Tree Physiol 30:225–233 Schweingruber FH, Bartholin T, Schär E, Briffa KR (1988) Radiodensitometric-dendroclimatological conifer
chronologies from Lapland (Scandinavia) and the Alps (Switzerland). Boreas 17:559–566
Serre F (1978) The dendroclimatologicalvalue of the European larch (Larix decidua Mill.) in the French Maritime Alps. Tree-Ring Bul 38:25–34
Serre-Bachet F (1994) Middle ages temperature reconstructions in Europe, a focus on northeastern Italy. Clim Change 26:213–224
Tegel W, Vanmoerkerke J, Büntgen U (2010) Updating historical tree-ring records for climate reconstruction. Quat Sci Rev 29:1957–1959
Wigley TML, Briffa KR, Jones PD (1984) On the average of correlated time series, with applications in dendroclimatology and hydrometeorology. J Clim Appl Meteorol 23:201–213

![[PDF] Apprendre à travailler avec Microsoft Virtual PC en Pdf | Formation informatique](data:image/gif;base64,R0lGODlhAQABAIAAAP///wAAACH5BAEAAAAALAAAAAABAAEAAAICRAEAOw==)