The Drivers of Retail Performance:
The True Value of Online and In-Store Sales in an Evolving Retail Industry by
Edward C. Tung Bachelor of Architecture, 2011 Bachelor of Arts in Architecture, 2009
Rice University
Submitted to the Program in Real Estate Development in Conjunction with the Center for Real Estate in Partial Fulfillment of the Requirements for the Degree of Master of Science in Real
Estate Development at the
Massachusetts Institute of Technology September, 2018
2018 Edward C. Tung All rights reserved
The author hereby grants to MIT permission to reproduce and to distribute publicly paper and electronic copies of this thesis document in whole or in part in any medium now known or
hereafter created. Signature of Author Certified by Accepted by MASSACHUSETTS INSTITU OF TECHNOLOGY
NOV 13 2018
Signature redacted
_ _ _ _ _Center for Real ste July 27, 2018
Signature redacted______
William C. Wheaton Professor of Economics 0 hesi$SupervisorSignature redacted
TE/ ( Delrnis Frenchman
Class of 1922 Professor of Urban Design and Planning Director, Center for Real Estate
This page intentionally left blank
The Drivers of Retail Performance:
The True Value of Online and In-Store Sales in an Evolving Retail Industry
By
Edward C. Tung
Submitted to the Program in Real Estate Development in Conjunction with the Center for Real Estate on July 27, 2018 in Partial Fulfillment of the Requirements for the Degree of Master of
Science in Real Estate Development
Abstract
This thesis examines the spatial and operational efficiencies of major US retailers in relation to their physical real estate and e-commerce footprints. The continued rise of e-commerce has
altered the dynamics of the retail industry in such a way that has forced retailers to drastically reallocate their resources to stay profitable. One of the biggest questions modern retailers face is how much traditional brick and mortar retail space should be retained as opposed to other resources dedicated to delivered goods, which can include inventory warehouses, distribution centers, fulfillment locations, or simply a strengthened online presence.
To shed light on this issue, we conduct a cross-sectional analysis that investigates the leading factors shaping retailer efficiency and effectiveness using performance data from over 120 of the largest retail companies currently operating in the United States. The results show that
e-commerce sales, indirect sales, and gross margin have positive correlations to distribution space share, employment efficiency, and spatial efficiency and have negative correlations to total cost share, labor cost share, and space cost share. We also determine that indirect sales and gross margin have no correlation to e-commerce sales and accumulated store square footage. By understanding the drivers behind retailer performance, new insight for the outlooks of both retail and industrial real estate asset classes can be gleaned, which can prove to be beneficial to
retailers, landlords, and developers alike.
Thesis Supervisor: William C. Wheaton Title: Professor of Economics
Acknowledgements
To my family, especially my mother, father, and brother, whose love and support I have always counted on throughout my life.
To my thesis advisor, Professor Bill Wheaton, whose guidance and insights have been fundamental in shaping this study.
To my MIT professors, faculty, and classmates who have made graduate school an unforgettable and life-changing experience.
To MKG whose banter has never failed to make me laugh no matter the circumstance.
To Andrea whose unwavering support and encouragement during such a formative time of my life has been invaluable.
Table of Contents Chapter 1: 1.1 1.2 1.3 Chapter 2: 2.1 2.2 2.3 2.4 2.5 Chapter 3: 3.1 3.2 3.3 3.4 Chapter 4: 4.1 4.2 4.3 4.4 Chapter 5: 5.1 5.2 5.3 5.4 5.5 5.6 Chapter 6: 6.1 6.2 Introduction ... Background ... M ethodology ... Thesis Structure ... C o n tex t ... Introduction ... Industry Clim ate ... Factors and Effects of Retail Evolution ... M easures of Efficiency and Effectiveness ... Chapter Sum m ary ... Data and M ethodology ...
Introduction ... Data Sum m ary ...
Analysis M ethodology ...
Chapter Sum m ary ... Analysis Results and Interpretation ...
Introduction ... Observed and Derived Variable Results and Discussion ...
Regression Results and Discussion ...
Chapter Sum m ary ... Real Estate Im plications ...
Introduction ...
City Planning Effects ... Tenant M ix and Selection ... Redevelopm ent Opportunities ...
Tax Regulations ... Chapter Sum m ary ... Conclusions and Opportunities for Further Investigation ...
Conclusions ...
Opportunities for Further Investigation ...
Bibliography ... Appendix A : Supplem ental Inform ation ... Appendix B: Regression Outputs ...
Chapter 1: Introduction
1.1: Background
The retail industry has been experiencing a long-term change for nearly two decades, while pundits and experts have been proclaiming the decline of traditional brick and mortar stores for just as long. The fact that certain segments of conventional retail have experienced detrimental impacts in the last 10 or so years is undeniable. According to the Fung Global Retail and Technology Group's retail tracking report, a total of 6,985 retail store closures were
announced in 2017, which is a 229% increase from the previous year. Conversely, a closer empirical inspection of retail's performance reveals a slightly different story. In the same Fung Group report, 3,433 physical store openings in 2017 were announced - a 50% increase from 2016. The notion that the overall retail industry is deteriorating is not just a gross exaggeration, it is an inaccurate perception. The retail industry is experiencing a fundamental shift with clear winners and losers.
What precipitated such a dramatic shift in an established industry within such a compressed timeframe? The answer to this question includes a multitude of factors including changing demographics, widening income gaps, an oversaturation of outdated retail models, and the rise of online commerce. These elements have caused retailers of all sub-sectors to reinvent themselves in an effort to stay relevant for their ever-changing target consumers, which in turn has had major implications on associated real estate markets. This is not a new revelation with which developers and investors have had to contend. As early as 2000, a forward-looking study from the California Management Review noted that "...[retail] real estate owners will experience losses in income and value if they have not adjusted their business strategy to take advantage of the Internet. There will be an opportunity for investors to win and lose" (Rosen & Howard 2000).
Nearly 20 years after the aforementioned forecast, longstanding performance evidence shows clear winners and losers in the retail arena are finally starting to emerge. Retailers who have capitalized on this changing landscape by leveraging e-commerce as part of their evolution have been able to stay profitable and experience growth. Others like K-Mart, Toys 'R' Us, and
RadioShack have been less fortunate. The question is no longer whether businesses need to adopt a long-term online strategy, but rather, how can businesses implement an effective and integrated online model that supports brick and mortar retail. Equally important: how well has that model performed over time. It is an opportune time to assess the performance and efficiency of major retailers to gain insights on successful and unsuccessful approaches. From this analysis,
conclusions can be drawn to better guide related real estate development and investment decisions
The actual strategies retailers employ to stay relevant and profitable in such a rapidly evolving industry are incredibly nuanced. How should resources be allocated to strike an optimal balance between in-store, indirect, and online channels? Is there an ideal proportion of
distribution space dedicated to supply chain logistics and retail space focused on the experience of in-store customers? And most importantly, how do these factors contribute to the successes or
shortcomings of retailers? The primary hypothesis for this study is that a heightened focus on online and wholesale operations yields greater efficiency and profits. We test this hypothesis using updated measures of performance that specifically account for costs and revenues associated with e-commerce and indirect sales to better understand the drivers behind modern retailer efficiency and effectiveness. The results of this examination may provide useful insights to retailers, landlords, developers, and investors who seek to create optimum spatial efficiencies, balanced tenant mixes, and dynamic mixed-use developments.
1.2: Methodology
Traditional retail key performance indicators (KPIs), such as same-store sales and sales per square foot, do not directly address the impact e-commerce and other selling channels have on modern retail productivity. Since physical stores are not the sole distribution channel to reach consumers, this paper specifically measures e-commerce and indirect sales revenues in relation to spatial and employment footprints. Using a current performance data set of 122 of the largest retailers currently operating in the United States, we derive a series of variables that help us understand how companies are allocating their resources. The analysis also involves constructing a series of multivariate ordinary least squares (OLS) regression models with eight (8) dependent
variables and six (6) independent variables. The objective of the analysis is to establish an empirical, cross sectional assessment of the contributors to retailer success.
1.3: Thesis Structure
The remainder of this paper is structured as follows. Chapter Two provides a contextual background by expounding on retail industry trends and key factors impacting national consumer predilections. Chapter Three defines the data being analyzed and the methodology behind the derived variables and regression models. Chapter Four discusses the overall results of the
analysis, highlighting notable take-aways from each model. Chapter Five examines the specific real estate implications based on the research and analysis. Lastly, Chapter Six summarizes the discussion and explores potential opportunities for further investigation.
Chapter 2: Context
2.1: Introduction
Given the amount of change the retail industry has experienced and continues to
experience, this chapter provides a contextual understanding of the current and past trends in the retail industry, as well as the factors driving its evolution. An enormous amount of studies has been conducted in this field, so we only draw upon the most relevant resources related to retailer efficiencies and changing retail trends. The goal of this contextual overview is to lay the
groundwork such that the subsequent analyses can be better comprehended for both present and future use.
The following review first provides a general background of the retail climate based on industry reports, scholarly articles, and interviews with industry experts and professionals. After the general overview, the leading factors driving the decades-long retail industry transformation will be discussed in greater detail. This will include examinations of the widening income gap, changing age demographics, the rise of e-commerce, and an oversaturation of outdated retail models. It is important to note that these factors are closely interrelated and the impacts on retail markets from each individual factor are not easily quantified - however, having this contextual background on the drivers of modern retail is essential to understanding our analysis results (Chapter Four) and the real estate implications (Chapter Five). Finally, the synopsis will cover the concepts of retailer efficiency and effectiveness, which are integral for how this study frames retailer success.
2.2: Industry Climate
The retail industry is an incredibly well-established business sector that generated a record $5.7 trillion in 2017 based on U.S. Census data. Due to its immense capital presence, retail is often used as an indicator of the country's GDP growth. Typically, a 1% rise in retail sales add roughly 0.3% to GDP, all else being constant (Stutely 2006). Thus, understanding the state of retail sales and the associated consumer confidence levels can provide strong insight on
future economic outlooks. In fact, the Federal Reserve Bank of Atlanta who developed
GDPNow, a tool to gauge the health of the US economy by calculating constant GDP updates, uses retail sales as a primary hard-data benchmark (Higgins 2014). As shown in Figure 2A, adjusting for inflation and deflation, changes in retail sales activity is closely tied to the nation-wide economic fluctuations with predominately positive correlated trends.
Figure 2A: Retail Sales Growth to Real GDP Growth 15.0% 10.0% 1992 1994 1996 1998 2000 2002 2004 2006 '2 0 V 20 10 2012 2014 2016 -5.0% -10.0% ... Retail Trade - GDP
Source: US Census Bureau - Retail Sales Report, US Department of Commerce, Bureau of Economic Analysis
However, the retail industry is inherently nuanced with a variety of classifications that perform differently depending on consumer preferences and demand. Statistics tracking the
Census Bureau's North American Industry Classification System (NAICS) shows just how disparate the performance of individual classes of retail can be (see Figure 2B).
The Drivers of Retail Performance
10
Figure 2B: Retail Trade Sales Growth by Segment (Seasonally Adjusted) 25.0% 20.0% 15.0% 10.0% -5.0% ..-. -15.0%
--- Electronics - - -Food - -Health Care
SApparel - -- Books & Music -- General Merchandise
iRetail Trade
Source: US Census Bureau - Retail Sales Report
Of note, in the early to mid 1990's, the electronics retail industry performed very well, experiencing astronomical growth in tandem with the dot-corn boom. This included consumer electronics, home appliances, and computing equipment. During the subsequent dot-corn crash in the early 2000's, other retail sectors such as Apparel, Food (grocers), and General Merchandise (namely department stores), never dipped to negative growth rates. Books and Music sales, however, experienced consistent reductions in growth rate, dropping to a negative rate in the mid 1990's when Amazon really became a viable marketplace. The Great Recession in 2008 heavily impacted retail sales across all sectors with the exception of retail health care (pharmacies and drug stores) with over 4% sales growth through 2008. Although individual retail sectors are positively correlated to each other in general, their responses to certain economic shocks can vary significantly.
Further, and perhaps more importantly, retail segments are not necessarily positively correlated to overall industry conditions. For instance, per Figure 2B above, between 2014 and 2017, Electronics and Books and Music sectors saw net declines of approximately 10% despite the performance of the retail industry overall (highlighted by the bold line, Retail Trade), which
saw roughly 5% growth during that same period. Additionally, in both major economic crises of the early and late 2000's though the overall retail industry saw downturns, specific sectors fared well and some sectors, like health care, even realized sales increases.
The profits reaped by retailers are not spread equitably; it is clear that certain categories of retailers are outperforming others. However, while product offering is certainly a factor in determining successful retailers, a finer inspection reveals that even within the retail classes that have fallen on hard times like Electronics and Books and Music, there are clear winners and losers. The most obvious comparison would be between Amazon (winner) and Borders (loser), who once occupied the same retail sector as direct competitors.
The perception that retailers across the board have taken a huge hit during and since the Great Recession is not an unfounded one. Maturing debt, which outpaced revenue, coupled with increased short-term interest rates of forced many household name brands to shutter - a trend that does not seem to be slowing (Egan 2018). In 2017, 22 major retailers were labeled as distressed by Moody's with Caal or lower ratings. This tops the previous record of 19 retailers listed as distressed at the depth of the Great Recession (Bergman 2018). As continued evidence against the notion that only certain segments of the retail industry are on their deathbeds while others are spared, the list of distressed retailers span all classifications including Electronics (hhgregg), Apparel (Vince, J-Crew), General Merchandise (Neiman Marcus, 99 Cents Stores), Books and Music (Barnes and Nobles), and Food and Grocery stores (Fairway, Tops Holding). As observed in current and historic research, the well-being of the retail industry is difficult to accurately capture in a single synopsis. A complete understanding of the retail industry's nuances is necessary to fully appreciate the breadth of change that has, and is currently, taking place. In turn, recognizing this transformation is fundamental to any real estate retail asset investment decision. This is an important point to keep in mind as we examine the factors and effects of retail's evolution.
2.3: Factors and Effects of Retail Evolution
In this section, we take a closer look at the causes and effects of the changing retail landscape. Some of the factors we explore here may be fairly intuitive or well-understood given the amount of news coverage they have garnered. Nevertheless, it is a useful exercise to examine these issues to establish adequate context for our subsequent analysis. It is a timely examination because many of the prognostications over the last decade are now coming to pass, with a few unexpected results. Four primary factors are discussed: the widening income bifurcation, changing age demographics, the rise of e-commerce, and the oversaturation of outdated retail models.
The Widening Income Bifurcation
At the heart of any retailing strategy is the target consumer or demographic. The entire objective of an omnichannel approach that has become so ubiquitous amongst all major retailers is to better reach and connect with their customers through a variety of channels (online, mobile, in-person, etc.). How such a strategy is carried out is greatly dependent on the focus
demographic, and although there are specialty brands that cater to unique user groups, by and large, the most coveted customer bases are those with the capacities and willingness to spend money. Unsurprisingly, one of the closest proxies for this shopping tendency is income (Yardeni et al 2018).
At surface level, the higher overall income levels during the recovery years of the Great Recession would seem to broadly benefit the retail industry. The 2017 nationwide
unemployment rate of 3.9% is the lowest unemployment rate since the pre-recession days of 2008. Real median annual household income increased by roughly 18% from 2007 to 2016 and, at this time of this writing, is resting at approximately $59,000 (NAIC 2017). However, during that period, housing costs and other living expenses have also increased substantially. As such, for the purposes of evaluating the associated income ramifications to retailers, discretionary income is a more accurate measure. Discretionary income is defined as disposable income (income after taxes) less essential expenses such as health care, housing, food, transportation,
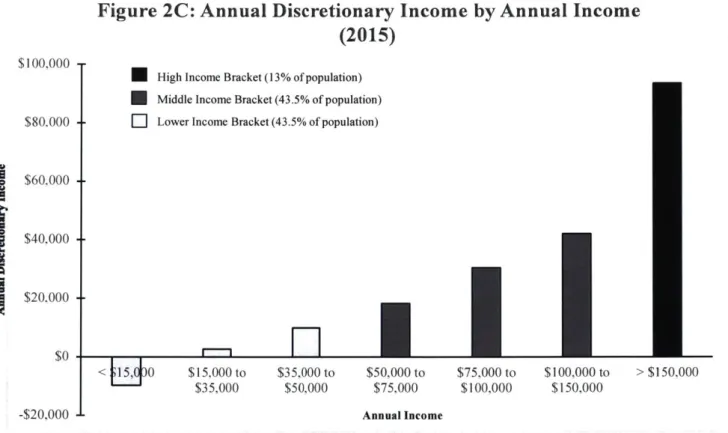
and education. Diving into the changes in discretionary income at a more granular level reveals a lot more about the nation's spending habits and the related impacts on the retail industry. In the same 2007 to 2016 timeframe that median incomes increased by 18% as noted previously, transportation expenses increased by 3%, housing by 12%, food by 17%, education by 41%, and health care by a staggering 62% (NAIC 2017). All this leads to a stark stratification of the actual spending power for the different income groups. To see just how impactful the expenditures increase has been, Figure 2C shows the average amount of annual discretionary income per income group in 2015 based on average deductions for essential goods and services from the Bureau of Labor Statistics.
Figure 2C: Annual Discretionary Income by Annual Income
(2015)
$100,000 High Income Bracket (13% of population) Middle Income Bracket (43.5% of population)
$80M000 Ei Lower Income Bracket (43.5% of population)
$60,000 $40,000 $20,000
$0171]
<[J0 $15,000 to $35,000 to $50,000 to $75,000 to $ 100,000 to > $150,000 $35,000 $50,000 $75,000 $100,000 $150,000 -$20,000 Annual IncomeSource: US Census Bureau, Bureau of Labor Statistics (utilities include natural gas, electricity, fuel, oil, trash, water)
Lower income groups making less than $50,000 a year, which comprise over 43% of the US population barely have any discretionary income to speak of, with necessary expenditures outweighing net income for lowest income bracket (less than $15,000). On the opposite end of the spectrum, the higher income class making more than $150,000 a year, which comprises of approximately 13% of the population, has a discretionary income gap of over $50,000 a year to
the next closest bracket - over double discretionary income of the highest middle-income class. This phenomenon did not occur overnight; the gap has been widening for some time. In a study conducted by Deloitte, between 2007 and 2016, the change in discretionary share of income has decreased by 16% for low income households, stayed constant for middle income households, and increased by 4% for high income households (Lobaugh et al 2018). Based on these trends, the income bifurcation will continue to widen, and will continue to have massive implications on the nation's shopping preferences.
So, what effects does this income gap have on the retail industry? For one, because there is a significantly diminished margin for lower and middle-income customers to spend, price sensitivity has become essential. A significantly large portion of shoppers are more willing to seek out discounts and competitively priced goods, resulting in productivity increases in discount stores, convenience stores, and online marketplaces. Secondly, to respond to the market demand, retailers tailor their brands and products to particular consumer segments. The minimal overlap between low and high-income groups has resulted in retailers marketing to one or the other, with little in between. And the results have been apparent. Over the past five years, price-based
retailers (i.e. Dollar Tree) have seen revenues increase 37% and premier-based retailers (i.e. Coach) at an 81% increase. Meanwhile, balanced offering brands (i.e. Gap) have only
experienced 2% revenue growth over five years (Lobaugh et al 2018). Even more stunning is that between 2015 and 2017, price-based retailers have seen 263 net store openings, premier with 109 net openings, and balanced with net 108 closings. Though store classifications can be debated, the overall effect of the income stratification is undeniable - and the industry is reacting accordingly.
However, again, simply because trends point to certain retail segments or target markets outperforming others does not necessarily translate to success for all retailers occupying that space. Based on the data that will be explained in greater detail in Chapter Three as well as other industry reports, Dollar Tree is performing exceptionally well while 99 Cent Stores are in
distress and at risk of folding entirely (BankruptcyData 2017). If anything, the heightened competition and savviness of today's consumers create a retail environment that is conducive to winners and losers.
Changing Age Demographics
In any long-term business model, age trends are primary indicators of who the primary consumer base is and will be. Though this has always been a consistent consideration for retailers over the years, age demographics are particularly dynamic in today's climate. Modern retailers must be marketable to one or more of four generations - all with different consumer preferences and habits (though exact definitions and interpretations for each vary depending on reference source): Baby Boomers (born between 1946 and 1964), Generation X (born between
1965 and 1976), Millennials (born between 1977 and 1998), and Generation Z (born 1999 or later) who are just entering the fray.
Figure 2D: US Population by Age (2016)
30.0 M 25.0 M 20.0 M 15.0 M 10.0 M 5.0 M t Gen Z Pop: 82.11 M $ Power: $44B Milhnw Pop: 87.84M $ Power: $3.39T Gen X Pop: 62.49M S Power: S2.4T I Baby Boomer Pop: 70.11 M $ Power: $3.2T .M LVI .4 , 01-b
Source: US Census Bureau, American Association of Retired Persons (AARP), Oracle Retail
These are certainly generalized categorizations, but the groupings help provide a better understanding of the diverse market demand for both the present and future. The distinct generational tendencies have also fundamentally changed the retail arena because there is no longer one group clearly at the helm with spending power, as Baby Boomers historically have. Figure 2D describes the age-ranges of these four groups with their projected collective buying
The Drivers of Retail Performance 16
-power as of 2017, based on average discretionary income estimates. Though an estimate, the research does indicate an incredibly dynamic marketplace that is in perpetual movement as to who commands the attention of retailers. Millennials have recently overtaken the Boomer's spending capacity, and that disparity will only continue to widen. Retailers, developers, and marketers have taken note with more products and services directed towards this consumer class. Though still in its infancy in spending years, Generation Z is primed to make a massive impact on the market. By 2020, Generation Z is projected to represent 40% of consumers in the nation (Fromm 2018). Although these last 10 years have seen drastic shifts in market share, it will be just as interesting witnessing how the next 10 unfold.
Two major factors when considering spending power and associated discretionary income, particularly when taking demographics into account, are debt obligations and savings habits. The personal savings rate, which is defined as the ratio of money saved by households to their disposable incomes, is a good indicator of consumer confidence. The 2017 national average
savings rate is at an all-time low of 2.4%, comparable to rates just prior to the 2008 crash at 3% (Bureau of Labor Statistics 2017). Although this may be welcome news for retailers in the immediate short term due to the increased willingness to spend in lieu of saving, the signs of a potential bubble and future downturn are difficult to ignore. Likewise, total accumulated debt obligations, including mortgages, auto, credit, and student loans, have increased steadily since 2013 at a compound annual growth rate of 3.8%. The total consumer debt amount is $13.21 trillion as of the first quarter of 2018 (refer to Figure 2E). To put this in perspective, at the height of the housing bubble in 2008, total debt was recorded at $12.67 trillion - a full $540 million below today's consumer debt levels. Again, consumers' willingness to take on added debt is a fortuitous sign for retailers in the short-term but could also be a sign of less encouraging times ahead. All things considered, despite the inherent cyclical nature of the economy, retailers seem to be in a prime position to capitalize on the fact that consumers of all generations are willing to loosen their purse strings, now more than ever.
Figure 2E: Total Accumulated US Consumer Debt 14.0 T . Current (I 8:QI): Pre-Recession High (08:Q3): $13.21T 13.0 T - $12.67T ---13.0 T$540M 12.0 T -11.0 T 10.0 T 9.0 T 8.0 T 7.0 T 6.0 T 5.0
T-Source: Federal Reserve Bank of New York: Quarterly Report on Household Debt and Credit
The age demographic revolution is evident, but what does it mean for businesses looking to capitalize? As a very brief overview from various research reports, the general tendencies of each generational category and the measures that retailers typically take to capture that market share is delineated in Table 2.1 in Appendix A. The primary take-away is, even though each generation has a preferred mode of interaction with retailers or brands, all generations invariably prefer an integrated and seamless experience between brick and mortar stores, online
marketplaces, and mobile sites (more on the importance of e-commerce in the subsequent section). In short, the stronger the connection a business can make between these channels, the more engaged and interested the customer will be, regardless of age or generation (Dennis 2018). Though omnichannel retailing has become somewhat of a buzzword in recent years, when
executed properly, it plays a major role in what separates successful firms from ones that file for bankruptcy. Shifting age demographics is positioned to play an enormous role in the retail industry and there are mountains of research to help retailers position themselves for those trends. Retailers and, in conjunction, real estate owners and developers would be best served to fully understand the needs and demands of their evolving clientele both now and in the future.
The Rise of E-Commerce
E-commerce is certainly not a technologically recent development with its roots intimately tied to packet switching data communication from the early 1960's. Through the 1970's, the use of electronic commerce was primarily utilized for B2B (business to business) and logistics applications, which became the basis for Electronic Data Interchange (EDI) networks. These networks have become commonplace in today's retail sector for efficient supply chain management (Dai & Kauffman 2006). The B2C (business to consumer) channel, the form of e-commerce with which consumers are typically associated, is the distribution method that modern online shoppers and retailers utilize. B2C e-commerce saw widespread use for the first time in the 1990's during the dot-com boom when the internet truly became a pervasive part of people's lives (Venkatraman 2000). Once pioneers like Amazon and Ebay began separating themselves from others, particularly after the dot-com crash at turn of the century, the dynamics of shopping and commerce truly began to shift.
The consumer benefits of e-commerce are abundant. E-commerce provides an effective means to seek competitive pricing by comparing multiple vendors quickly. Similarly, product comparison is streamlined with the ability to easily source new or alternative products. Perhaps most revolutionary is the customer's unfettered exposure to brands and retailers; online stores ostensibly never close and can be accessed anywhere with an internet connection (Stockdale & Standing 2004). The result is heightened market efficiency that generally yields lower prices, less price dispersion, and enhanced price elasticity of demand leading to more frequent and smaller price adjustments (Hdring 2003). Brynjolfsson and Smith (2000) find a 9-16% price decrease between online and conventional retailers for books and music and Pan, Ratchford and
Shankar (2002) yield similar results for consumer electronics. Bailey (1998) finds a significant amount of online prices changes for books and electronics relative to conventional retailers while Brynjolfsson and Smith (2000) quantify the magnitude of these price changes - a minimum of $0.01 for internet stores and a minimum of $0.35 for physical stores. Enhanced market efficiency is a natural consequence of greater transparency and information sharing. For retailers,
question with an extremely complex answer that has confounded some of the largest, and most established retailers in the country.
Despite e-commerce's heightened market efficiency, there are distinguishing
characteristics amongst e-retailers that contribute to an economically imperfect marketplace. H ring attributes the economic disparity in the e-market to virtual location and retailer
differentiation (Haring 2003). Bailey, Brynjolfsson, and Smith posit that online retailers inhabit "neural real estate" with consumer traffic frequenting certain virtual locations over others (Smith et al 2000). This has to do with publicity and exposure of a firm's internet address - similar to how physical storefronts value effective signage and visibility from passersby. Because there exists a certain level of uncertainty of product quality and expectations with online shopping, vendor trustworthiness and reputation play a large role in how customers select e-retailers to conduct business with. Retailers who are able to create a seamless or convenient shopping experience for return customers have the capacity to charge higher prices (Tang & Xing 2001). These lock-in effects can be achieved by methods as simple as one-click ordering, saved login and passwords, or automatic reordering options. All of these characteristics create an imperfect market that is not necessarily driven by the lowest offered price or most efficient profit margins, thereby creating a certain level of price dispersion and allowing for more innovative or forward-thinking retailers to gain an edge over their competition.
Contrary to popular belief, e-commerce is not quite dominating retail sales. As of the first quarter of 2018, the e-commerce share of total retail sales in the US is only 9.4% with
projections of just over 14% by 2021. Refer to Figure 2F.
Figure 2F: E-Commerce Sales as a Share Total of Retail Sales 9 s.. Forecast (*) 16.0% 14.0% ., 12.0% 10.0% 8.0% 6.0% 4.0% 2.0% 0.0%-C> 000000000000 0000000 - Cl CClC C C>~J C> C C C l C) Cl C) C-1 C-- C) C ) C > C :) C > C ) C ) Cl l 0 0 C1 'I - ,I' Ml Cq ~ C ~ - Ml - M C:Y 0 0> 0>
Source: US Census Bureau (Quarterly E-Commerce Report), Forrester Data for forecasts
Although the sales share is still quite low, e-commerce evangelists will point to the continual growth at an increasing annual rate - from a 20-basis point increase between 2000 and 2001 to a 100-basis point jump between 2017 and 2018. Additionally, optimistic forecasts for the continued share growth of e-commerce is due in part to the pervasiveness of the internet. 89% of American households having access to broadband internet and 77% of Americans own
smartphone devices (Pew Research Center 2018). In spite of wide and continual access to the internet, the US is not the leader in online commerce at the global level. The title belongs to China, with nearly 30% of retail sales coming from online channels in 2017 (Birtwhistle 2017). However, whether considering the US or China, it appears as though online sales will continue to gobble retail sales shares, and adopting a wider understanding provides a more balanced outlook.
Physical retail stores have continued to perform well with openings in some of the strongest markets around the country. Although the net effect in recent years has been more closures than openings, this could merely be an indication of overbuilt stock that no longer resonates with today's demands (more on this in the next section). Retailers like Target and Home Depot, who are actively opening new stores, have strong footings in both brick and mortar
and online platforms. Their success is not measured by how many stores are shutting down; rather through the synergies between channels which translates to actual revenue (Bedetti 2017). As further testament to this notion, previously "pure-play" online retailers like Amazon have opened physical stores as part of their long-term business model. E-retailers value the
convenience and unique shopping experiences that brick and mortar offer and are looking to capitalize (Kahn 2018). With this understanding, it is difficult to foresee a future where
e-commerce completely takes over brick and mortar or conversely, e-e-commerce's growth comes to a halt; the reality is likely somewhere in-between with retailers who successfully strike a
harmonious balance coming out on top.
As noted in the Industry Climate overview, different retail sectors perform differently. The online iterations of these sectors are no different. See Figure 2G for a 2010 and 2018 depiction of e-commerce retail sales share segregated by product type. Unsurprisingly,
commodity goods like clothes and electronics have been most sharply impacted by e-commerce
with a 19.7% and 21.9% online sales share respectively. Meanwhile, perishable goods or
products that primarily transact through B2B channels like office supplies still continue to have low e-commerce shares. When comparing each segment's e-commerce share with the national average of 9.4% as noted in Figure 2F, the product type shares vary significantly.
Figure 2G: US E-Commerce Sales Share by Product Type 30.0% 25.0% 20.0% 19.7% 18.00/ 15.0% 10.0% 5.0% V.U70 26.3% 21.9% 11.4% 9.5% 8.8% -7.3% 8
Apparel Auto Books &
Music Electronics 14.3% 11.50 9.5% 6.8% 6.70/.9% 4.5 3% 3.6% 2.5%2.8% 2.7%
n
In
Food & Furniture Healthcare
Beverage 02010 *2018 Office Supplies Toys & Hobby Other Categories
Source: eMarketer, June 2018
With some retail sectors more amenable to e-commerce growth than others, retailers are faced with the quandary of determining the optimal allocation of resources to address both online and in-person shoppers. Though the physical infrastructure required to run a brick and mortar store is unequivocally costlier to operate than maintaining an e-commerce platform, the online infrastructural cost considerations are still noteworthy. Supply chain hubs like inventory warehouses and distribution centers must be strategically located and sized to keep up with the timing expectations of online shoppers (Mi 2017). Because these facilities are typically on the larger side, ranging from 200,000 square feet to over 1.5 million square feet, they are often based out of suburban or exurban locations with lower land values. As such, last mile logistics have typically posed challenges for retailers who have an extensive consumer base, particularly in
dense urban areas. Retailers have implemented solutions like "spoke and hub" distribution models with allocated space in brick and mortar stores for pick-up from online orders or dedicated small-scale fulfillment centers in urban environments. These fulfillment modes have proven to improve operational efficiencies in the short term (Greasley & Assi 2012).
are also costs that e-retailers must consider. Whatever the chosen solution, retailers' ultimate goal is to generate revenue. Building an efficient and balanced distribution network is a critical part of the equation.
Oversaturation of Outdated Retail Models
Sandeep Mathrani, the CEO of General Growth Properties (GGP), a publicly traded REIT and one of the largest owners and operators of retail real estate assets in the country, summed up the current state of the industry succinctly: "Retail in America is under-demolished" (Kenney 2017). Taking Mr. Mathrani's statement a step further, there is an oversaturation of outdated retail assets that have been experiencing functional obsolescence for some time now. The evidence is clear - more than 70 million square feet of retail space is already slated to close in 2018 with the majority of stores ranging between 50,000 and 100,000 square feet (Thomas & Schoen 2018). Big box retailer brands like Toys 'R' Us, Sears, and Sam's Club are the hardest hit, with nearly 1,000 closures between the three. Again, as reiterated in previous sections, simply labeling this as a result of the "retail apocalypse" is a misconception that deserves deeper investigation.
We begin this examination by understanding how we got to this point in the first place. Big box retailers initially came to prominence in America post WWII by offering a large variety of products to its customers as one-stop shops. By utilizing large sales volumes, product profit margins for these retailers could be lowered to offer competitive pricing for their customers, especially when supply chains were streamlined (Smith 2012). Their emergence coincided well with the America's rapid proliferation of suburban development that provided reprieve from the inner city's crime, congestion, poor infrastructure, and subpar school systems. Households were less agglomerated with higher transit and commuting times, which made the convenience of one-stop shops that much more enticing. Further, the reliance on automotive transit made the big box model much more convincing by providing expanses of parking. It provided a convenient way for shoppers to conveniently shuttle large volumes of goods home. Sustainability and urban planning criticism aside, this seemed to be a suitable and effective business model. And it was
by the 1970's, one out of every 204 Americans was employed by Sears, one of the largest big box retailers at the time (Halzack 2017).
However, some of the major side-effects of the rise of the big box was the
homogenization of brands with products becoming commodities and shopping experiences becoming banal and formulaic. These retailers were aptly dubbed "category-killers" with smaller brands unable to compete with the price points and convenience of their larger counterparts (Fagan 2011). The reaction was a consolidation of store types with specific brands having a monopolistic hold on their respective niches - Best Buy for consumer electronics, Barnes & Noble for books, Staples for office supplies. These types of stores have traditionally anchored
".power centers" as defined by the International Council of Shopping Centers (ICSC). which have become ubiquitous throughout urban fringe and suburban areas. For reference, see Table 2.2 in Appendix A for a breakdown of shopping center categories per the ICSC. The magnitude of store closings of power center anchors is in line with past observations that power centers are
overdeveloped and risk underperformance due to years of over-speculation.
Due in part to the factors described in previous sections like changing demographics and the rise of e-commerce, big boxes do not provide the unique experiences that consumers now seek, nor do they offer the best value with more competitive prices often found online (Smith 2012). The sheer amount of oversupplied big box stock only exacerbates the change in consumer preference, which is likely why it has garnered so much attention with proclamations that brick and mortar is dead.
Another explanation for why this retail model has fallen out of vogue so quickly is the trend of densification in cities and the preference for urban environments. Walkable locations with ample transit options to local amenities have been strong drivers for successful and dynamic urban developments. There is a litany of research on the positive correlation between distance to transit hubs to property values and asking rent. Municipalities across the nation have also been incentivizing private developers to taken on urban infill and transit-oriented sites with increased development rights, public financing, and tax abatements (Fagan 2011).
However, though the apparent signs point to a mass re-urbanization of cities, the actual "back to the city" movement has not quite happened; in fact, it looks as though the shift is happening in the opposite direction towards the suburbs. Figure 2H shows population levels
segregated by metro type as defined by the City Sector Model (refer to Table 2.3 in Appendix A for City Sector Model categorization methodology). It is important to note that even though this national trend is fairly fitting for most metropolitan statistical areas, there are a select few where urban growth is outpacing suburban growth - namely New York City with urban core growth constituting approximately 74% of its overall MSA population growth between 2010 and 2016. Boston's urban core growth proportion was 41% while Los Angeles' was at a low 11% with the remaining 89% of its growth attributed to suburban or exurban areas.
Figure 2H: US Population by Metro Type
90.0 M 2.83% increase 80.0 M 71.47 73.49 70.0 M 60.0 M 7.43% increase 50.0 M 45.9 49.31 40.0 M 4.08 % increase 30.0 M . 2.66% increase 27.94 29.08 22.93 23.54 20.0 M -10.0 M . 3.17% increase . M 2.21 2.28 0.0 M
Urban Core: CBD Urban Core: Inner Earlier Suburb Later Suburb Exurb
Ring
02010 *2016
Source: Opportunity Urbanism, American Community Survey (2012-2016)
Despite the national growth in the suburbs, both retailers and developers have been implementing urban-oriented retail models with smaller footprints and more selective product offerings. As one example, Target plans to open over 130 small-format stores in denser city locations like Manhattan and Chicago by 2019 ranging from 20,000 to 40,000 square feet with a greater emphasis on necessity-based goods like groceries and pharmacy products (Gonzalez 2018). The strategy involves limiting inventory and back of house space to maximize sales per
square foot metrics. Whether directly from sales or indirectly from heightened brand exposure, the eventual realized revenues must justify the higher rent premiums in urban areas. Based on the actual population trends and the sheer number of actual store closures, it seems like there could be a distinct opportunity to capitalize on strategic redevelopment strategies in suburban sites.
2.4: Measures of Efficiency and Effectiveness
We have touched on the importance of efficiency and effectiveness in preceding sections, but what exactly does that mean in today's industry? Mouzas provides a succinct differentiation between the two terms: "efficiency [is] a necessary condition or hurdle as the company's
operating margins reflect" and "effectiveness [is] the company's ability to generate a sustainable growth in earnings in its surrounding networks." (Mouzas 2006). Put another way, efficiency is a metric of operational execution (i.e. gross margins, same-store sales) while effectiveness is a more overarching measure that factors in efficiency, strategy, and innovation for the ultimate objective of sustainable profits (i.e. long-term gross profits, company mutability). Retailers often get caught in an "efficiency trap," overemphasizing the importance of cost-effectiveness over all else. This is an understandable position because efficiency is not only an easily quantifiable metric by many standards but is also the most direct means for a company to lower the cost of goods and increase revenues (Gaertner and Ramnarayan 1983). In the today's evolving retail landscape, an emphasis on effectiveness as well as efficiency are necessary for companies to be successful.
Amazon is a model case for the successful balance of both efficiency and effectiveness. In the mid 1990's, Amazon's unofficial motto was "Get Big Fast," which meant short-term losses and compromised margins during the company's infancy. In fact, for the first 24 quarters after its 1997 IPO, Amazon repeatedly saw negative net profits. The company saw its first modest profits in 2004 (Griswold & Karaian 2018). Their initial strategy focused primarily on long-term effectiveness, which ultimately paid huge dividends. Since then, efficiency and cost margins have become integral parts of the business without compromising their sustained growth objectives with continued developments like Prime streaming services, the acquisition of Whole Foods, and the openings of Amazon brick and mortar locations. As such, traditional KPIs such as
same-store sales, gross margins, and long-term gross profits should be assessed to not only capture efficiency but also the actual longevity of a retailer's performance. Distinguishing between efficiency and effectiveness is vital in framing our subsequent analysis in Chapters Three and Four.
2.4: Chapter Summary
The contextual groundwork has been laid to provide a base understanding of the current state of the retail industry and its future trajectory. Retail is and has been undergoing significant change. We explored the catalysts driving this evolution including the widening income gap, changing age demographics, the rise of e-commerce, and the oversaturation of outdated retail models. As we have seen, retailers who understand and are able to adapt to these factors can remain profitable and relevant in the eyes of consumers. Comprehending the causes behind such a dynamic shift will greatly inform how associated real estate assets respond and adapt
accordingly. Finally, we made a general distinction between efficiency and effectiveness, which will provide an appropriate lead into our analysis in the next chapter.
Chapter 3: Data and Methodology
3.1: Introduction
Understanding the breadth of the retail industry's change and the factors behind it provides the foundation for quantitative assessment of the impacts. The primary hypothesis considered in this study is that, in light of the rapidly evolving retail landscape, a greater emphasis on online and indirect sales (i.e. B2B) will lead to greater spatial and operational efficiencies and profits. To test this hypothesis, we use current data (as of May 2018) from 122 of the largest US retailers to extrapolate the appropriate e-commerce related metrics that best explain overall firm productivity and profitability. With this data, we construct a series of models to quantify the effects that e-commerce, indirect, and physical store footprints have on the long-term health of the studied retailers using a combination of observed and derived variables.
3.2: Data Summary
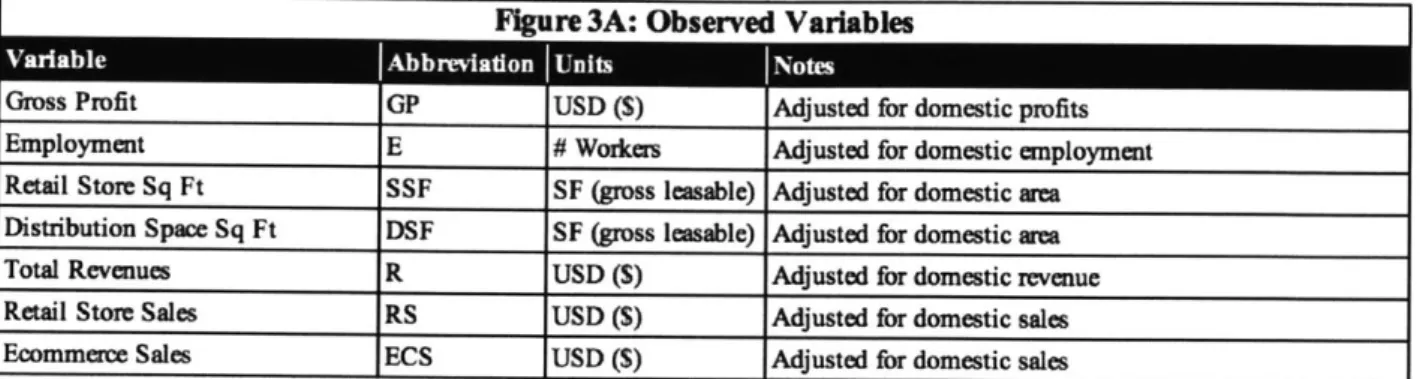
The base data set used in this study is compiled from e-Marketer, a market research company that provides insights and trends on digital marketing, media, and commerce. This study is a cross-sectional evaluation of a trailing twelve-month range taken from May 2018 with data collected from SEC filings, press releases, presentations, and conference calls. The salient data points used as a basis for analysis are gross profit, total employment, total store square footage, total revenues, total retail store sales, and total e-commerce sales. Gross profit is defined as revenues less cost of goods sold and revenue is the raw income a retailer brings in from sales. E-commerce sales are inclusive of B2C transactions from both online and mobile channels. Although distribution space square footage is not included in the base e-Marketer data set, these areas are collected from individual firm 10-K reports from the 2017 and 2018 fiscal years. Note that all areas are based on gross or total leasable square feet with distribution space including warehouse, inventory, fulfillment, and distribution centers (not inclusive of manufacturing space, corporate offices, or administrative spaces). These entries are all considered observed variables from the base data set. See Figure 3A for a list.
Figure 3A: Observed Variables
*
~--Gross Profit GP USD ($) Adjusted for domestic profits Employment E # Wozkas Adjusted for domestic employment Retail Store Sq Ft SSF SF (gross leasable) Adjusted for domestic rea Distribution Space Sq Ft DSF SF (gross leasable) Adjusted for domestic arm Total Revenues R USD (S) Adjusted for domestic revenue Retail Store Sales RS USD (3) Adjusted for domestic sales Ecommerce Sales ECS USD (S) Adjusted for domestic sales
The list of sampled retailers is then controlled to only consider firms with predominantly
B2C business models. Firms with more than 50% of their revenues coming from indirect sales
(B2B or wholesale) are omitted from the data set. This includes Hanesbrands, Crocs, and Fossil.
Additionally, retailers with more than 50% of revenues coming from services or sales of
non-consumer goods are also omitted. This includes AMC (entertainment services), CVS (pharmaceutical services), CST Brands (fuel/gasoline sales), and Casey's General Stores
(restaurants). Brands with significant research, innovation, or real estate investment departments such as Apple, Nike, and Under Armour are also omitted due to their unrelated expenditures and costs relative to more conventional retailers. Lastly, companies with large international
operations are not included in the sample set. Predominantly international firms are defined as
those with more than 50% of total revenues from sales or operations outside of the United States.
Included in this category are Birks Group (Canada) and Delhaize Group (Europe). A full list of omitted companies and reasons for their exclusion from this study may be referenced to in Table
3.1 of Appendix A.
Derived variables are then determined from the above observed data, which provide important insights themselves. These variables along with their derivations are shown in Figure
3B.
Igure 3B: Derived Variables
Ecommerce Ratio ECR No Units Ecommerce Sales
Total Revenues
Indirect Sales Ratio ISR No Units Total Revenues - Store Sales - Ecommerce Sales
Total Revenues
Cost of Goods CG USD (S) Total Revenues - Gross Prot
Gross Margin GM USD ($) Total Revenues - Cost of Goods
Total Revenues
Distribution Space Share DS No Units Distribution Space Area
Store Space Area + Distribution Space Area Employment * i
Cost of Labor Share CL No Units Gross Profit
(where i = Weighted Average Annual Salary)
Retail Store Sq Ft * r Cost of Retail Store Space Share RS No Units Gross Profit
(where r = Average Retail Store Space Cost) Distribution Space Sq Ft * d
Cost of Distribution Space Share CD No Units Gross Profit
(where d = Average Distribution Space Cost) Cost of Space Share CS No Units Cost of Store Space + Cost of Distribution Space
Total Cost Share TC No Units Cost of Space + Cost of Labor
Profit P USD ($) Total Revenues - Cost of Goods - Employment * i
-Distrubtion Sq Ft * d - Retail Store Sq Ft * r
Profit Rate PR No Units Profit
Total Revenues
Weighted average annual salary (i) is determined by separating full-time employees from part-time employees based on company 10-K reports since the base e-Marketer employment values do not differentiate. Average full-time and part-time salaries for each company are determined by current salary information from Glassdoor, which logs surveyed annual and hourly salaries from employees of all major companies. The weighted average annual salary for domestic employees is determined to be $19,052, which includes sales associates, distribution center handlers, and other staff members.
Average store cost (s) and average distribution space cost (d) are determined from
a weighted national average asking rent for general retail, malls, power centers, shopping centers, and specialty centers as reported by CoStar. Rents are all calculated at triple net (NNN) rental rates, which yield a weighted national average of $17.21 as of the first quarter of 2018. Average distribution space cost (d) is derived from a weighted national average rental rate for warehouses, logistic spaces, and distribution centers as reported by JLL. Similar to store rents, distribution rents are calculated at NNN rates, yielding a national average of $5.53 as of the first quarter of 2018. Retailers who employ third party logistics (3PL) firms are still included in the calculation as there is no distinction between owned, leased, or third party operated distribution centers in the data set. Other associated operating costs for both physical stores and distribution spaces are captured in the derived cost of goods metric (CG).
Finally, adjustments are applied to firms with international operations with domestic revenues ranging between 15% and 50% of total revenues. Recall that any firm with greater than
50% of their revenues coming from overseas are omitted from the sample set entirely. Within the
data set, a total of 15 retailers are deemed to have significant enough overseas operations to warrant adjustments: Amazon, Coach, Costco, GameStop, Gap, Lululemon Athletica, Michael Kors, Ralph Lauren, Sally Beauty, Staples, the TJX Companies, Tiffany & Co., Toys "R" Us, Walgreens, and Walmart. Adjustments are made to gross profits, employment, store space, distribution space, total revenues, store sales, and e-commerce sales. Most company SEC filings differentiate between domestic and international operations, making the segregations fairly straightforward. However, for the select few that do not distinguish between domestic and international employees, a scaled domestic worker factor is derived based on the proportion of total global space (store and distribution) and total domestic space. Likewise, when geographic accounting segregation information is not explicitly delineated in filed reports, scaled profit and sales factors are derived based on the proportion of global and domestic profits and sales values. These adjustments correct for any major outliers due to firms competing in separate
marketplaces, namely those within the US and those outside.
In summary, the cross-sectional data set is comprised of 122 US-based retailers, adjusted for domestic operations, that differentiates between conventional store, indirect sales, and e-commerce performance with their associated footprints. The derived variables provide greater
insight into how the adjusted observed variables factor into overall firm efficiency and effectiveness.
3.3: Analysis Methodology
In addition to observing and comparing the derived variables to gain deeper insights on the performance of specific retailers and their associated retail segments, we construct a series of OLS regression models to quantitatively explain the relationships between variables. Our
analysis is comprised of eight regression models with a total of eight dependent variables and six different independent control variables, taken at a 95% confidence level. Refer to Figure 3C for an accounting of all dependent and independent variables used in each model:
Figure 3C: Regression Variables
Y_ DS 1 Distribution Space Shae
Y2 GP/E 2 Gross Profit per Wodrkw
Y3 GP/(SSF+DSF) 3 Gross Profit per SF Y4 TC 4 Total Cost Share Ys CL 5 Cost of Labor Sham Y6 CS 6 Cost of Space Share
Y7 GM 7 Gross Margin
Ys ECR 8 Ecommerce Ratio X, ECR 1 - 6 Ecommece Ratio
X2 ISR 1-7 !ndirect Sales Ratio X3 GM 1-7 Gross Margin
X4 E 8 Employment
X SSF 8 Store Space SF
X6 DSF 8 Distribution Space SF
The constructed models are equations that take the form of:
multivariate ordinary least squares (OLS) linear regression
Here, the dependent variable (Yi) is correlated to the independent variables (X1, X2, ... ,
X,) by their mean
P
coefficients. In other words, a unit increase in Xi is associated with a meanPi
increase in Yi. x is the constant in the equation, which is the expected mean value of Yi when all independent variables are zero. We choose not to perform log transformations as they do not provide more precise explanations or stronger correlations for these specific models. Asmentioned previously, the overarching question we attempt to answer is how much of a role does each channel (online, B2B, in-store) play in the success and profitability of a retailer and how can that success be effectively measured? We frame the constructed regression models in the form of answering specific questions:
Model 1: How does a firm's emphasis on e-commerce and B2B operations affect the proportion of its distribution space relative to store space? Here, distribution space share (DS) is the
dependent variable with e-commerce ratio (ECR), indirect sales ratio (ISR) and gross margin (GM) as independent variables and a as the constant. Gross margin is included as a variable because it is a strong indicator of the types of goods the retailer sells, which is an important determinant of worker and space productivity:
DS = x +
Pi
(ECR) +p2(ISR)
+ 3 (GM) (3.3-1)Model 2: How does a firm's emphasis on e-commerce and B2B operations affect employment efficiency? Gross profits per worker (GP/E) is the dependent variable with the same independent variables as equation 3.3-1:
GP/E = a + Pi (ECR) + P2 (ISR) + P3 (GM) (3.3-2)
Model 3: How does a firm's emphasis on e-commerce and B2B operations affect its spatial efficiency? Gross profits per square foot (GP/(SSF + DSF)) is the dependent variable with the
same independent variables as equations 3.3-1 and 3.3-2:
GP/(SSF + DSF) = a + Pi (ECR) + 2 (ISR) + P3 (GM) (3.3-3)
The Drivers of Retail Performance
34
34 The Drivers of Retail Performance
Model 4: How does a firm's emphasis on e-commerce and B2B operations factor into the share of total cost of space and labor, which is an indicator on residual profits and revenue? Total cost share (TC) is the dependent variable with the same independent variables as equations 3.3-1 through 3.3-3:
TC = u + Pi (ECR) + p2 (ISR) + P3 (GM) (3.3-4)
Model 5: How does a firm's emphasis on e-commerce and B2B operations factor into the share of labor costs? Cost of labor share (CL) is the dependent variable with the same independent variables as equations 3.3-1 through 3.3-4:
CL = a +
Pi
(ECR) + 2 (ISR) + P3 (GM) (3.3-5)Model 6: How does a firm's emphasis on e-cornmerce and B2B operations factor into the share of space costs? Cost of space share (CS) is the dependent variable with the same independent variables as equations 3.3-1 through 3.3-5:
CS = a +
P1
(ECR) + P2 (ISR) + P3 (GM) (3.3-6)Model 7: Is a firm's e-commerce focus affected by its B2B operations and its gross margins, which is an indication of the types of products offered? E-commerce sales ratio (ECR) is the dependent variable with indirect sales ratio (ISR) and gross margin (GM) as the independent variables:
Model 8: What effects do employment, physical retail stores, distribution centers, and B2B operations have on overall firm profits? Gross profit (GP) is the dependent variable with
employment (E), store square feet (SSF), distribution space square feet (DSF), and indirect sales ratio (ISR) as the independent variables:
GP = +
Pi
(E) +p2
(SSF) + P3 (DSF) + P4 (ISR) (3.3-8)3.4: Chapter Summary
The analysis combines a compilation of the eight regression models as well as a closer examination of derived metrics from observed variables in order to evaluate the performance of the sampled retailers and draw conclusions on their associated online, store, and B2B emphases. With the proposed data set and analysis methodology, we can hone in on our primary focus of determining the relationship between a retailer's financial success and these differing business channels. From there, we can begin to truly dissect the real estate implications within the contextual framework we built from Chapter Two.